

The World’s Greatest Real Estate Market Report For Niagara : 2022
In the interest of living up to its billing, we’ve done this report a little differently. In truth, the 2022 market forced our hand given that it produced wild data swings unlike anything we have seen. And given what happened in the previous 5 years, that is saying a lot.
A few bits before we start.
First, this particular report is looking at the Niagara Region in general. The trends you'll read are transferrable across the entire region so whether you're in St.Catharines, Fonthill or Vineland, you'll find this helpful. For a closer look though, we have you covered.
Our city-by-city report is here.
For this (World’s Greatest) report, we are going to rely heavily on 3 things
Metaphors. Visuals. Charts.
Let’s get started…

WHAT GOT US HERE...
Without going too deep into what preceded 2022, the previous 2 years somewhat resembled highway traffic flow.
Early 2020 was moving along nicely after the slowdowns of 2018 and 2019. People were feeling good, the radio was on and the coffee was delicious.
...SCREEEECH....
COVID arrived in April 2020 and the market seized up as we sat bumper-to-bumper in our sweatpants and uncertainty.
Of course, as soon as traffic loosens up, everyone takes off like they're in a Nascar race, and that is exactly what the rest of 2020 and 2021 did as we emerged from lockdown.
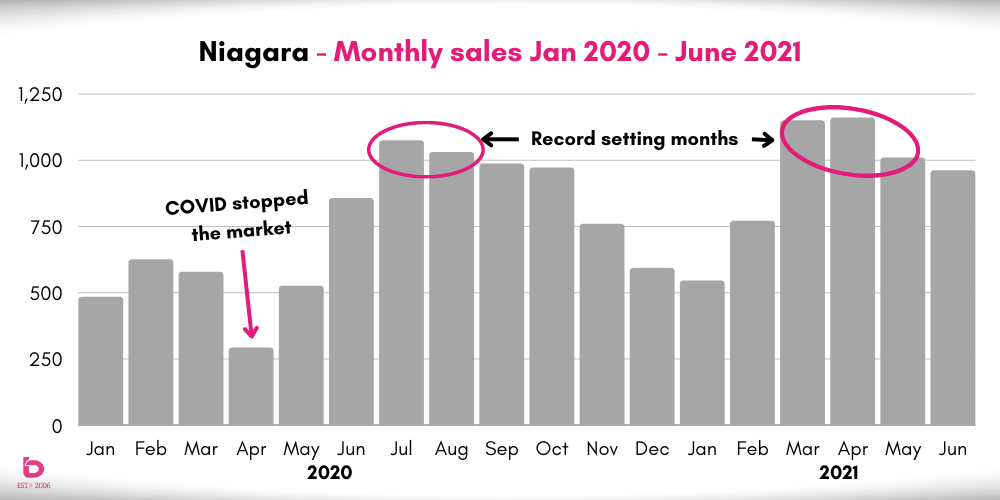
These markets produced 5 record setting months for the number of monthly sales. In fact, Niagara in history has only had 7 months with more than 1,000 sales and 5 of them happened between summer 2020 and spring 2021.
Have a look here:
The market suddenly resembled a typical summer drive up to cottage country. Seatbelts on and the race had begun. That was what brought us into 2022.
Too many cars (demand) and not enough supply (highway lanes).

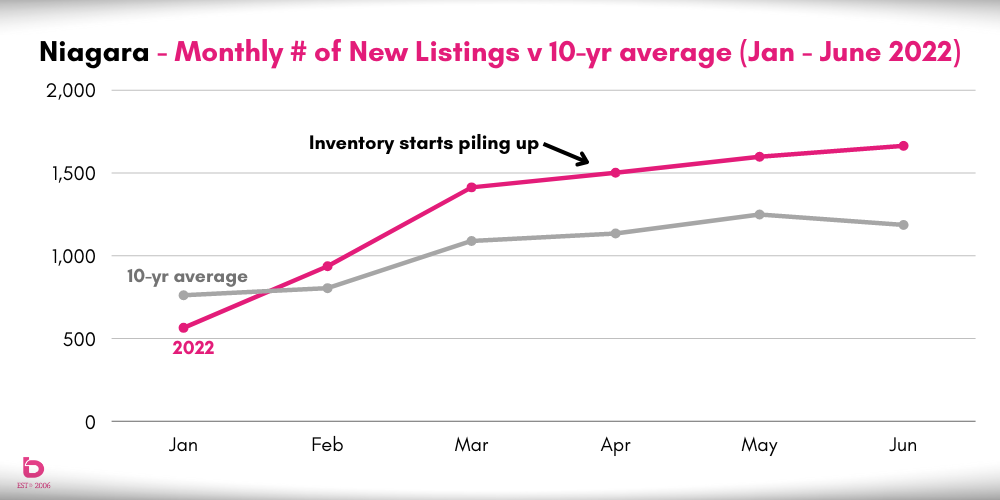
This next chart shows you the last 3 months of 2021 and the first 3 months of 2022 for the number of sales (demand ) and the number of new listings (supply). In a word, the market was tight.
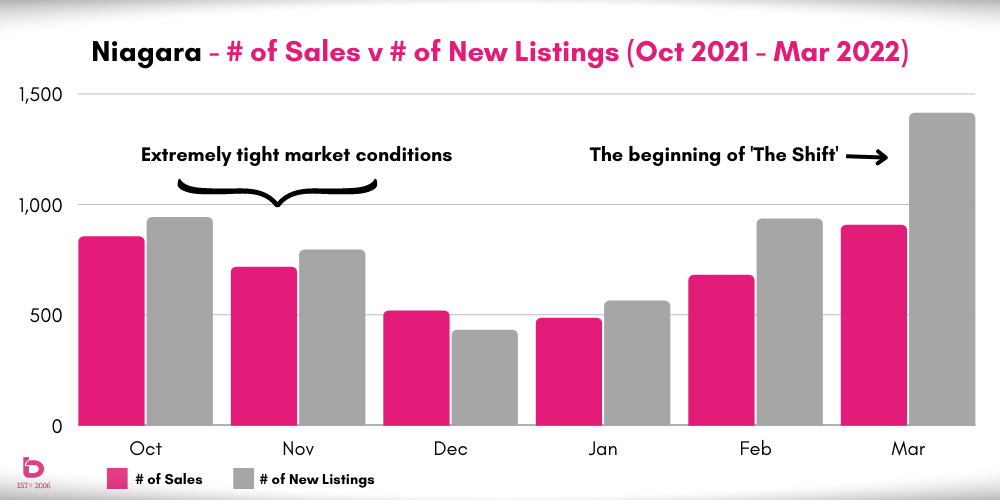
Note how small the difference between sales (pink) and new listings (grey) was as we entered 2022. On a monthly basis, very little inventory was left on the shelves. Case in point was December 2021 which had more sales than new listings, something that is a harbinger of a strong spring market to come. More on that later...
JANUARY - APRIL: "Market Mayhem"
So, if traffic was moving along, imagine open road on Hwy 400 approaching Barrie. Suddenly traffic was moving at palm sweating speeds and that is what we had in early 2022.
At this point, 2 things happened at the same time.
- There were a lot of cars. Historic numbers of them in fact.
- They were driving in only the typical number of lanes.
People were taking chances, blindly changing lanes and hoping for the best. There was road rage and strange decisions being made. It was vehicular mayhem.
Why would people do that?
Fear of loss both in losing the house and pending rate increases were driving the moment. Afterall, they were making great time, so to the driver, the risks were justifiable.
Translated to the Niagara real estate market.
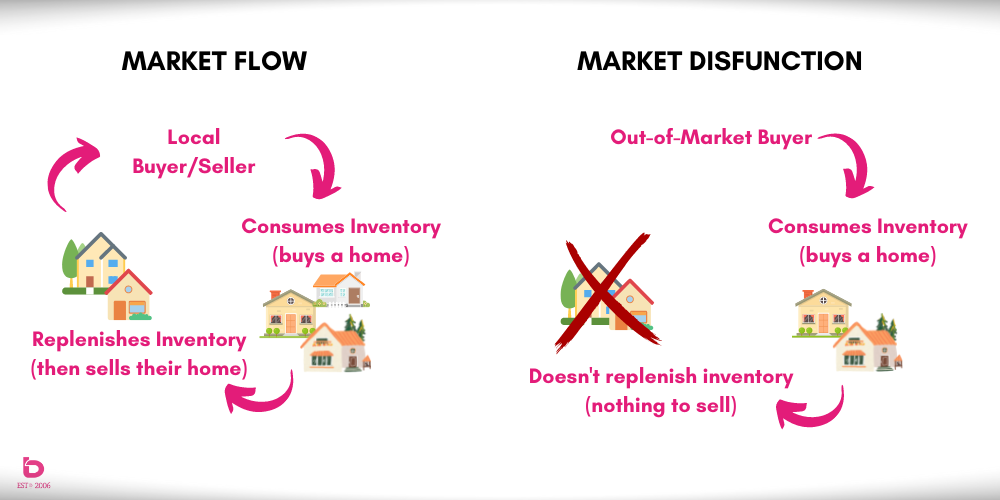
Think of a potluck dinner with 12 people but only 3 brought food. Not exactly a recipe for full bellies.
Since the majority of buyers were from out of market, they were only buying (consuming) and weren't replenishing stock like a local buyer and seller would. It looked something like this:
To sum up: exceedingly high demand at a low supply time of the year (Dec – Feb) compounded by the fact that most buyers weren't actually replenishing the market with new inventory. In fact, new listing inventory in January 2022 was 26% below the 10-yr average while February 2022 was only marginally above normal. High demand + Weak suppply.
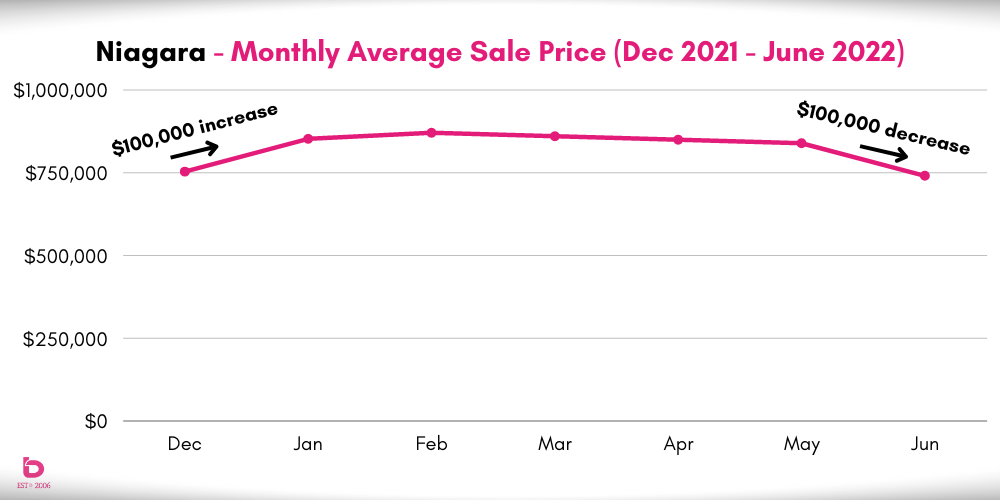
The result was the largest (that we could find) one-month average sale price increase (from December to January). Have a look here:
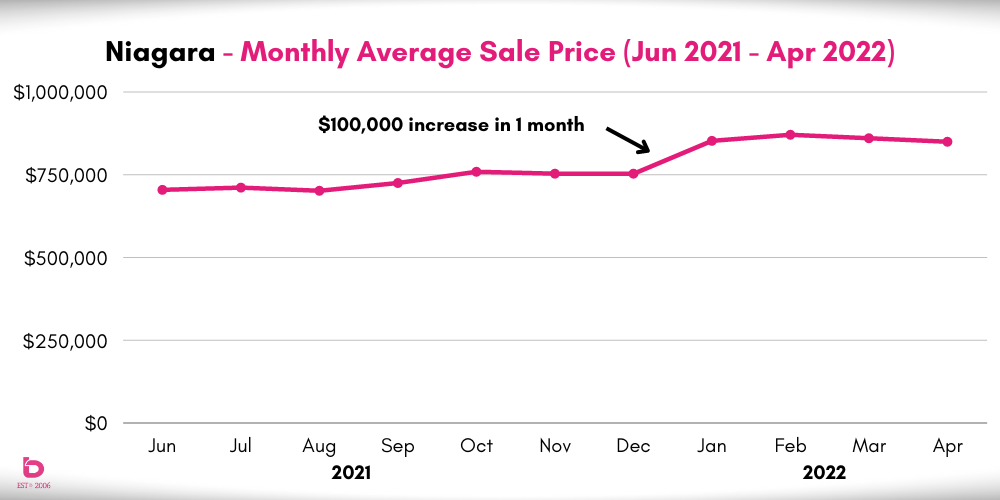
In a market that had annual increases of 3 – 5% for many, many years, an increase of 13% in one month was unheard of.

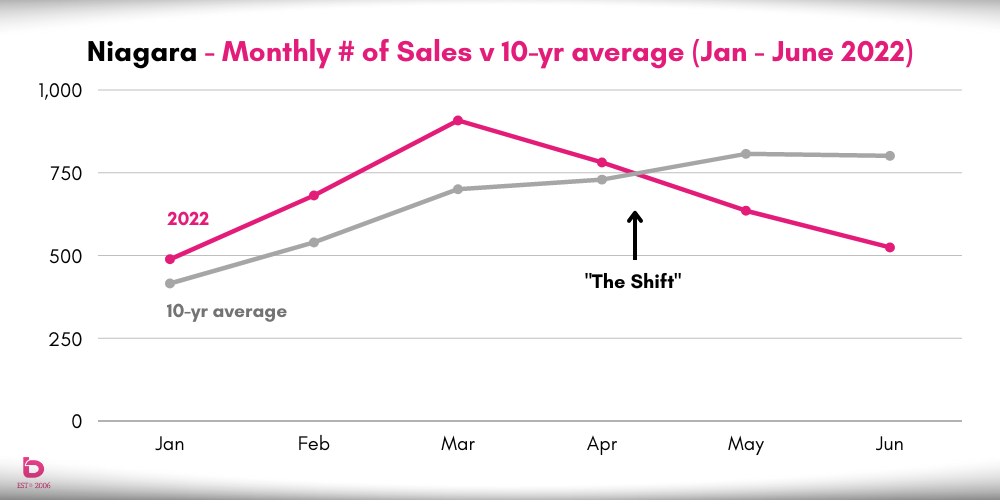
MAY & JUNE: "The Shift"
On March 2nd, 2022, the Bank of Canada showed up and changed the drive completely. While only a .25% rate increase, confidence levels were shaken. Suddenly people started to tense up and eased off the collective gas pedal.
Things felt different.
Cars pulled over. Some took the next exit and turned around to head back home. Others stayed on the road but were now driving under the speed limit.
Suddenly there were open lanes everywhere. The supply of available homes increased dramatically however the confidence to take the leap and buy had nearly vanished. At least buy at those prices.
The Shift had arrived...
By May 2022, the market had flip-flopped. It was a round of golf where you shot 39 on the front and then suddenly couldn’t swing a club on the back. A familiar tale for anyone who has attempted the game.
Look familiar?
By June, the number of new listings were approaching 30% above the 10-yr trend while sales were suddenly nearly 30% below the 10-yr trend. And that divergence was only widening.
These graphs show what was underway:
While those 2 charts show how supply and demand related to the 10-yr norms, have a look at them compared to each other. Sales (in pink) with Number of New Listings (in grey):
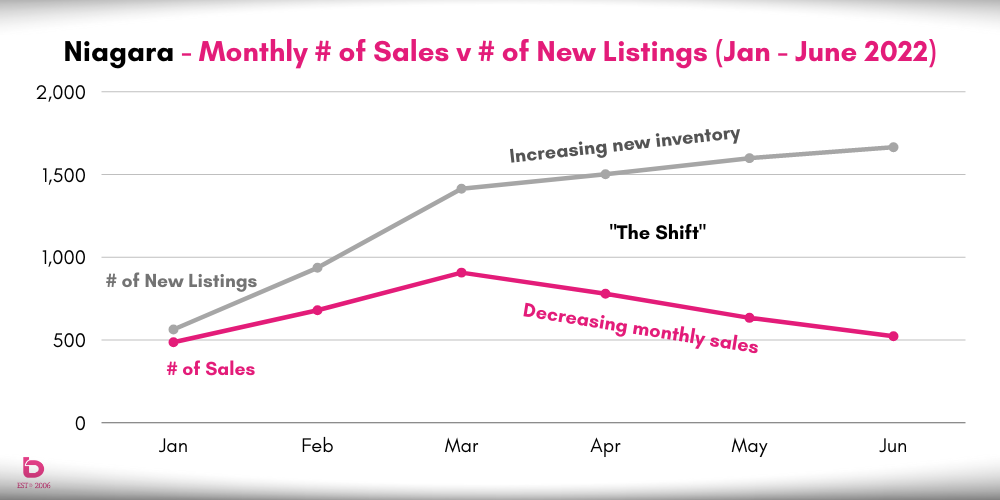
Very clearly, everything was different. On a monthly basis, supply of homes on the market grew while buyer demand retreated, which had an instant effect on sale prices.
How instant? Remember the 13% jump from Dec 2021 to Jan 2022? If you’re a fan of symmetry, you might appreciate the sale price change from May to June. Have a look:
It’s not often we have 2 records for monthly price change in the span of 6 months but as mentioned in the opening paragraph, 2022 produced some wild data swings.
And any time there is a seismic shift, there is pain to be felt.
Early 2022 was exceedingly tough on buyers. Losing out on multiple offers, buyers were running on a treadmill that often just flung them backwards into the drywall.
The Shift was instantly and completely tough on sellers. In particular, those who had already purchased at ‘pre-Shift’ prices and were now selling in this sudden and ruthless new market climate.
Rather than 40 showings and 17 offers, sellers were hoping for a few showings in the first few days on the market.

There is something to be admired in the golfer who consistently shoots 110 and still enjoys getting out for a game. That was the market through the summer into the fall. It was weak but at least it was somewhat predictable. Right?
Reality had set in.
After The Shift snapped everyone to attention, a weighted blanket was thrown over the market. It was still operating, but just consistently below what would resemble normal.
How consistent?
Check out this graph showing the number of sales (in pink) from July to November, compared to the 10-year average (in grey):
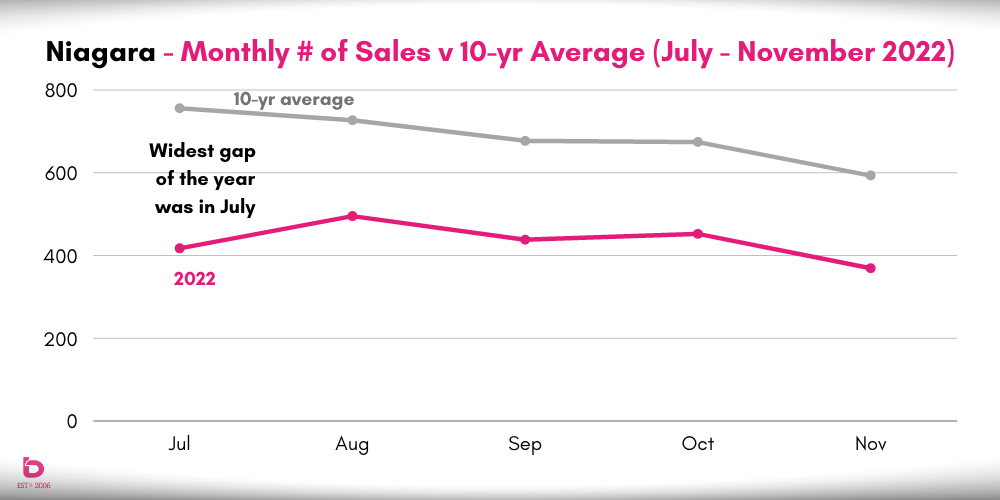
The low point was in July when sales were 45% below the 10-year average. From August through November, the gap eased to be “only” 32 – 38% below the 10-year average. Weak, but consistently weak.
On the supply side, thankfully, the momentum of new listing inventory tapered to settle in 12 – 20% above average, an improvement from the 30 – 40% numbers of The Shift.
What happened with pricing?
With the moderation or consistency, the average sale prices did their best to find their footing. Or as some call it, the bottom.
“Is this the bottom?”
“….are we there yet?”
Have a look and see. This graph shows you the average sale prices for The Consistently Weak period.
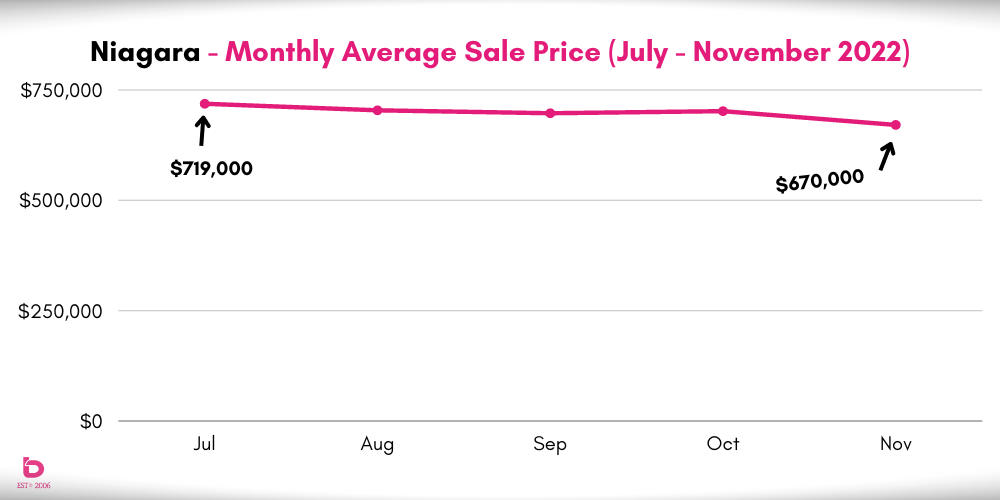
Rather than the significant drops earlier in the year, we've seen more moderate fluctuations the last few months.
However. One month comparisons of average sale price can be tricky. There was a notable pull-back in the upper pricing segments of the market. Yes, home prices overall were down however the upper-end pulled back in relation to the rest of the market. Partially due to reduced supply but also, similar to the COVID 2020 market, the appetite for higher-end homes sat on the sidelines and waited.
Ok. Bear with us. This may look complicated but it sort of isn’t.
This chart shows you the number of homes sold per price segment for April – June (in grey) and September – November (in pink).
Notice 2 things.
1. Overall number of sales was dramatically higher earlier in the year (in grey).
2. The average sale price of that volume was also dramatically higher.
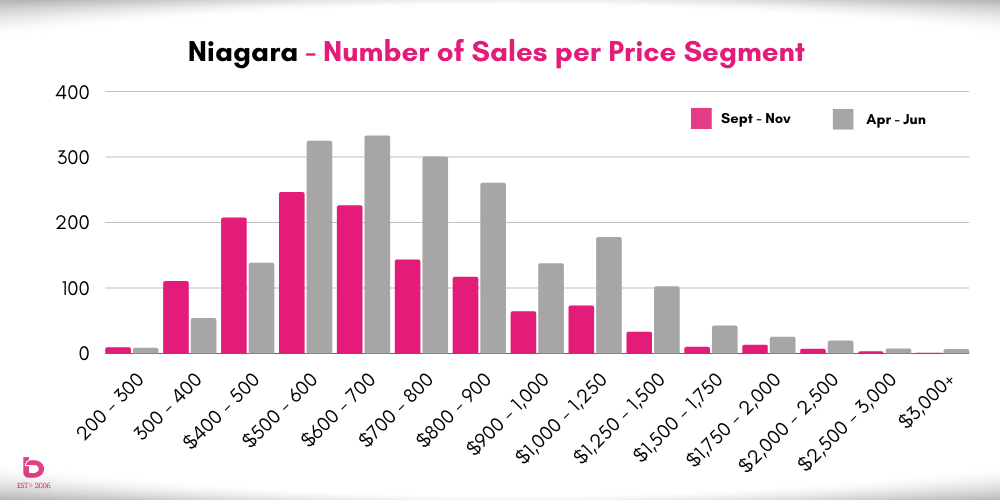
Case in point: The market for $1 million plus homes had a huge impact on annual averages due to the sheer volume of sales early in the year (in grey). Clearly, the appetite for higher end selling or buying has pulled back.
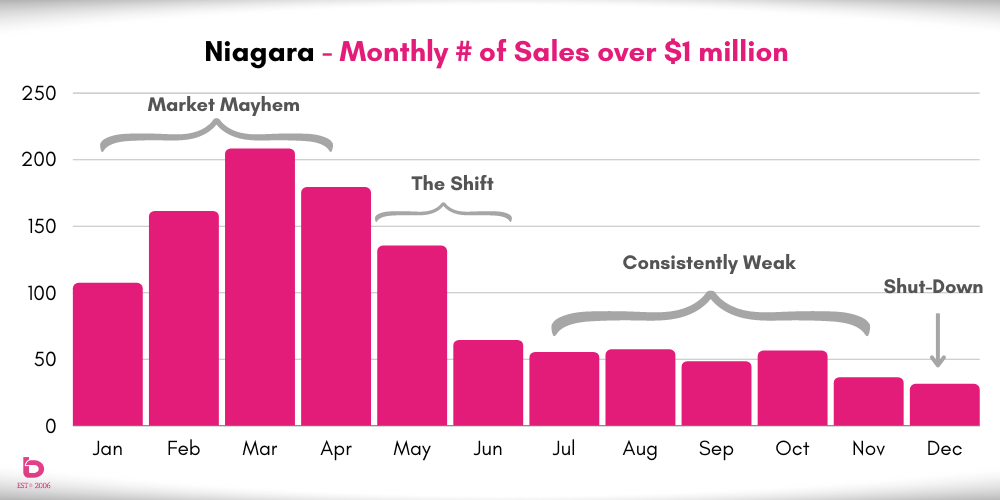

DECEMBER: "The Shut-Down Market"
You can’t blame anyone really. Leftover demand (people who had to buy) was done. Sellers who were looking to buy a specific home tapped out after being unable to fulfill their “sale of property” condition.
At this point, the Bank of Canada had raised rates 7 times for a total increase of 4%. Mission Accomplished, at least as far as pummeling the real estate market goes.
All in all, white flags were raised and people retreated. Remember the visual mentioned above of cars exiting Hwy 400 to turn around and head back? Well, these folks have for the most part pulled into their driveways and unpacked.
How weak was December?
Remember the April 2020 market when we were all hunkered down and hiding in our homes? The number of homes sold in December 2022 barely surpassed that COVID month. Here is the tale of the tape:
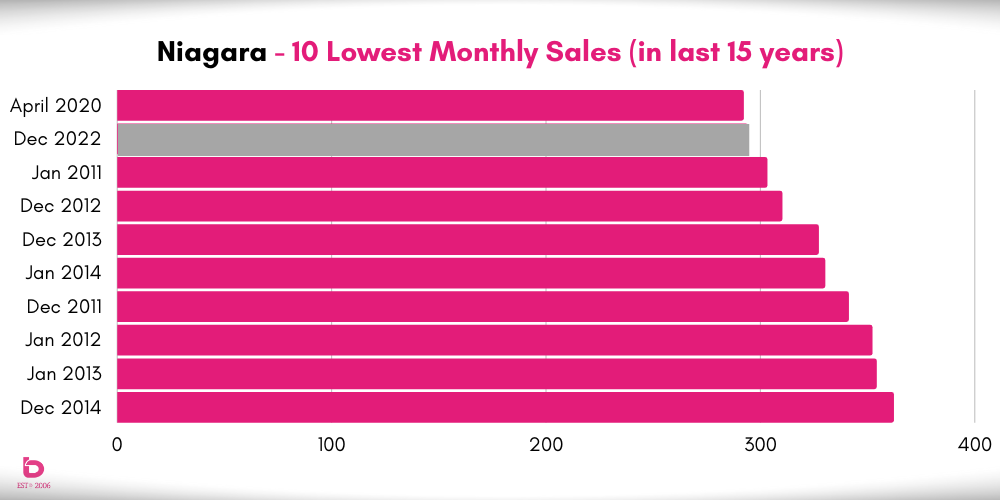
There are no graphs or charts for a singular month that laid such a statistical egg. So, let’s move on!

EARLY 2023: "Copy + Paste"
Let’s go back to the sales vs new listings ratio for the month of December. In the past 15 years, there were only 4 years where sales in December exceeded new listings. Those were 2016, 2017, 2020 and 2021.
What do those 4 years have in common? They are the top 4 years when it comes to annual average sale price increase and 3 of them led into an enormous Q1 in the following year. They were behemoth years.
Average sale price for those years was up this much over the previous year:
2016 + 17.5%
2017 + 22.2%
2020 + 21.1%
2021 + 27.8%
So, how a particular year finishes is statistically (and typically) a strong indicator of what is to come, and if tradition is maintained, Q4 of 2022 is indicative of a Copy & Paste (much of the same) for early 2023.
Have a look at a few Q4 for a few recent years:
| # of New Listings | # of Sales | Diference |
Q1 The Next Year |
|
| Q4 2016 | 2,060 | 1,874 | + 186 new listings | Very strong |
| Q4 2018 | 2,437 | 1,539 | + 898 new listings | Weak |
| Q4 2021 | 2,174 | 2,091 | + 83 new listings |
Very strong |
| Q4 2022 | 2,530 | 1,113 | + 1,417 new listings | TBD |
Note the surplus of new listings over sales in Q4 2018 and Q4 2022, both markedly different from 2016 and 2021.
You could think of that info as the gopher seeing its shadow as a sign of when spring arrives. Perhaps not a direct correlation to how the next market performs but when something happens consistently, there is a trend to pay attention to.
In a nutshell, 2022 limped to the finish line, so it is safe to say that Q1 2023 will perform much the same.
 2023 ANNUAL SUMMARY/GUESS: "No Sudden Movements"
To start 2023, we can expect to see record low sales for the most part as people are still reluctant to re-pack their cars and head out on the highway.
There is something to consider here though. As we move further into the year, some form of comfort level from the consistency of the data will kick in. Perhaps that comfort level will bring some confidence to proceed with it.
Don't forget about the impact that a simple spring market can have...

The spring market will arrive which will bring new inventory. The shock & awe of 2022 will have waned, and opportunities will arise. Add to that the timing of any signs of interest rate moderation or change in language and as quickly as the switch was flicked off, it will flick on again. Or at the least, the dimmer will be slid upwards to shed some light on the market.
Our Expectations for 2023
1. It is only a matter of time until the monthly sales numbers improve.
2. That will close the gap between the supply (new listings) and demand (sales).
3. Average sale prices have likely bottomed so we’ll see them start to (slowly) climb.
4. 2023 won’t be an explosive year. More like a 2018 “the year after” market.
5. The end of 2023 will feed into a healthier and more predictable 2024.
Could the above be wrong? Sure. But looking at historical strong and weak markets, these trends are reasonable expectations.
Keys to Success in 2023:
1. When selling a home, pricing, presentation (how it shows) and marketing will be more important than ever.
2. Buyers will enjoy more supply and a civilized buying environment. For now.
3. If you’re selling and buying, strategy will be even more important. What to do first and how to do it will be worth a serious chat.
4. Patience. Days on the market (how long it takes to sell a home) were 60 – 70 days by the end of 2022. Expect that to continue.
5. Keep an eye on the market data. At some point, the market will get off the ground and start moving.
6. That is why having and consulting an experienced agent is more important than ever. We have our finger on the pulse of the market and can guide you to the answer that is right for your situation and needs.
We hope you have found this report helpful. There has certainly been a lot to unpack over the last several years and 2022 was no different.
If you are ever curious to discuss the market conditions further, whether a general chat or related to a property, please do not hesitate to contact us anytime.
If you're looking for information on a specific city in Niagara, then please keep reading...

As mentioned, for a further look into each city in Niagara, we’ve assembled a graphic report for your municipality as well.
READ THE CITY-BY-CITY REPORT HERE