
Hello Niagara (& beyond)!
If you're looking to get a closer look at the data, then this bLOG is for you.
Below you'll find a city-by-city review for all of Niagara. Scroll down to find your city...
A FEW THINGS TO KNOW:
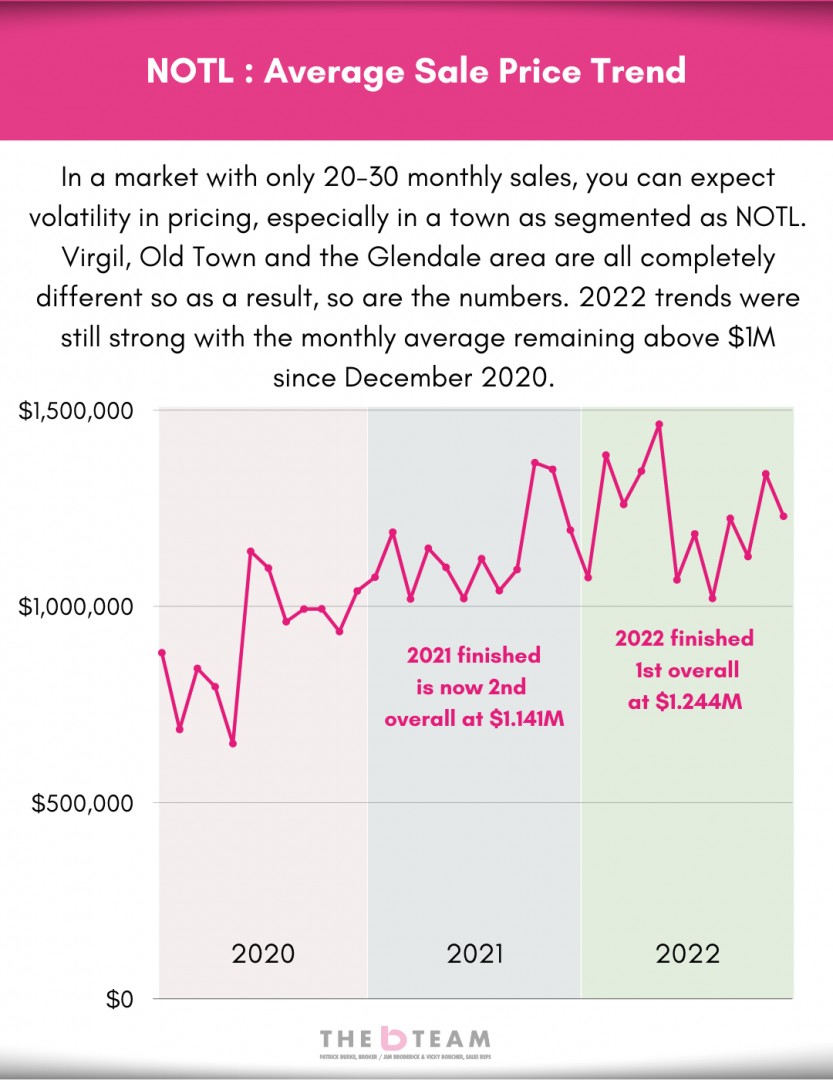
Volatility. The three largest markets in Niagara for the number of homes sold are St.Catharines, Niagara Falls & Welland (in that order). The remaining markets have lower monthly sales numbers which result in volatility. You'll notice in Niagara-on-the-Lake, for example, that the Average Sale Price Trend graph resembles an EKG read-out rather than a real estate report. Viewing the trends rather than the simple month-to-month numbers is going to be helpful.
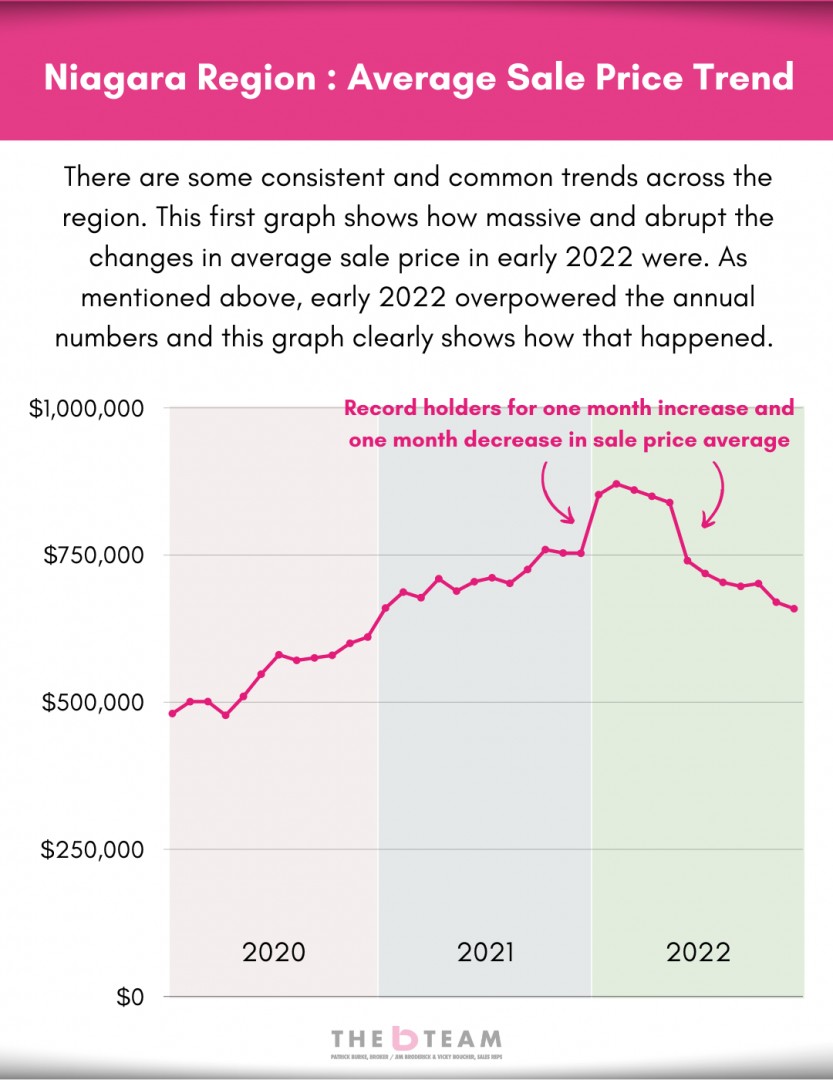
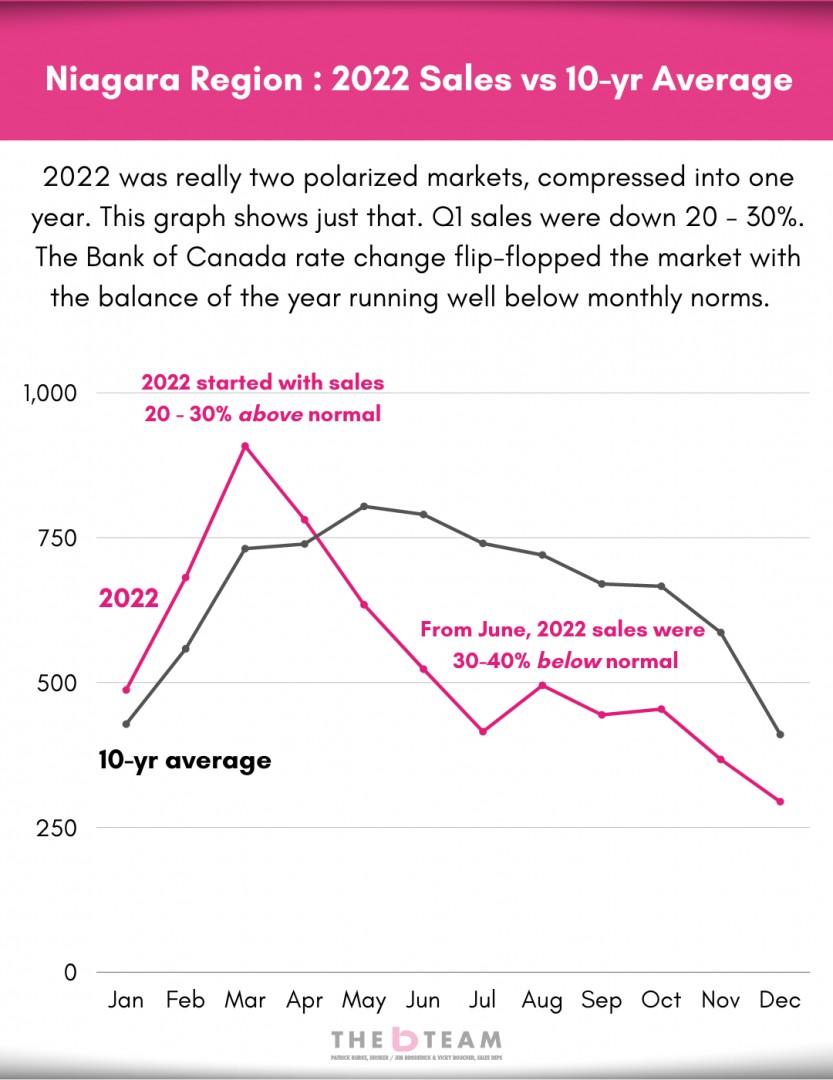
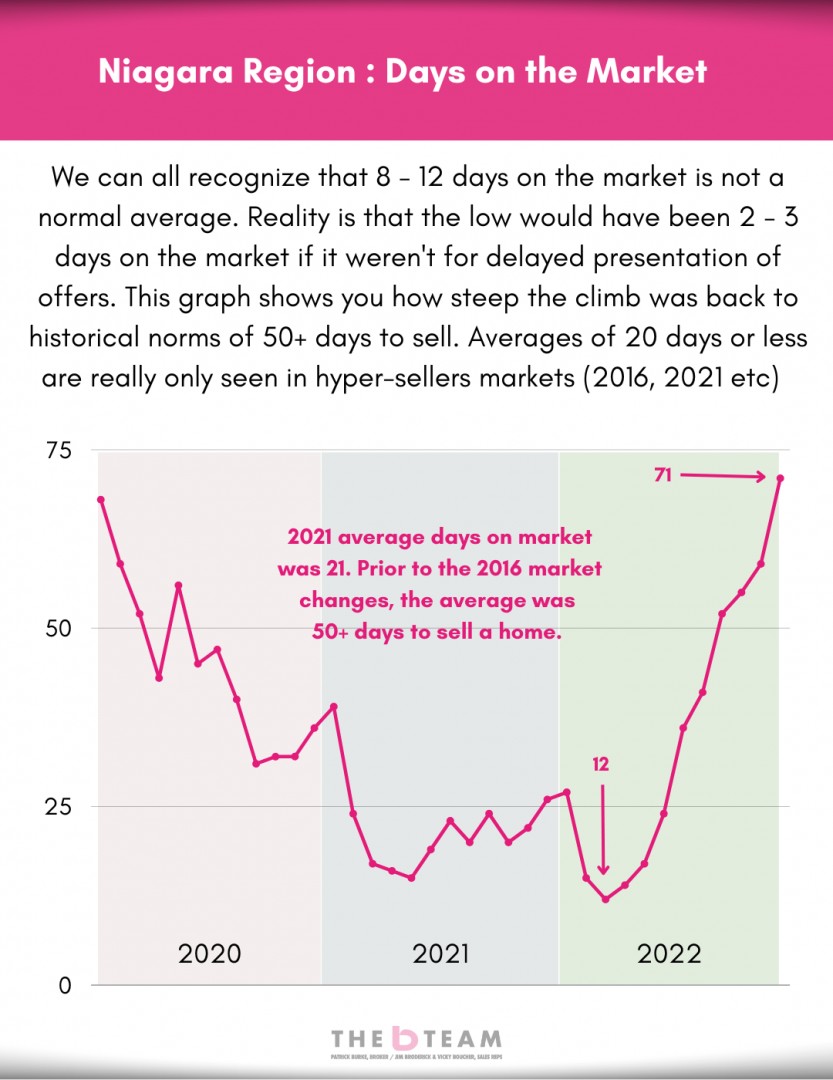
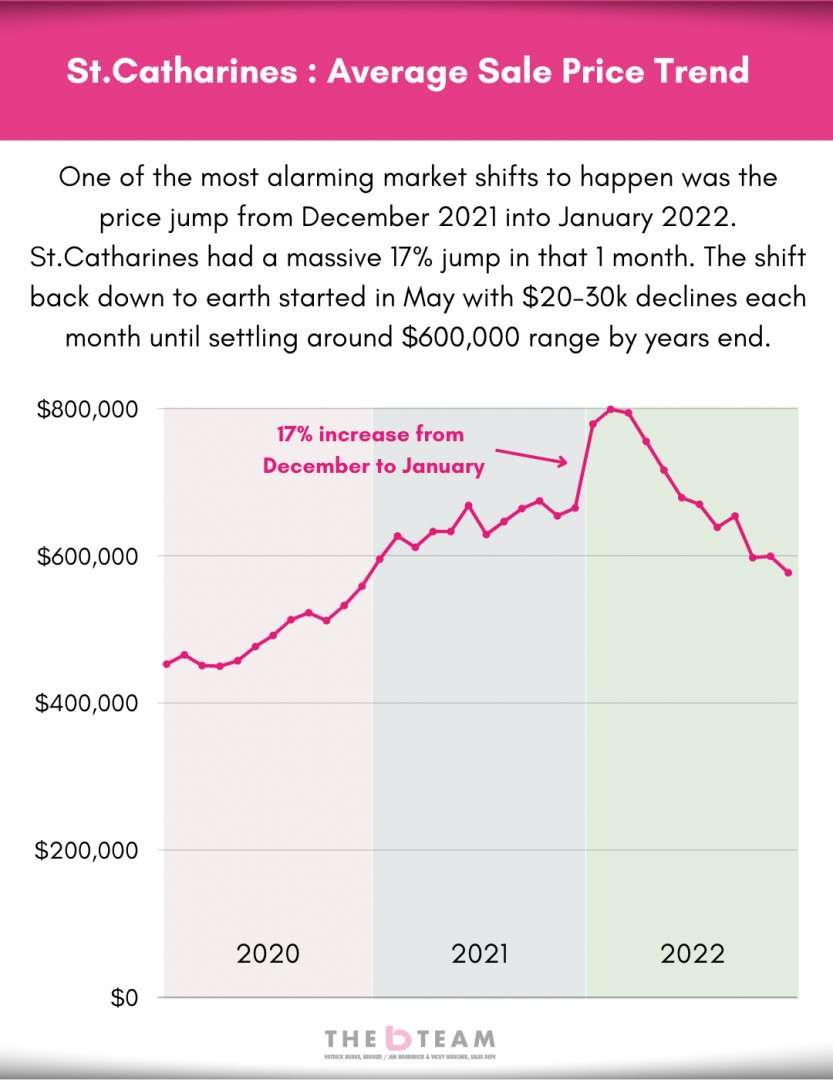
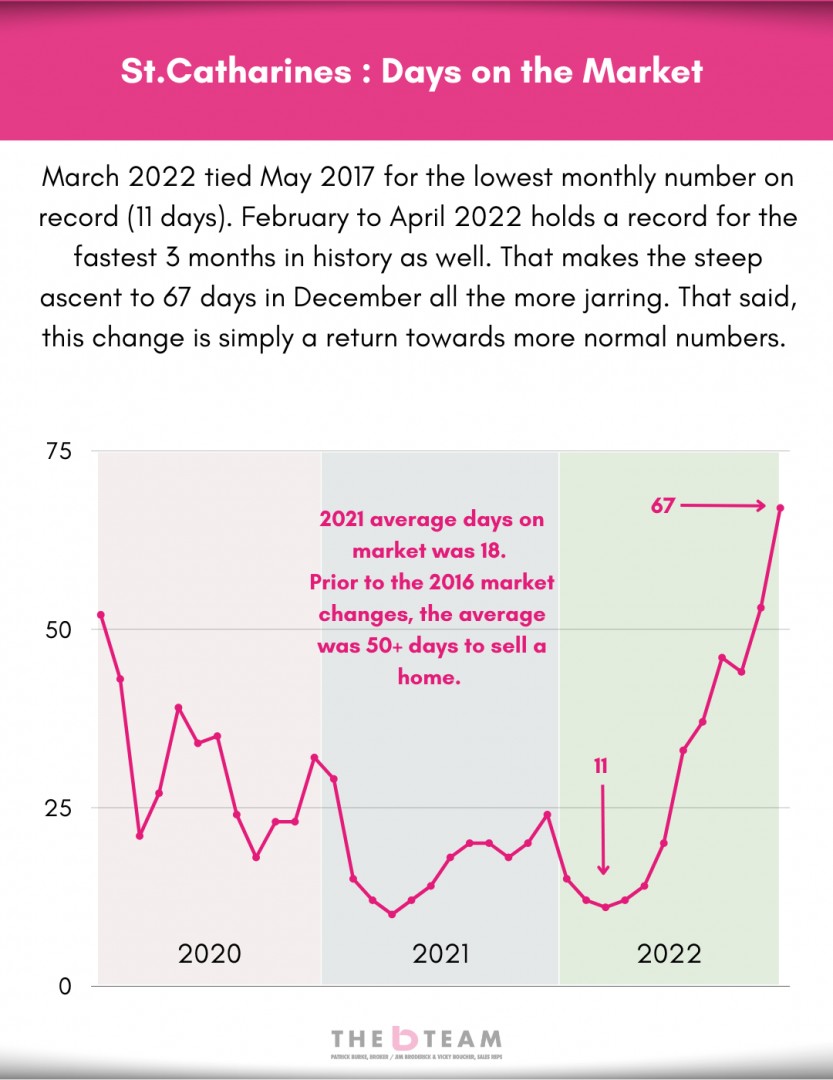
Beware The Average. The beginning of 2022 had a massive impact on the overall data which is why we've included monthly reports. For example, the average sale price in St.Catharines for 2022 was $707,000. Meanwhile, Q3 averaged in the mid $600s while Q4 finished up in the $590 - 600k range, roughly $150 - 180,000 below the first four months of the year. Beware annual averages for nearly anything these days.
There's More To The Story. These reports are a guide rather than a fair representation to a specific home or property. If you're in need of a closer look at a specific neighbourhood or home, please don't hesitate to reach out. We're happy to chat.


This first batch of charts is for all of Niagara in one basket. As a result, use these as a rough guide for how the regional market is doing. Keep scrolling for individual cities.
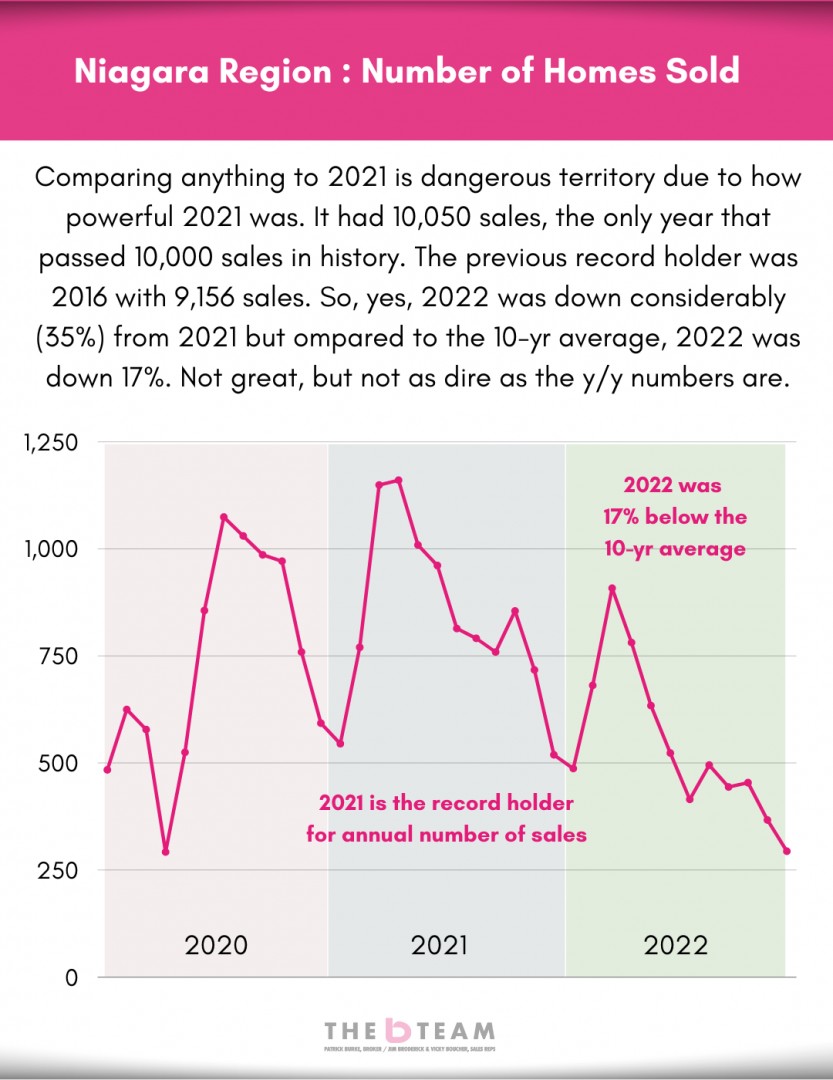


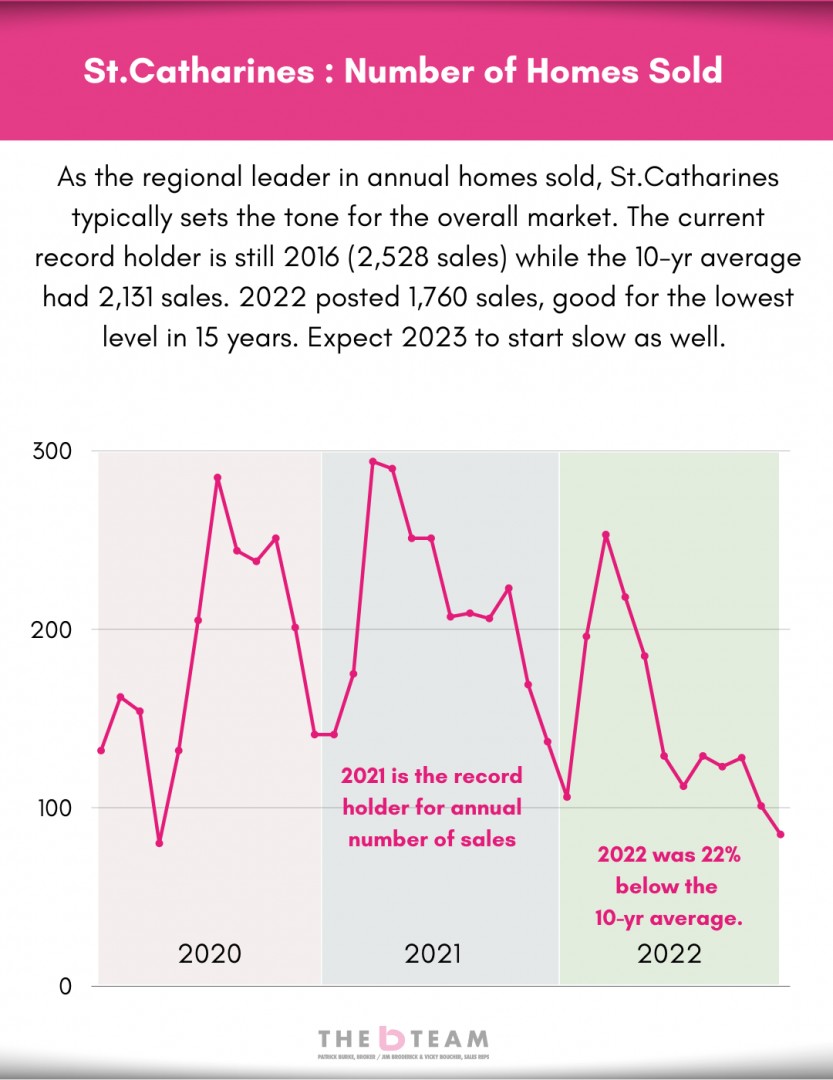
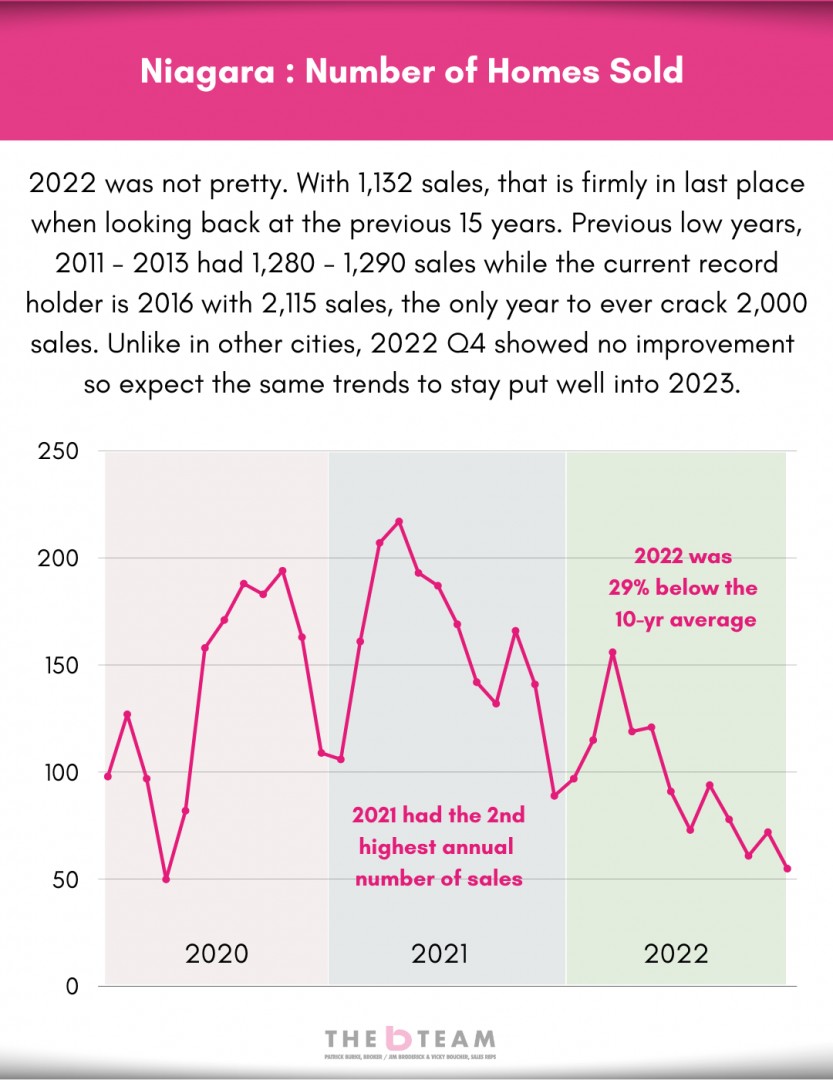
On an annual basis, St.Catharines leads the way in the number of homes sold with Niagara Falls and Welland rounding out the top 3.


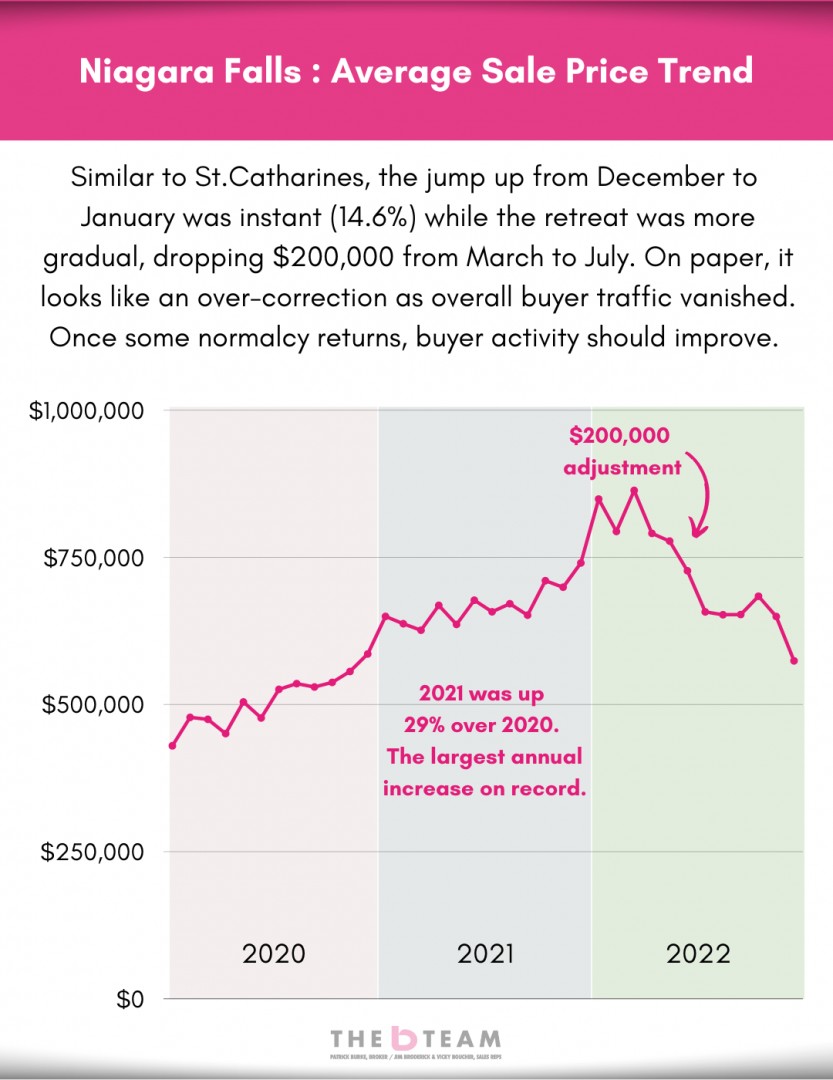
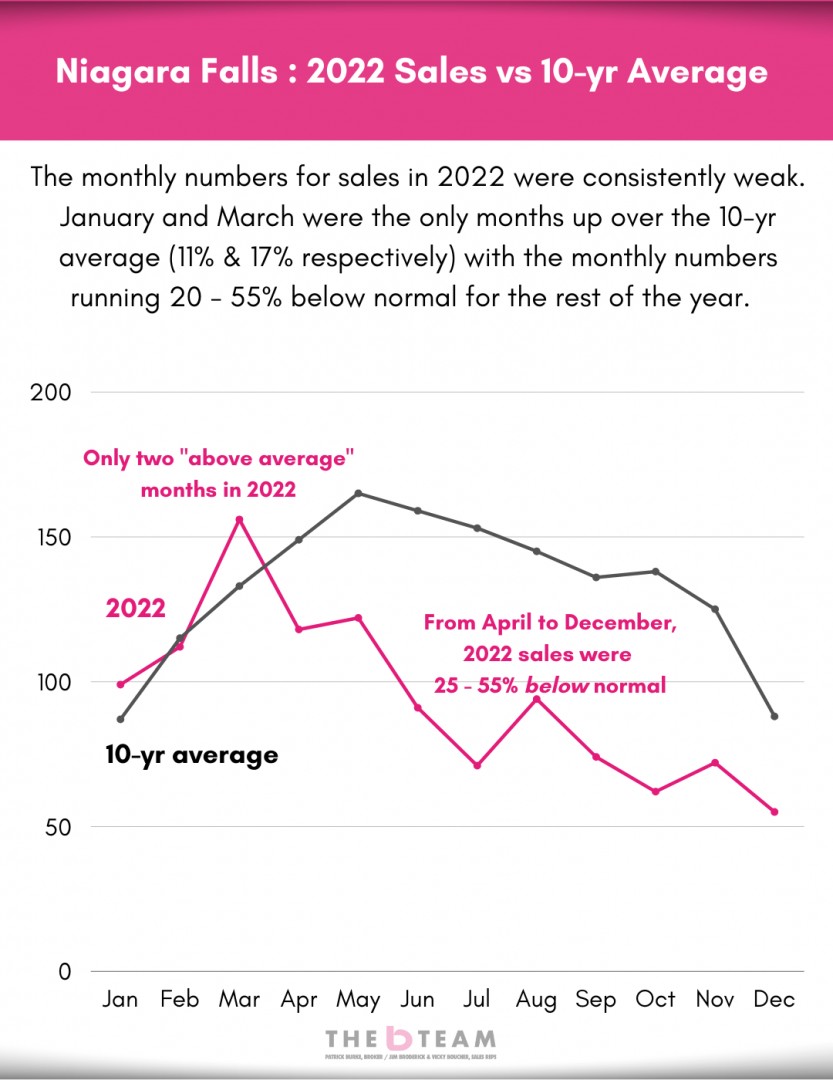
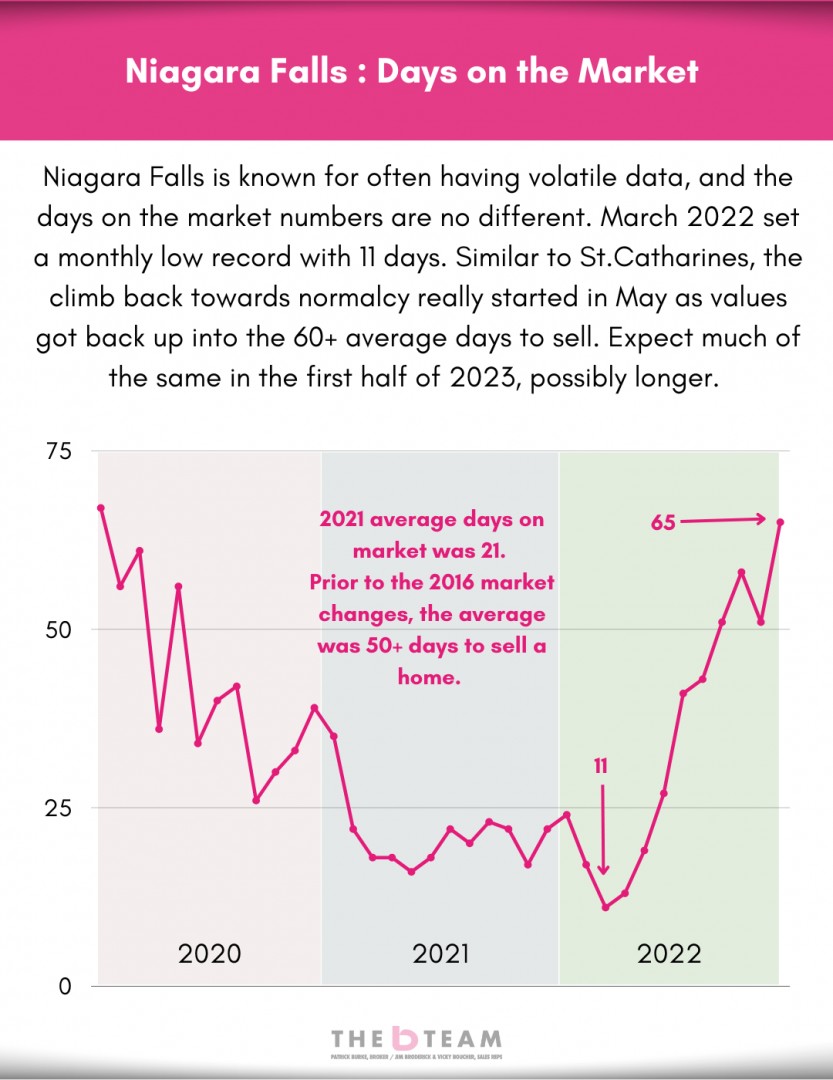
Similar to Niagara-on-the-Lake, a good portion of the Niagara Falls market is driven by outside investment. With that comes more volatility which is why charts for Niagara Falls often resemble an EKG print-out.


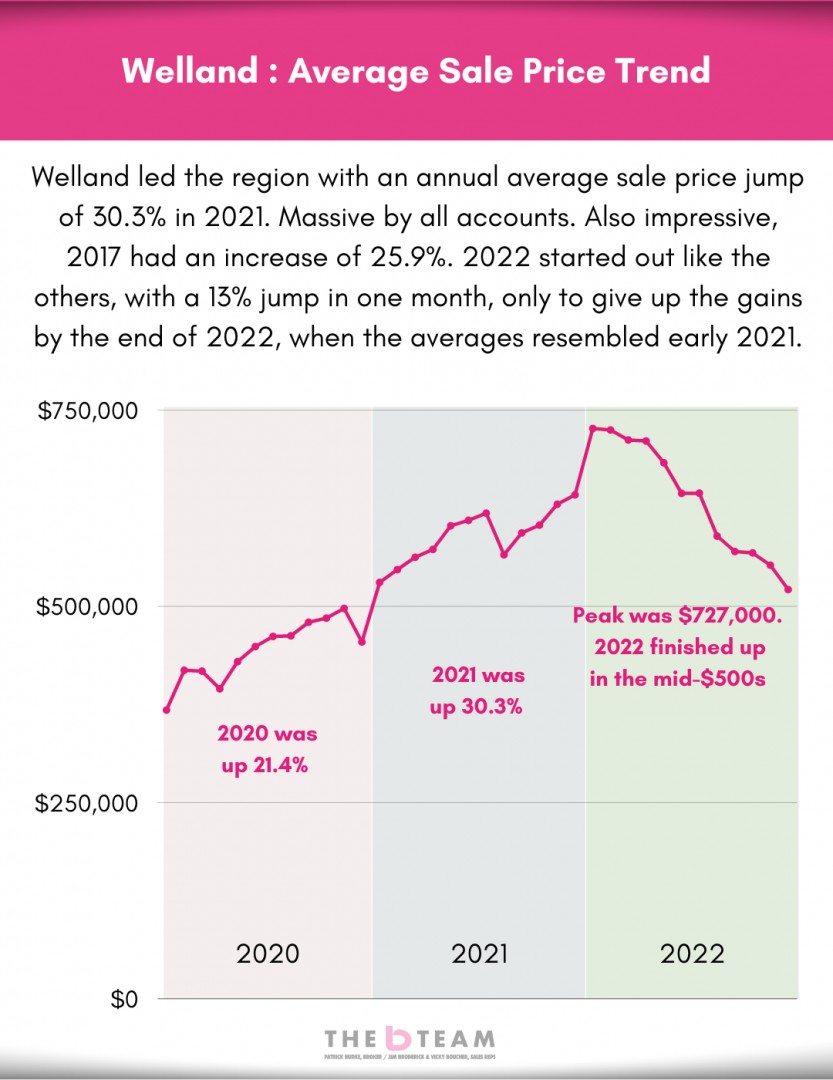
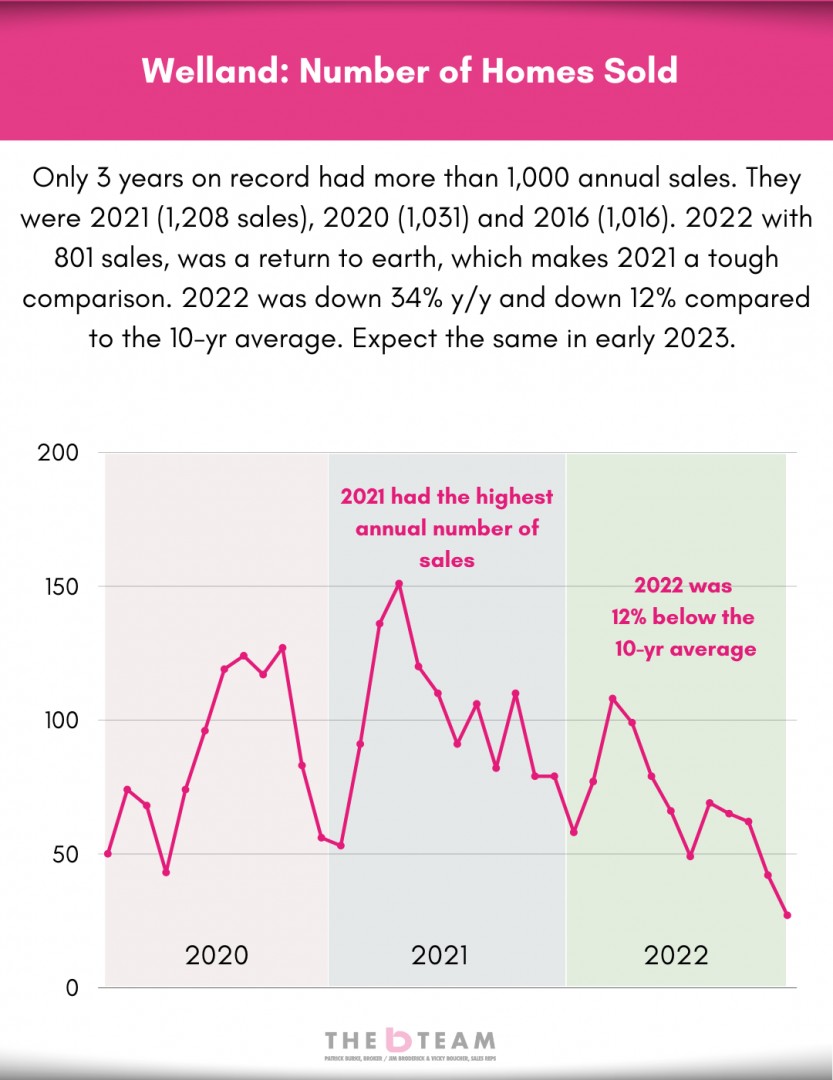
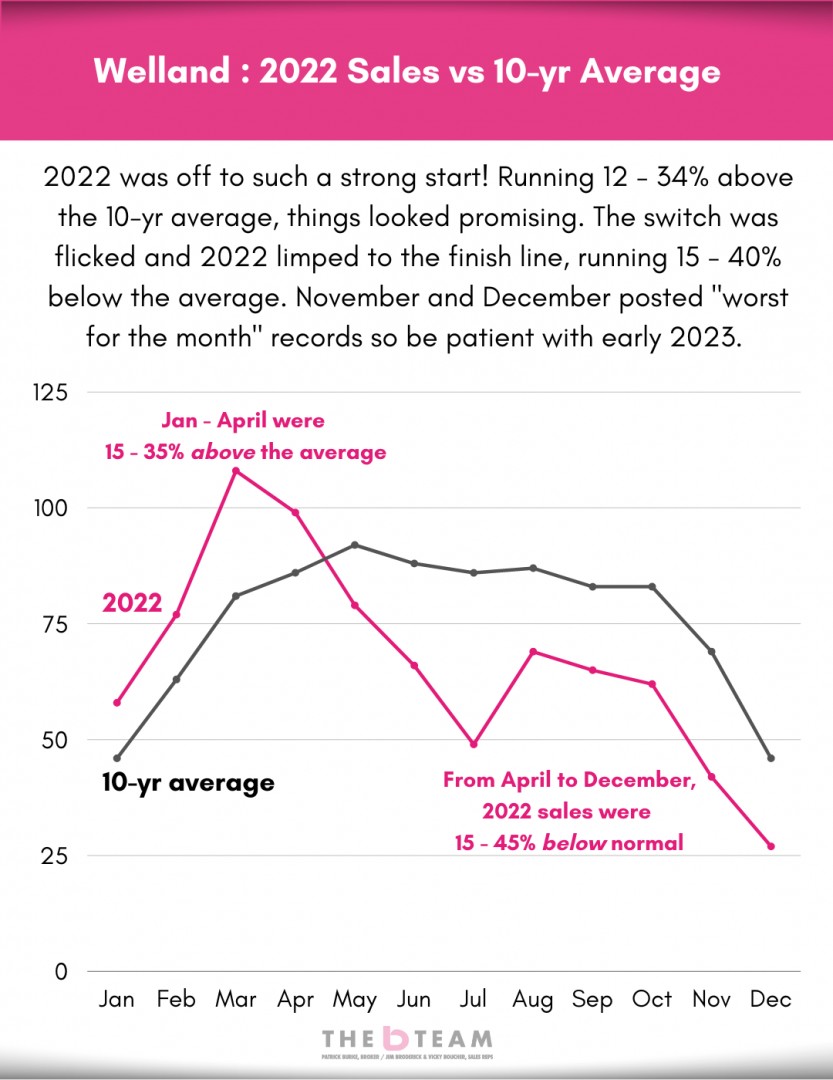
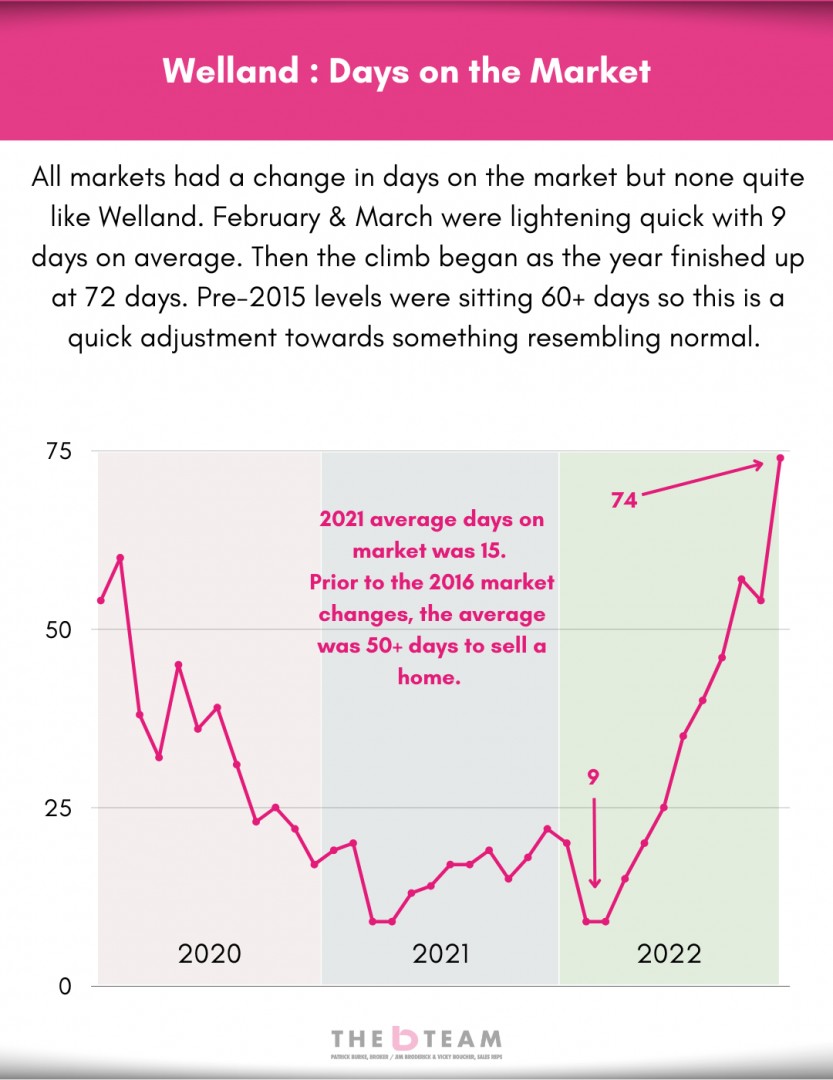
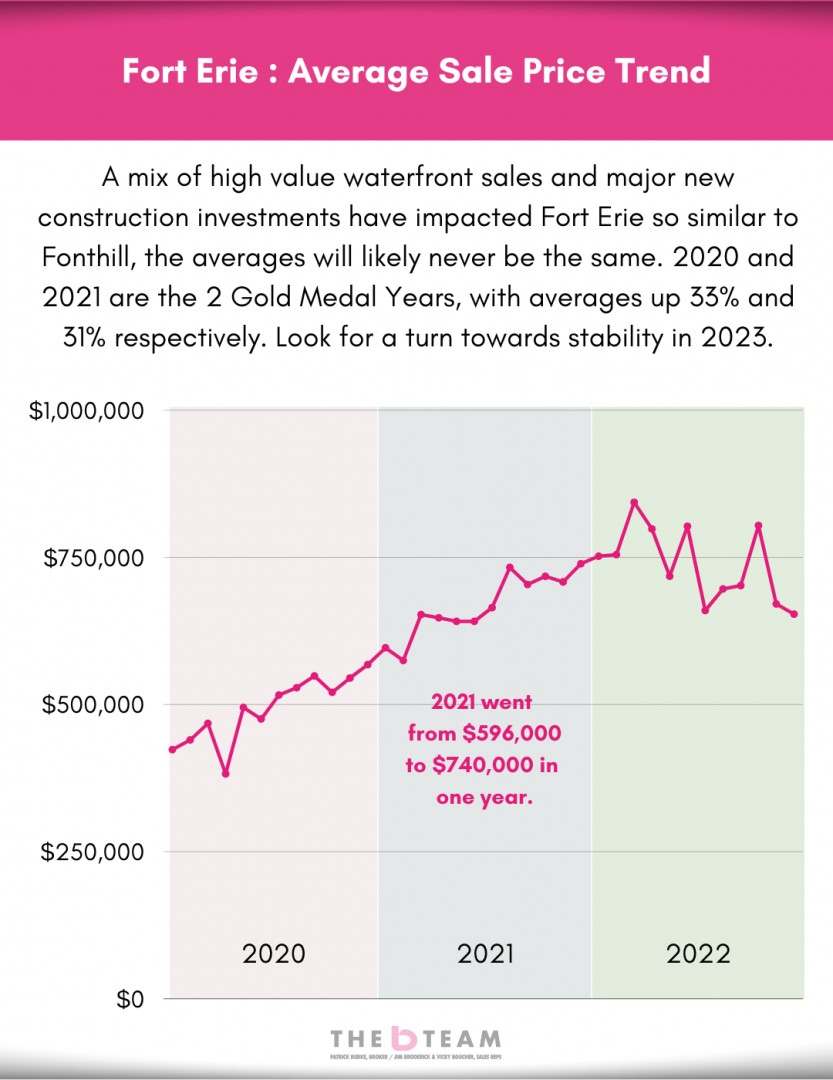
Similar to Thorold and Fort Erie, Welland has had strong growth in new construction which has started to pull the overall data in various directions. Keep that in mind with Welland charts.


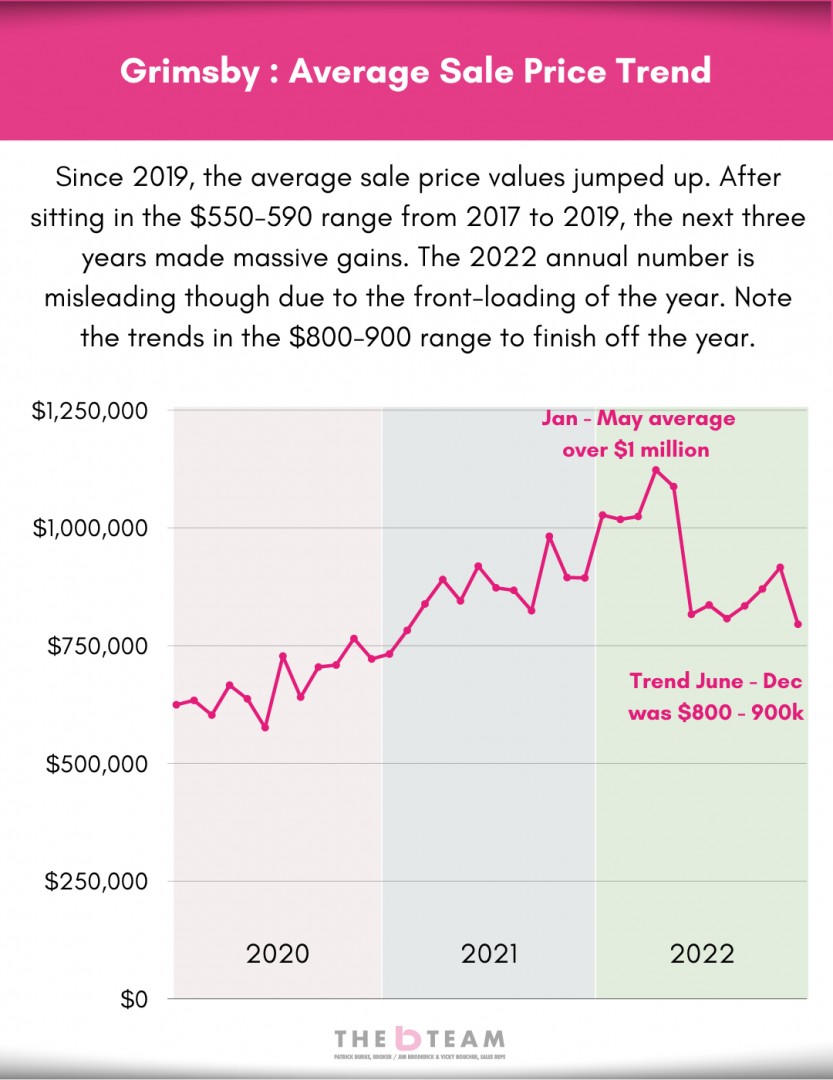
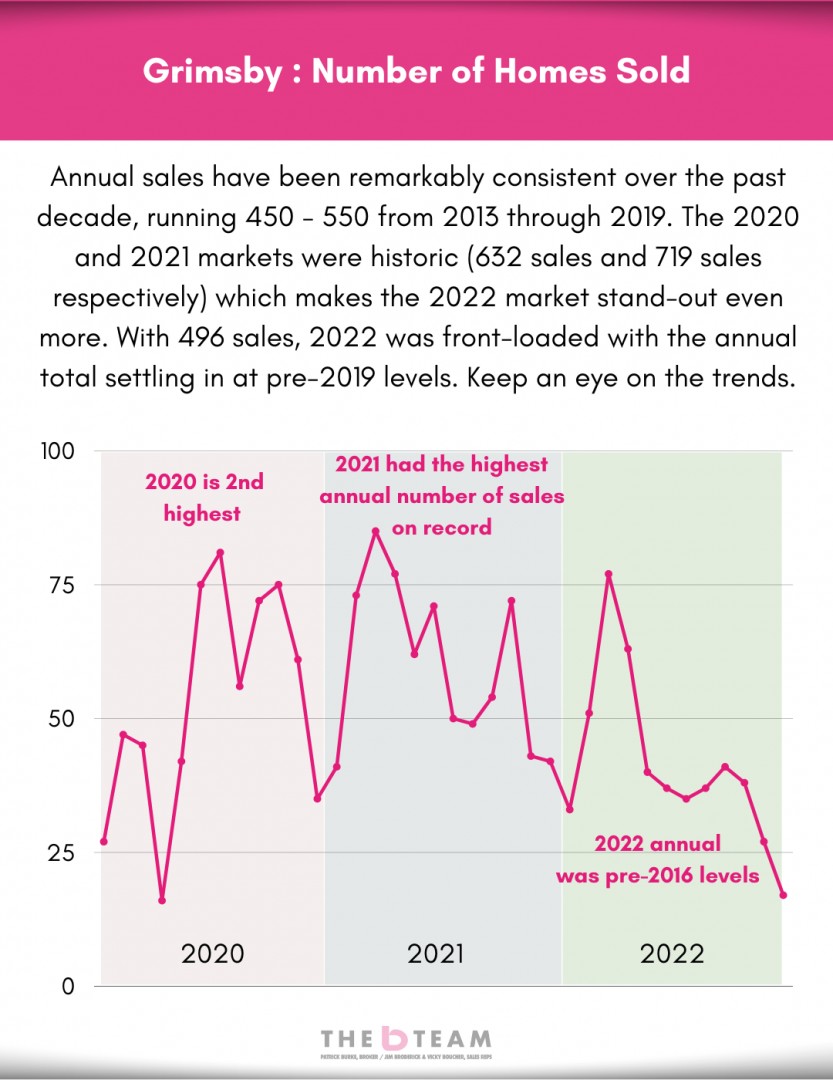
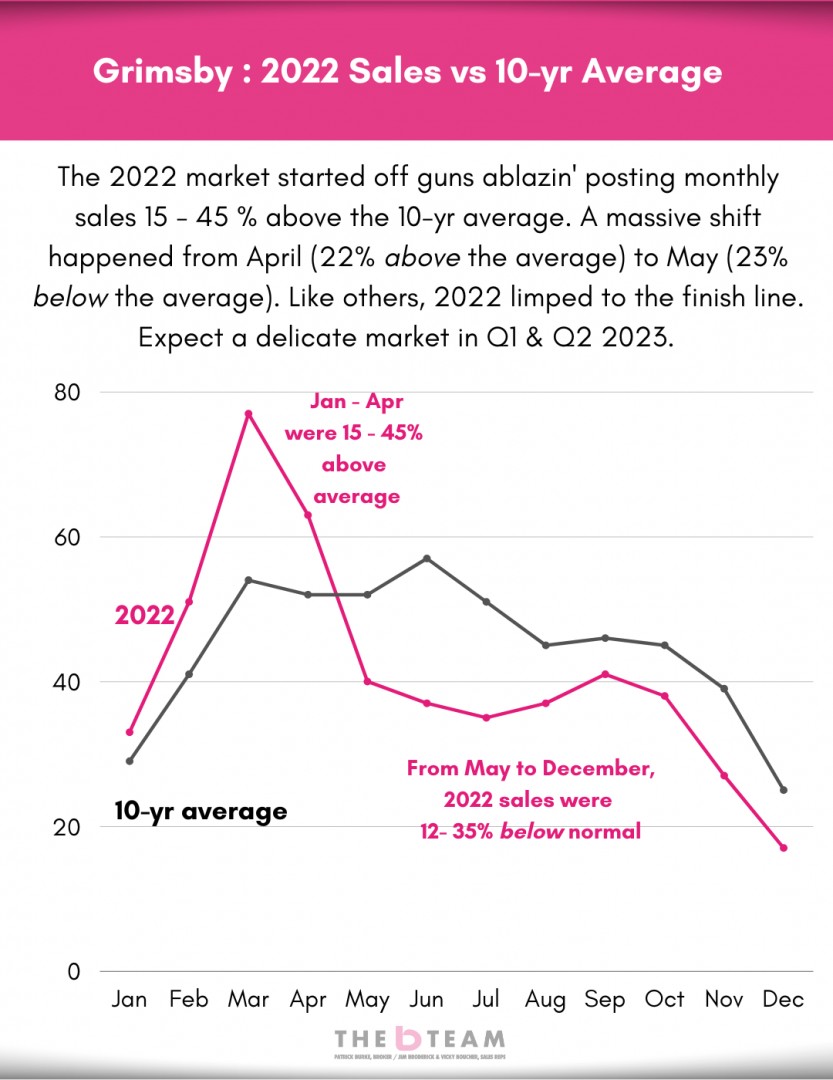
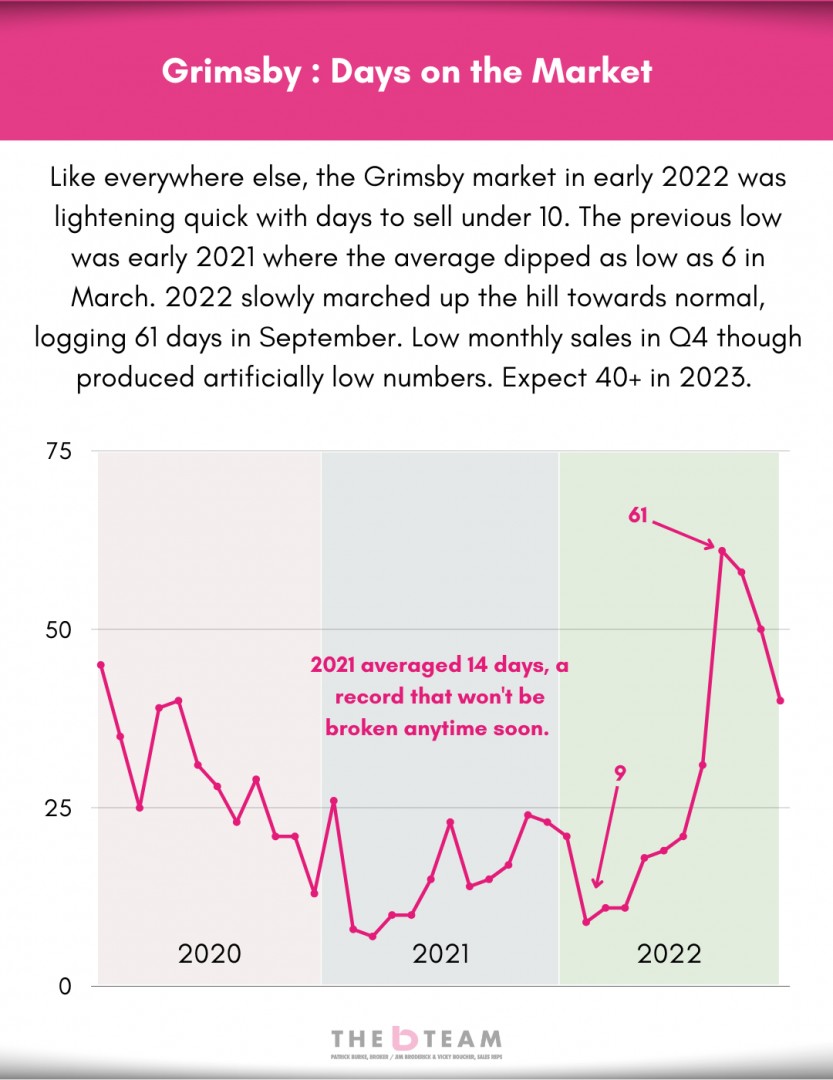
The closest city to the GTA, Grimsby has seen intense growth in all facets of the real estate market. Case in point, 2021 sale prices were up nearly 50% from 5 years earlier.


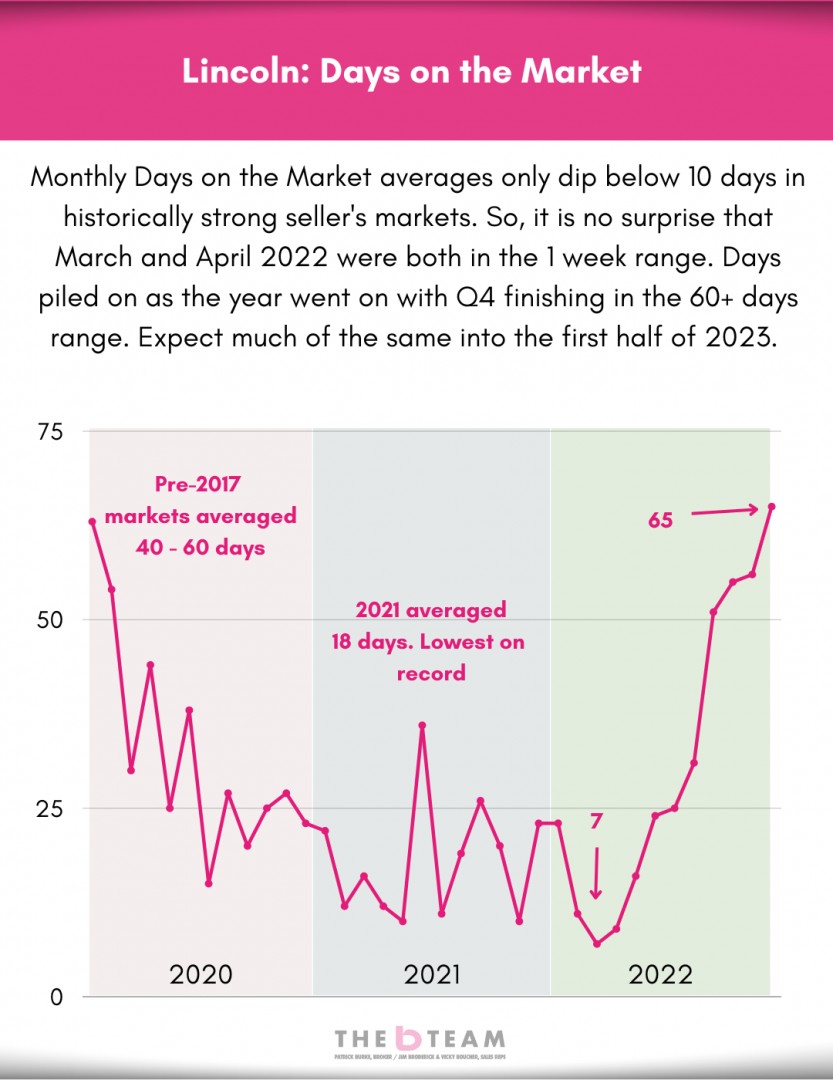
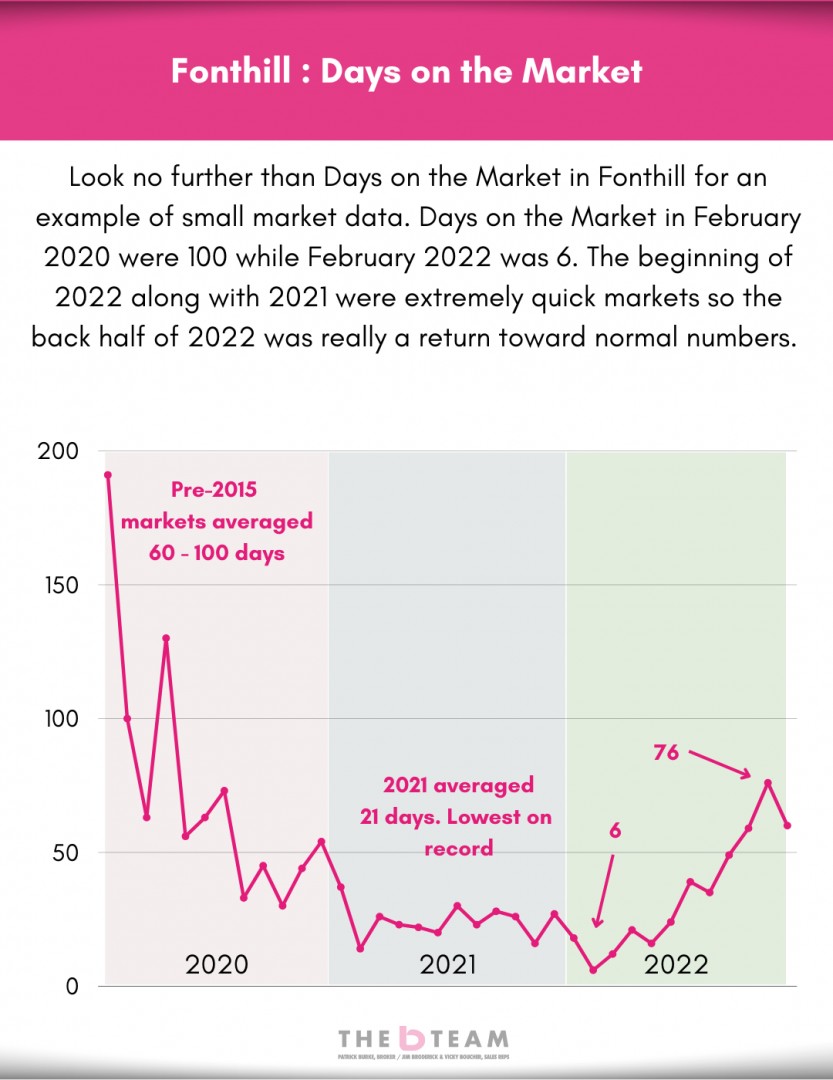
One of the towns in Niagara with low monthly sales numbers (20 - 40), zooming out is helpful in getting an idea of current real estate events.


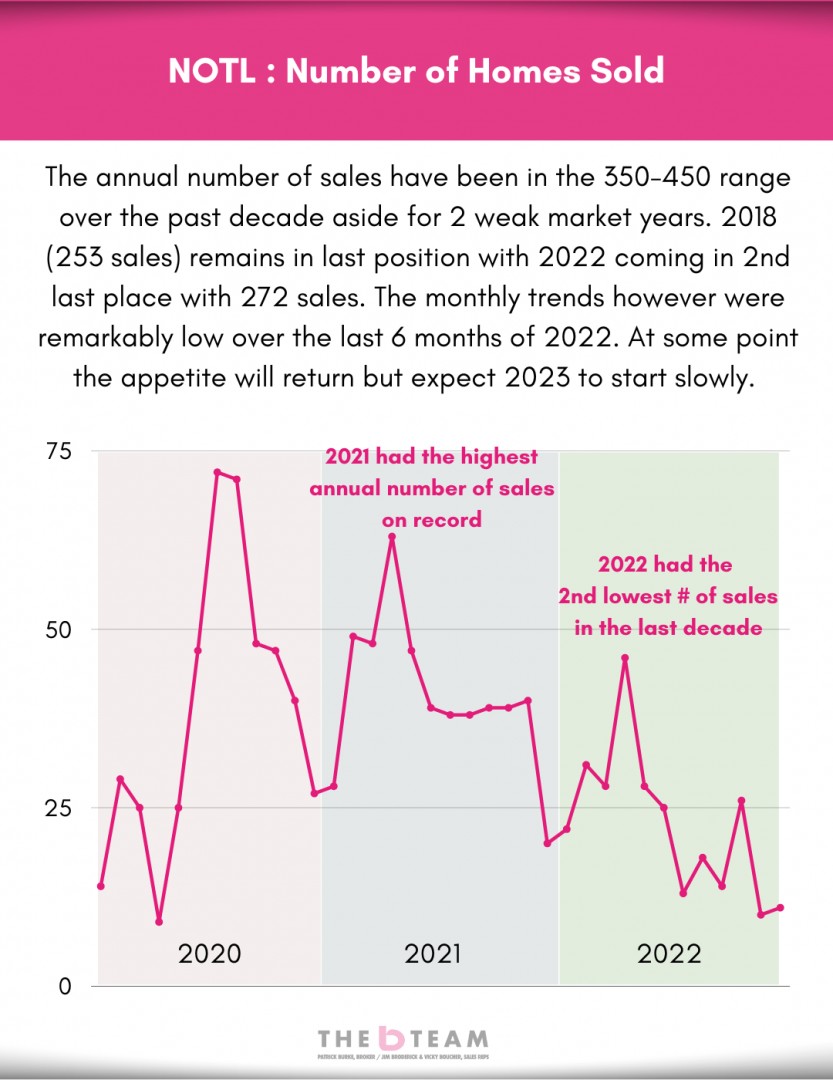
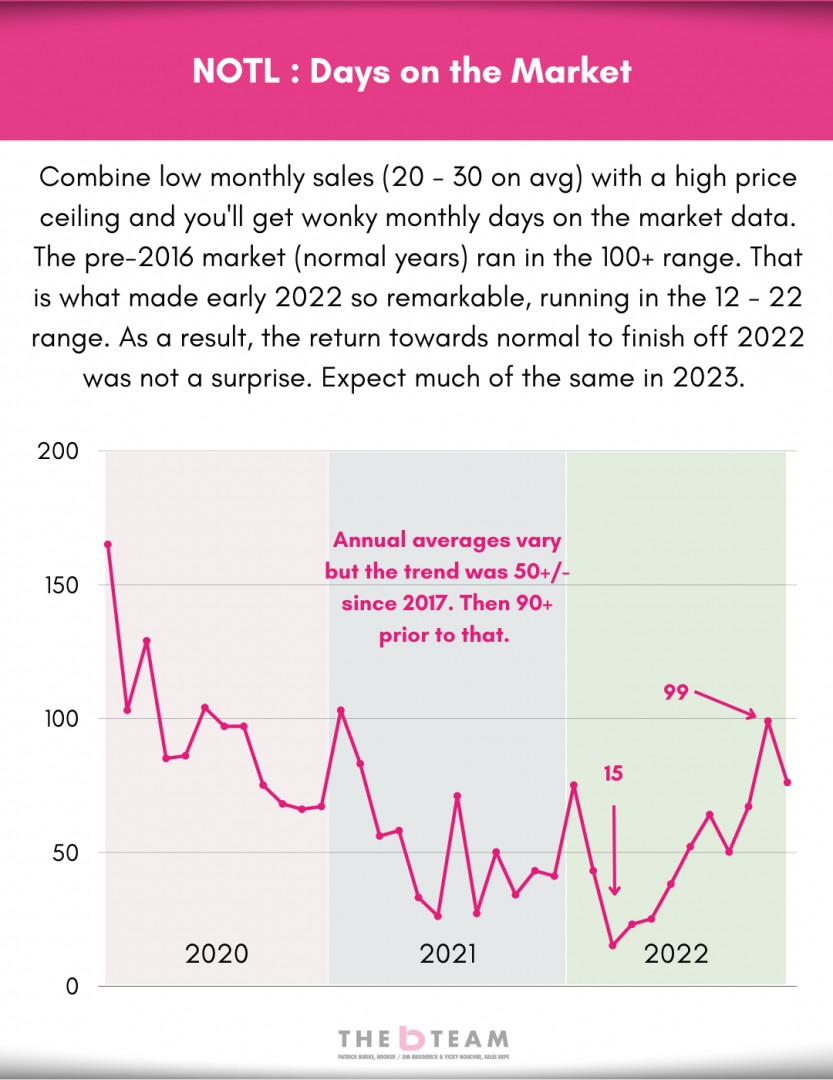
Similar to Lincoln, a normal market in Niagara-on-the-Lake would see 20 - 30 monthly sales. 2021 with 40 - 70 sales was a behemoth. 2022 was a contrast of very strong and weak.


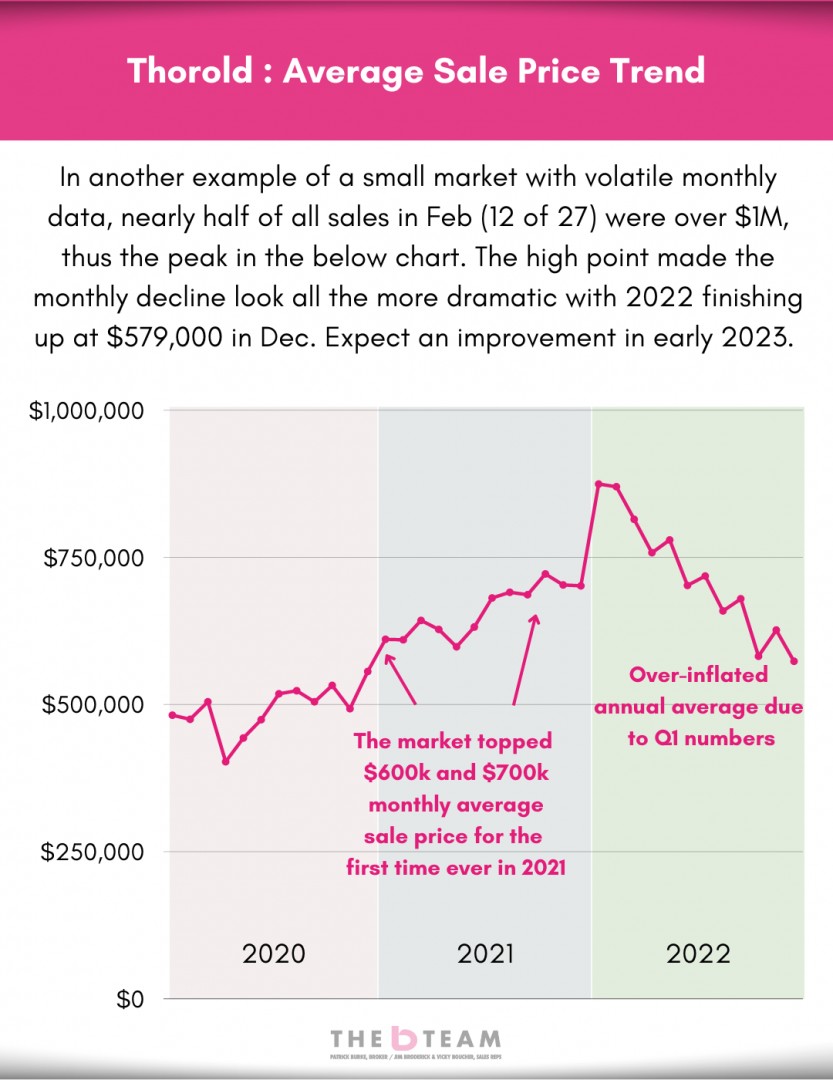
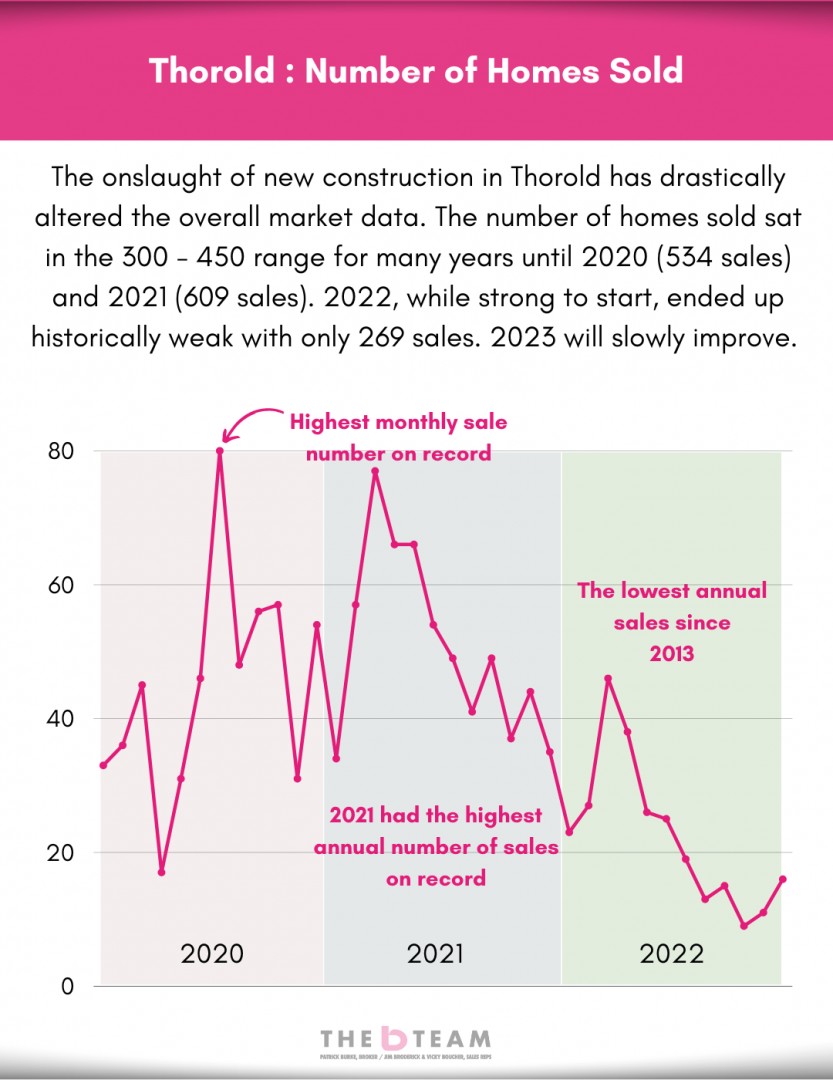
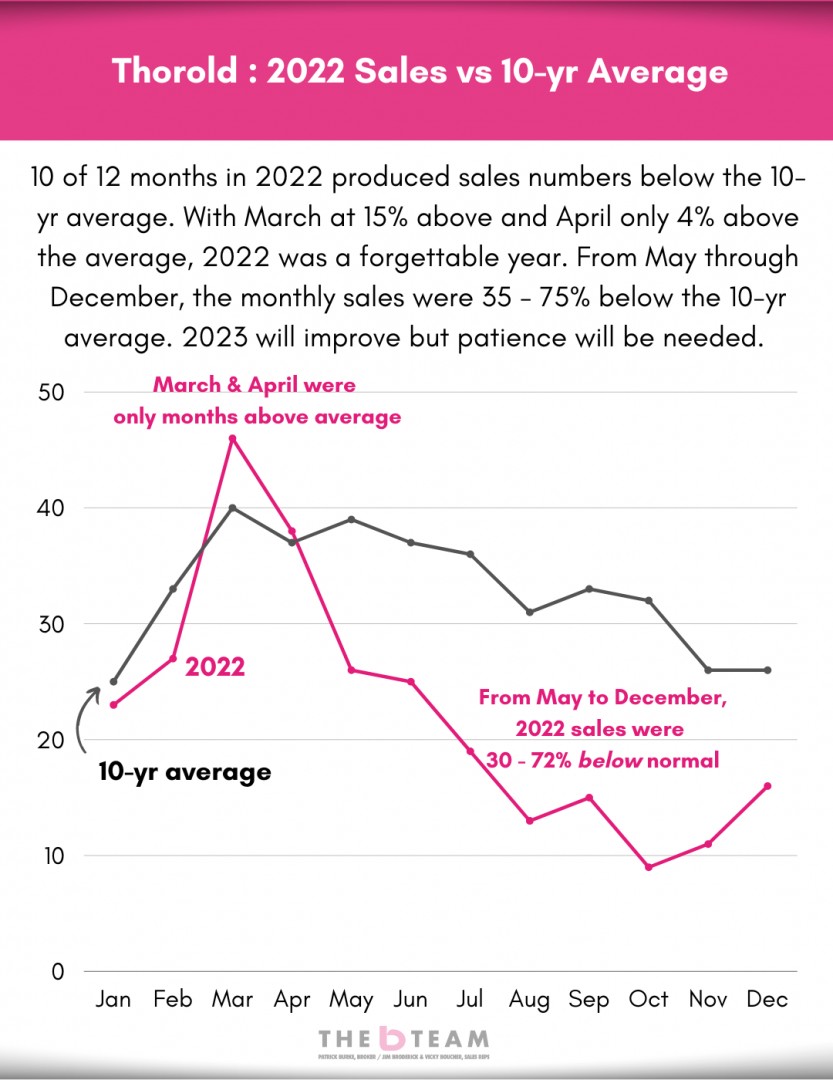
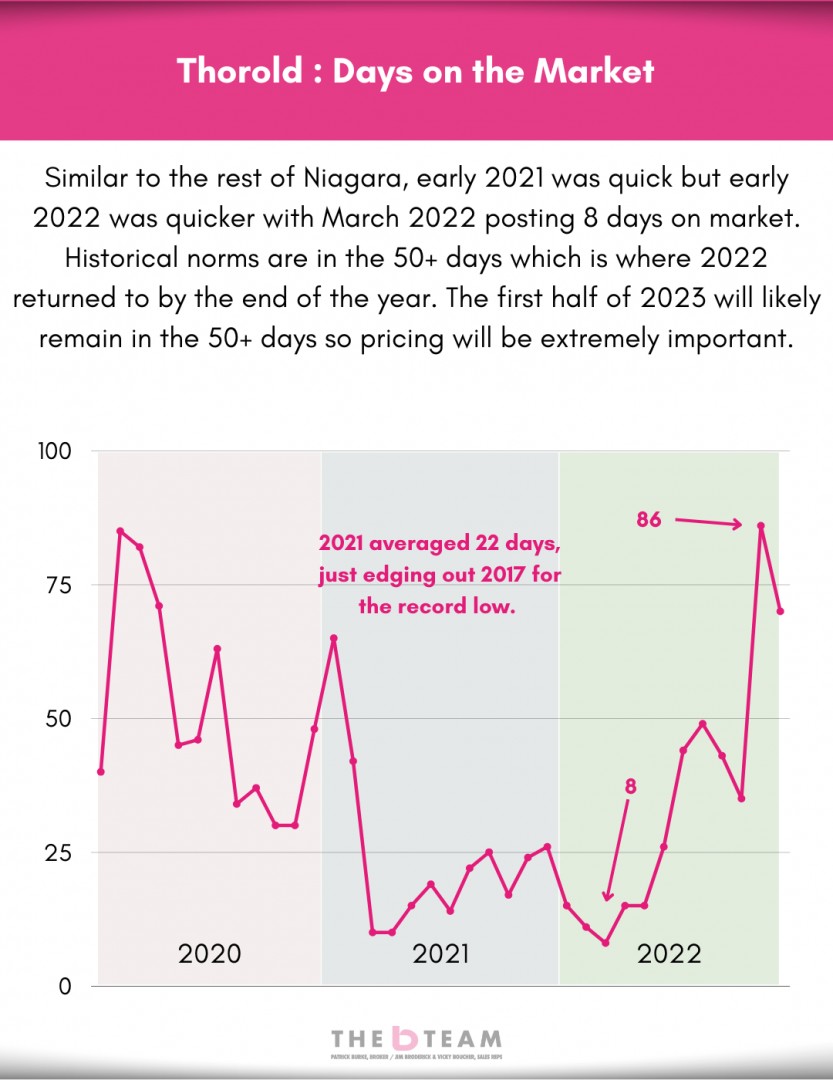
Thorold has had a wild ride over the last 5 years, mainly due to the onslaught of new construction. As a result, some of the data appears worse than it is. A closer look is required.


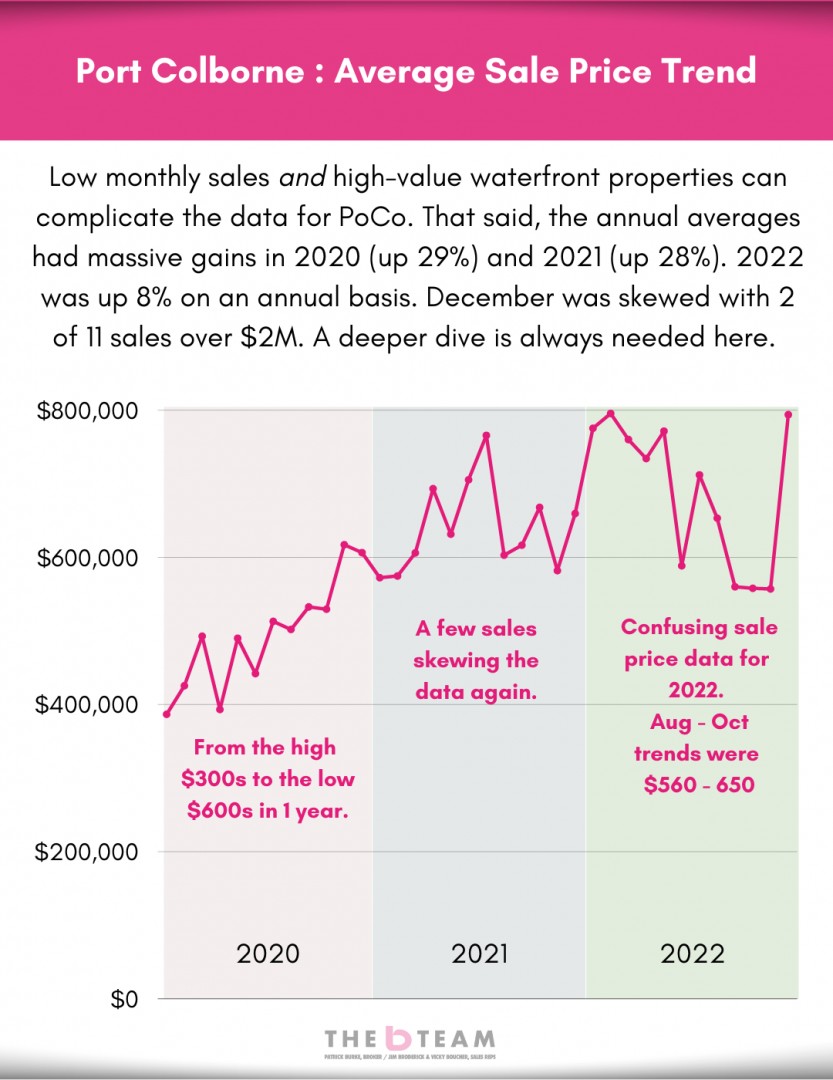
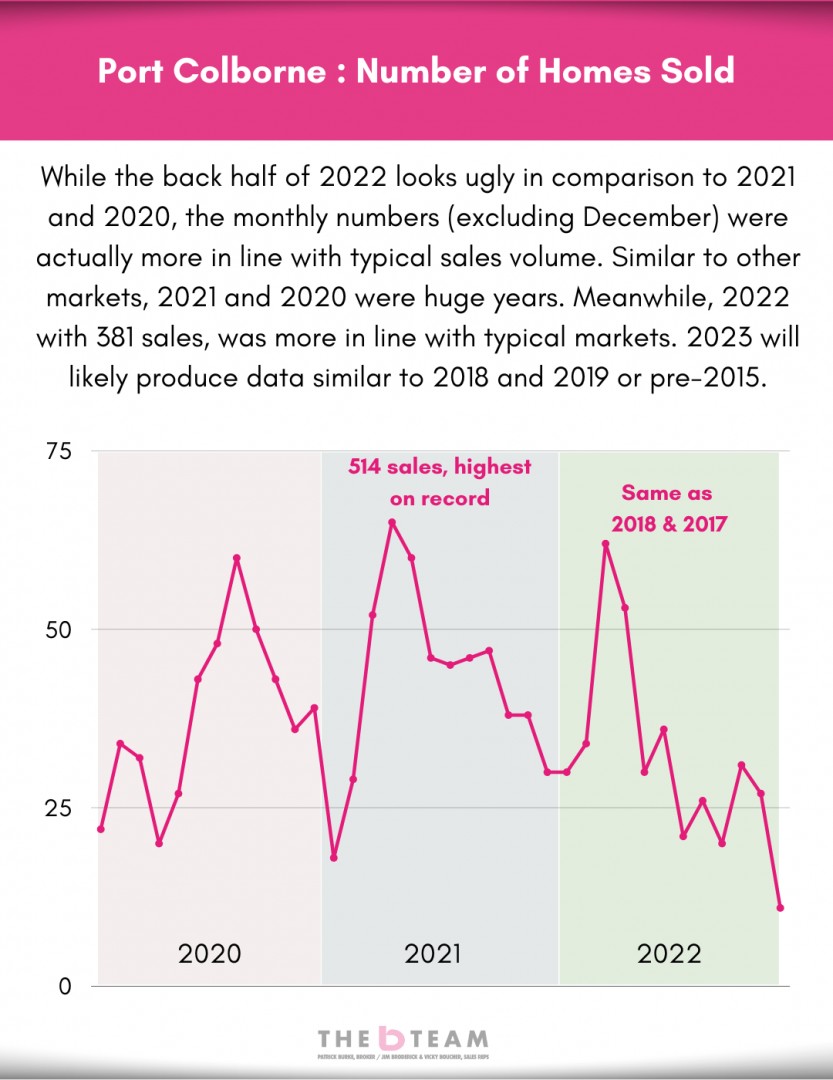
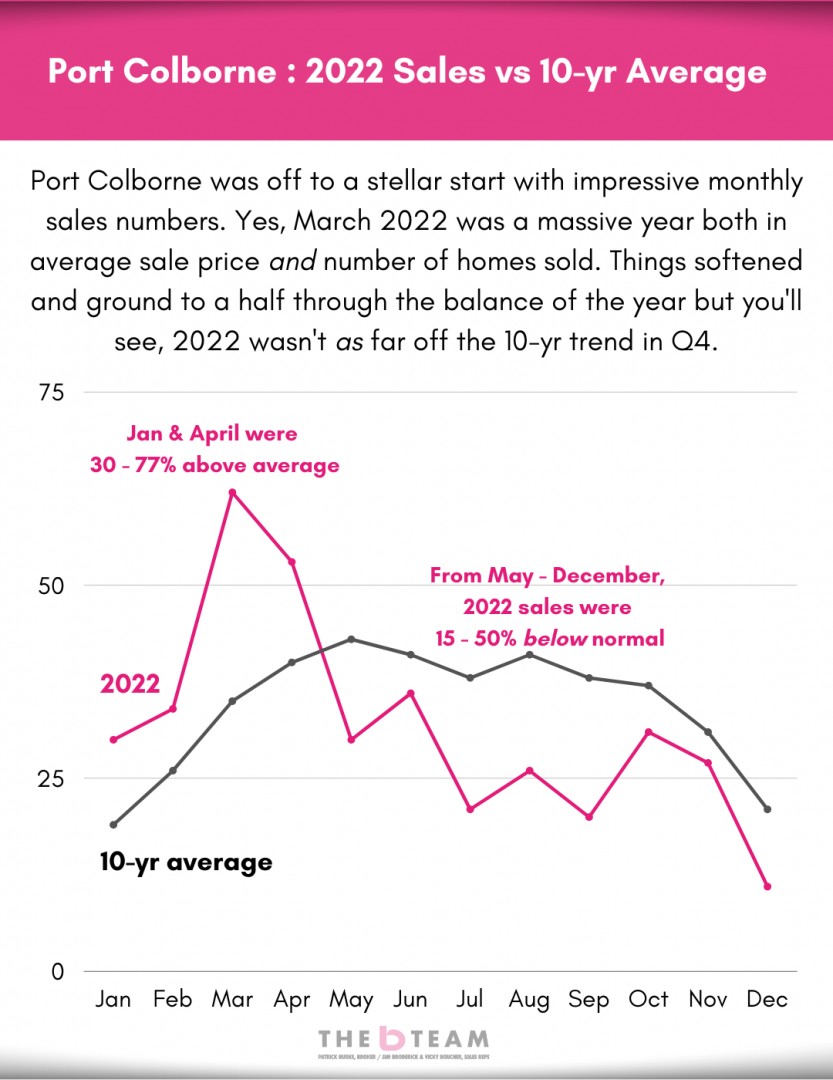
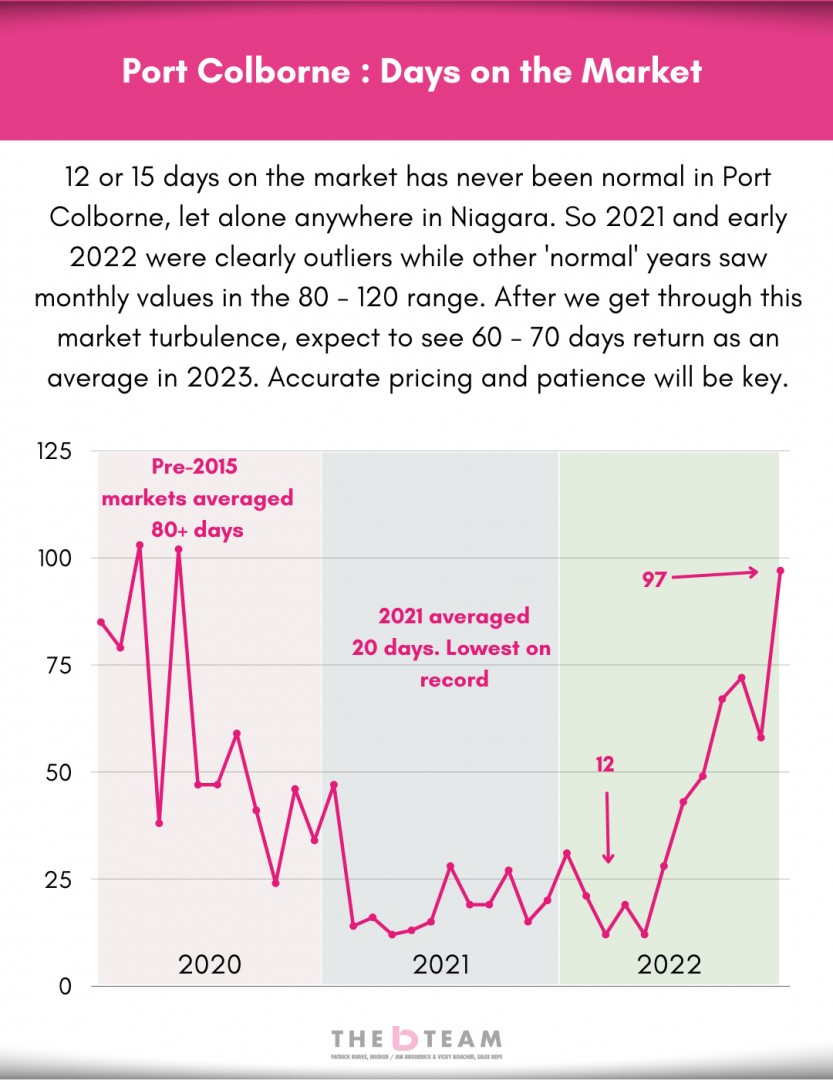
Port Colborne data can be tricky to make sense of given the low monthly sales numbers and the potential for high value lakefront properties pulling the data up. Keep reading and learn more...


WHAT TO DO NOW?
Well, that depends. Your strategy and approach will vary depending on whether you're looking to buy, sell or both.
Here are a few other resources for you. You can safely click on any of them :)
A bLOG that answers the "Should We Sell Or Buy First"
Our Complete "World's Greatest Niagara Real Estate Annual Report : 2022 - 2023 Edition"
If you'd like to email, text or book a call with us, click here