

INTEREST RATES & YOUR HOME...
There are a few things we can probably agree on at this point.
- Looking at the supply of new listings & the demand to buy those homes is a quick and easy way to assess the (Niagara) real estate market.
- The Bank of Canada approach to interest rates has a direct and reasonably quick impact on the market.
With that said, here is a quick look at the current conditions as we head into the back half of summer 2023.
THE MARKET BASICS
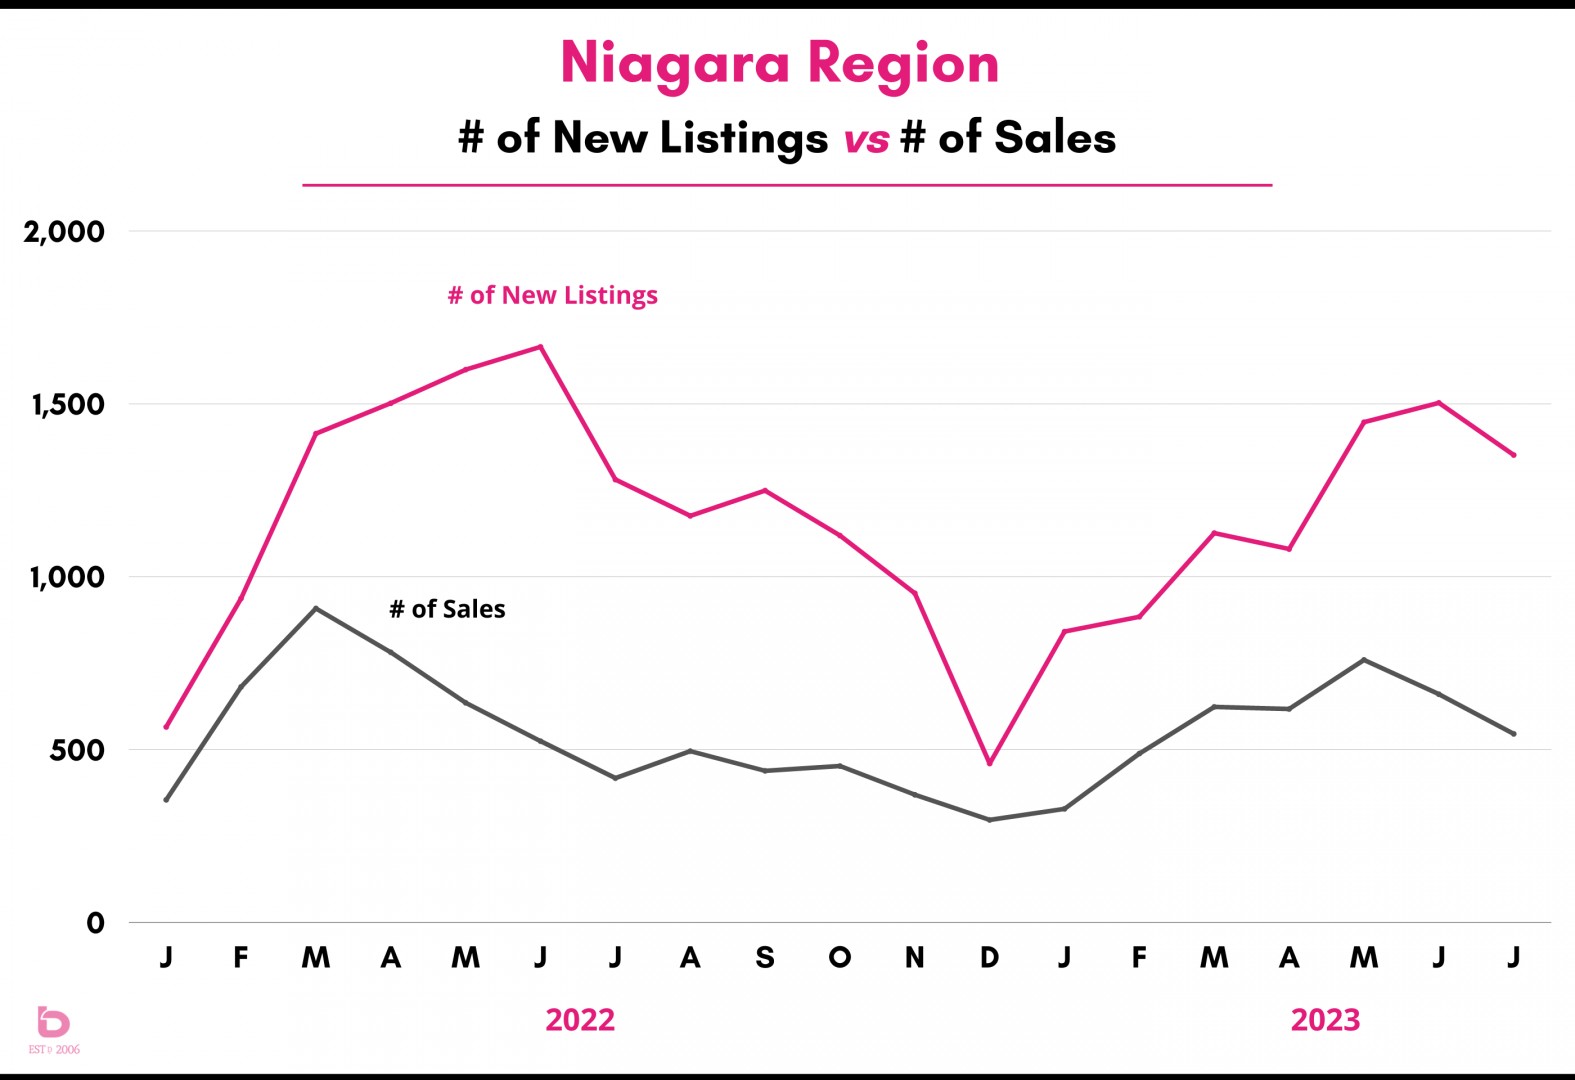
Let’s get right into the big picture graph for the last 18 months. This graph shows you the supply & demand conditions for all of Niagara, going back to January 2022.
You will see in early 2022 (Jan – Mar) how tight the conditions were between the supply of listings and how many homes sold. If you’ve blocked that period out of your memory, here is the final tally for Q1 2022:
Number of Homes Sold: 2,104
Average Asking Price: $788,000
Average Selling Price: $861,000 (109.2% of asking)
Average Days on Market: 17
Notice the changes in dymanics through 2022 into the halfway point of 2023 as supply (in pink) piled on while demand (in black) stuggled to find its feet.
So, going back to Q1 2022, you may be wondering how Q1 2023 did in comparison. Here are the Q1 2023 numbers:
Number of Homes Sold: 1,438
Average Asking Price: $702,000
Average Selling Price: $677,000 (96.4% of asking)
Average Days on Market: 70
...or in other words:
Sales down by 32%.
Average selling price down by 21%.
Days on Market up by nearly 2 months.
Those are some changes!
THE RATES THEY ARE A RISIN’
And this is where interest rates really show their impact. Here is the same graph, but we’ve added in the Bank of Canada interest rate increases (green arrows at the bottom) that started in March 2022 with the most recent increase in July 2023.
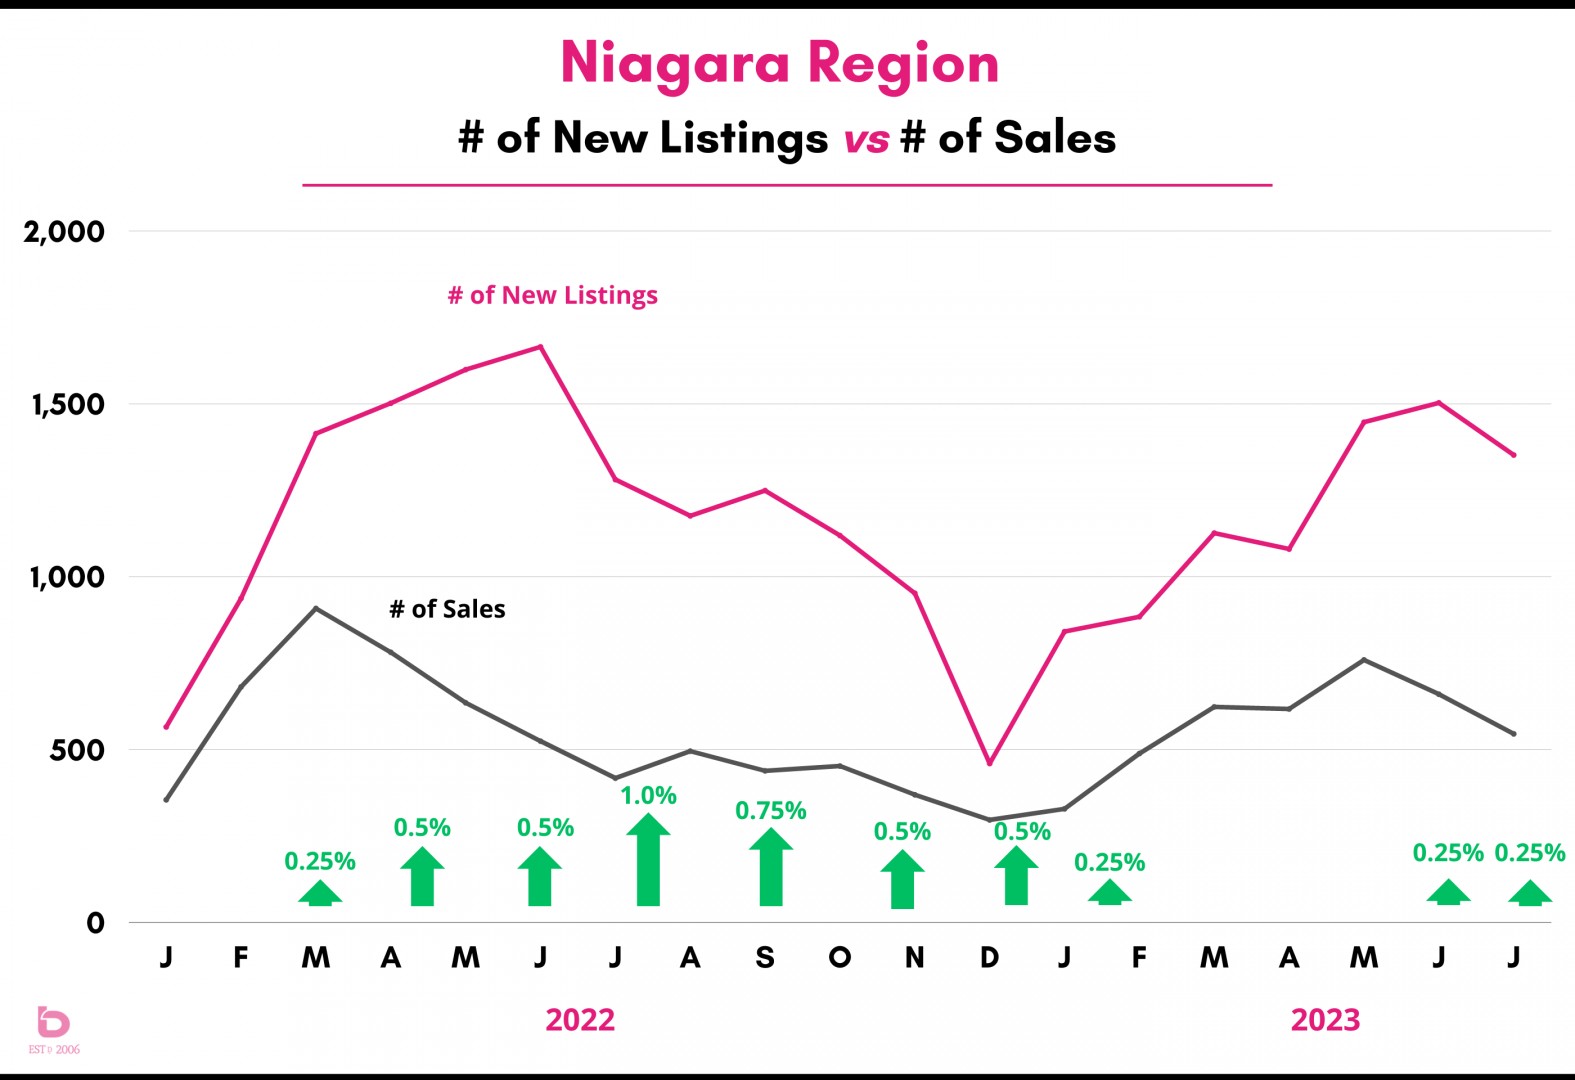
The most striking change was in the absolute withdrawal of home sales. That steady barrage of rate hikes in summer 2022 really chased a lot of people out of the market.
Uncertainty, lack of accurate information, fear and affordability all dropped a heavy blanket over the market conditions.
In a word, 2022 was unpredictable. When unpredictability rules the day, people are more likely to hesitate. Think about riding a roller coaster, and then riding that same roller coaster in the dark. That was 2022 for a lot of people.
Now look at early 2023. First, it should be noted that an uptick in sales and overall activity in the early part of a year happens in virtually any year (aside from COVID riddled 2020). That said, there was a newfound feeling of optimism and “we can do this!” as the rate increases stopped and some form of stability started to return.
That optimism continued when there was even talk of rate decreases by the end of 2023. Spoiler Alert: highly likely we won't see that. As a result, you can see the bump up in overall activity as we went through the spring market until the June/July increases slowed us down again.
LOOKING AT ST.CATHARINES
St.Catharines is the #1 market in Niagara in terms of annual homes sold so it's typically a good indicator of the big picture for a specific city. What you'll see in the next graph, is what you'll see in several of the smaller markets which is again, similar to the Niagara Region:
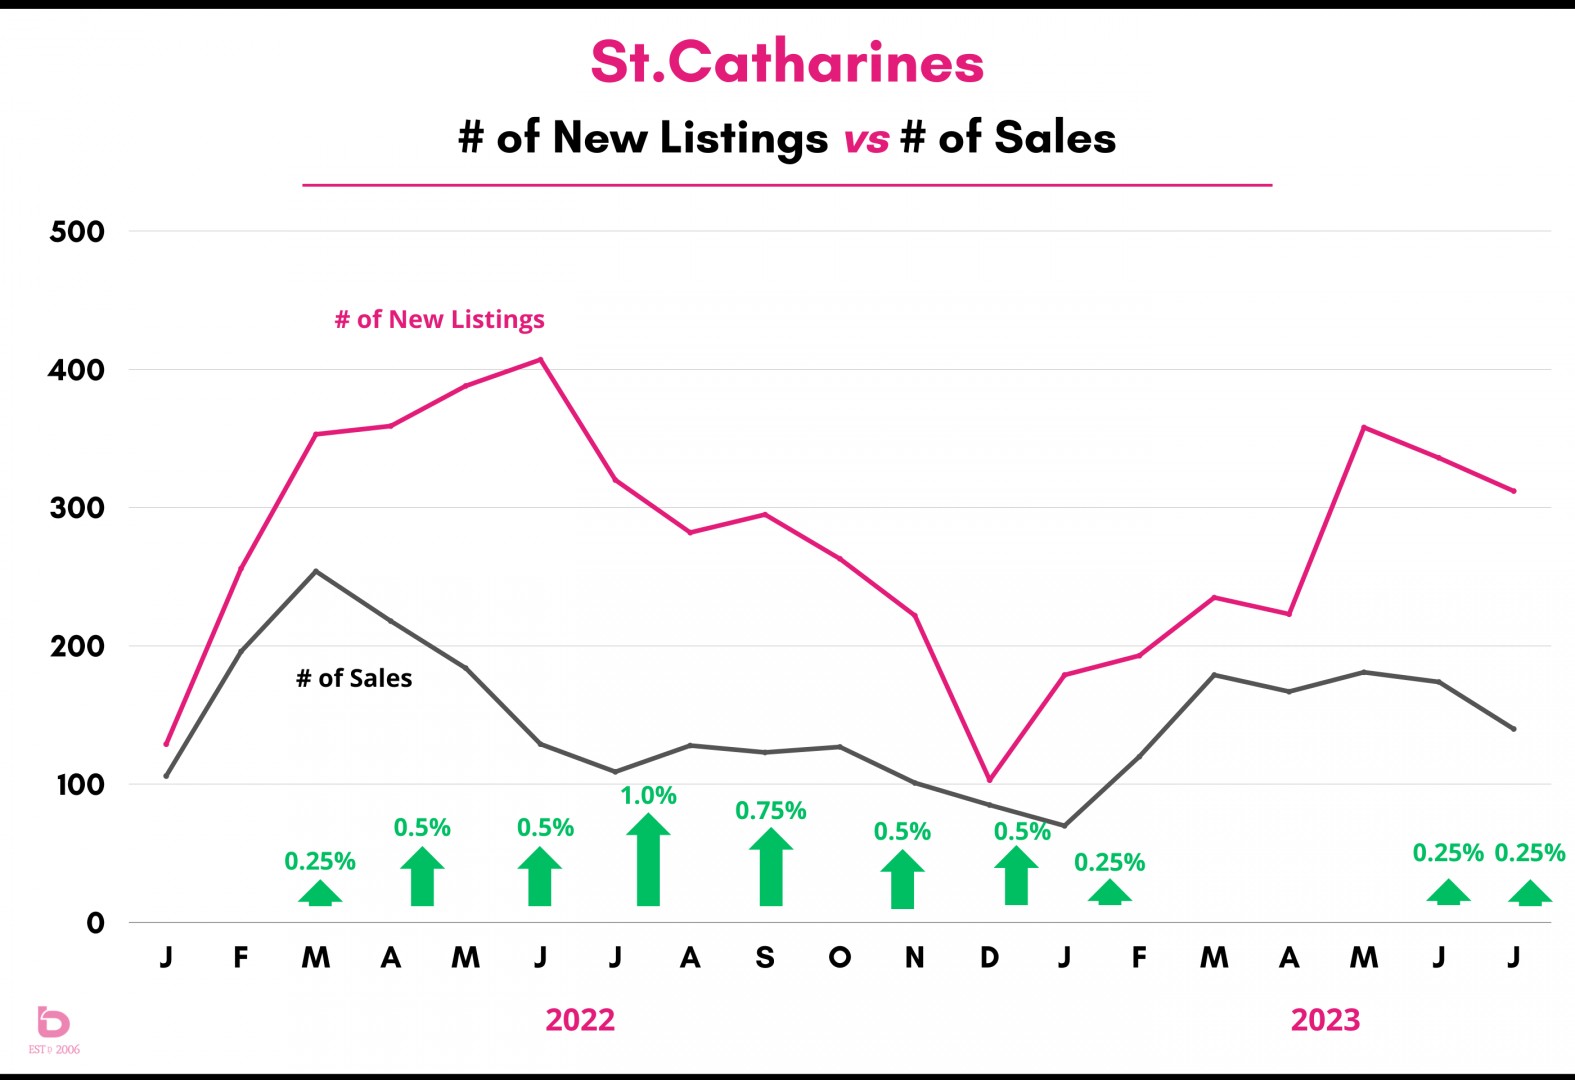
Notice the pink line (number of monthly new listings) here in the middle of 2023. We did have some concern with the number of new listings piling on however that has eased as any momentum the market was gaining into the summer months has eased back.
As new listings and sales move in the same general trend, the average sale prices can usutally sustain themselves which is more or less what we're seeing at this point.
THE RETURN OF THE RATE HIKES
Have a look at this next graph. It is looking at the number of homes sold in the Niagara Region in comparison to the 10-year average.
You’ll see a few things.
- summer 2022 took an absolute pummeling as one rate increase after another stopped the market in its tracks.
- early 2023 showed improvement as rate hikes eased.
- then as we moved into June & July 2023, the rate increases returned, and the number of homes sold pulled back again. In fact, June was down 16% from the 10-year average while July posted a worst-so-far-this-year 26% below the 10-year average.
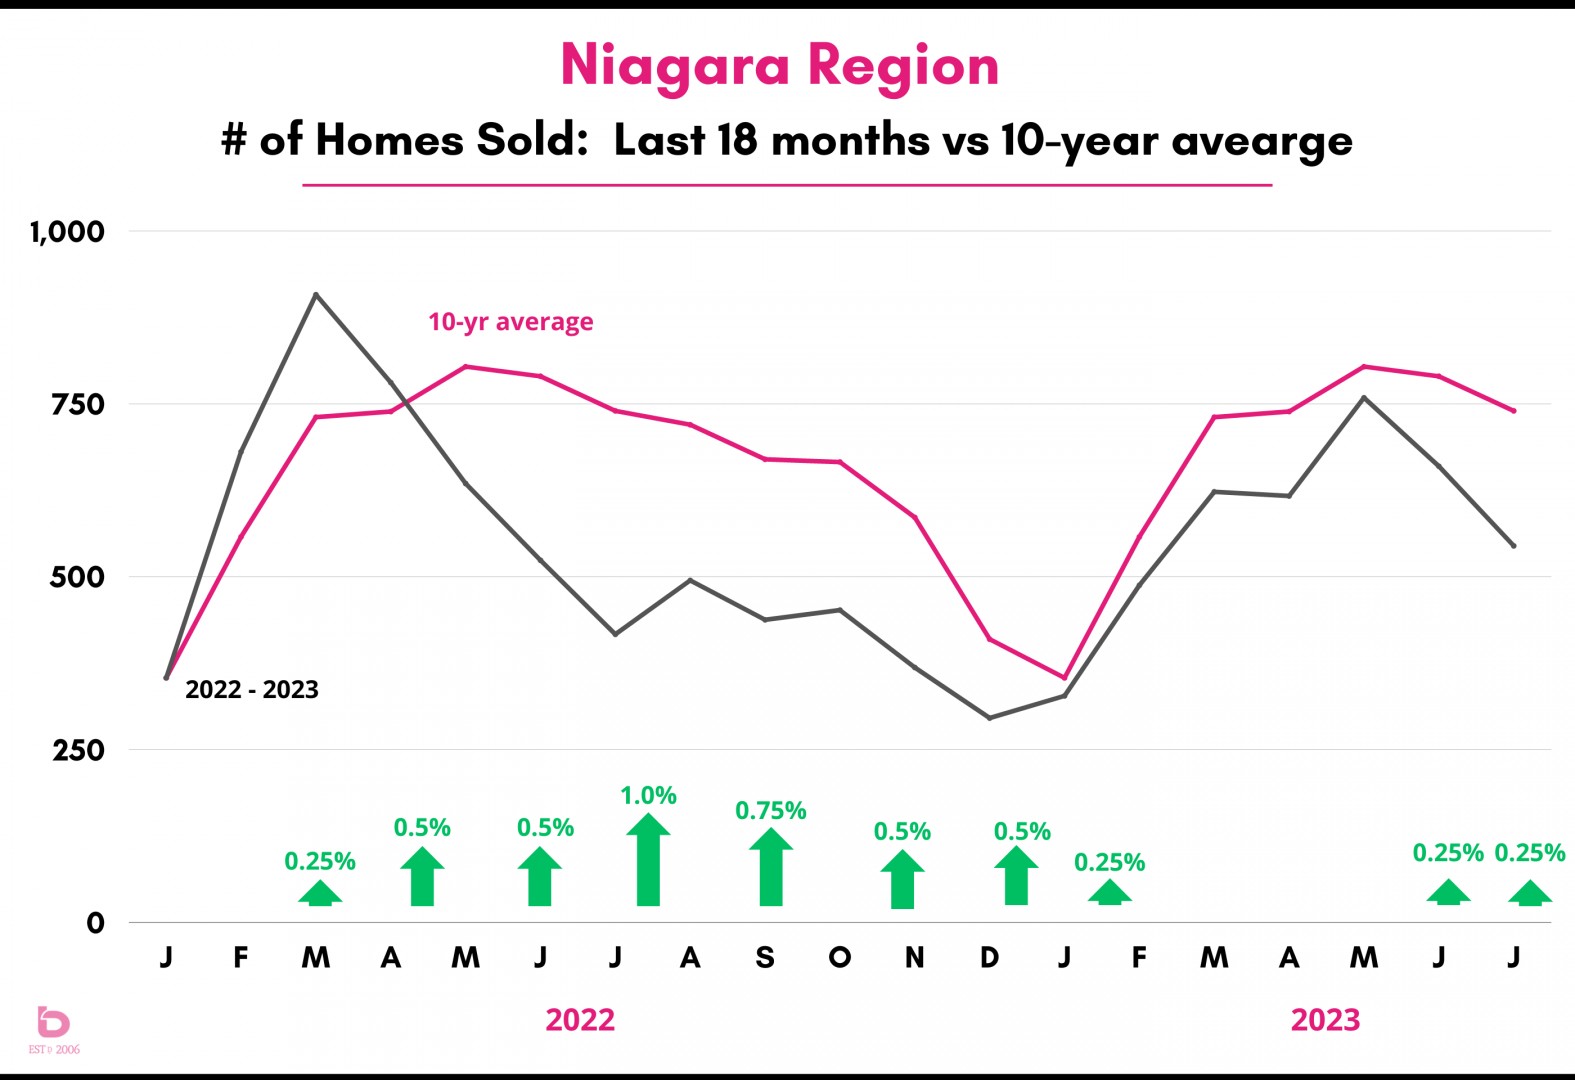
If there is one saving grace here in the middle of 2023, it is that the supply of new listings also pulled back, especially in comparison to summer 2022 when they were 15 – 35% above the 10-year average. Remember, reduced inventory can be key to helping a market find its way through a period of reduced demand.
The instant pullback in sales though here in summer 2023 is without a doubt the direct results of the Bank of Canada’s rate increases, even though they were .25% rather than .5 – 1% like we saw in summer 2022.
WHAT IS MY HOME WORTH?
That’s always the big question. Supply, demand, months of inventory, blah, blah, blah. What kind of money can my home sell for!?
This next graph shows the average sale price trends over the past 18 months for the Niagara Region, Niagara Falls and St.Catharines.
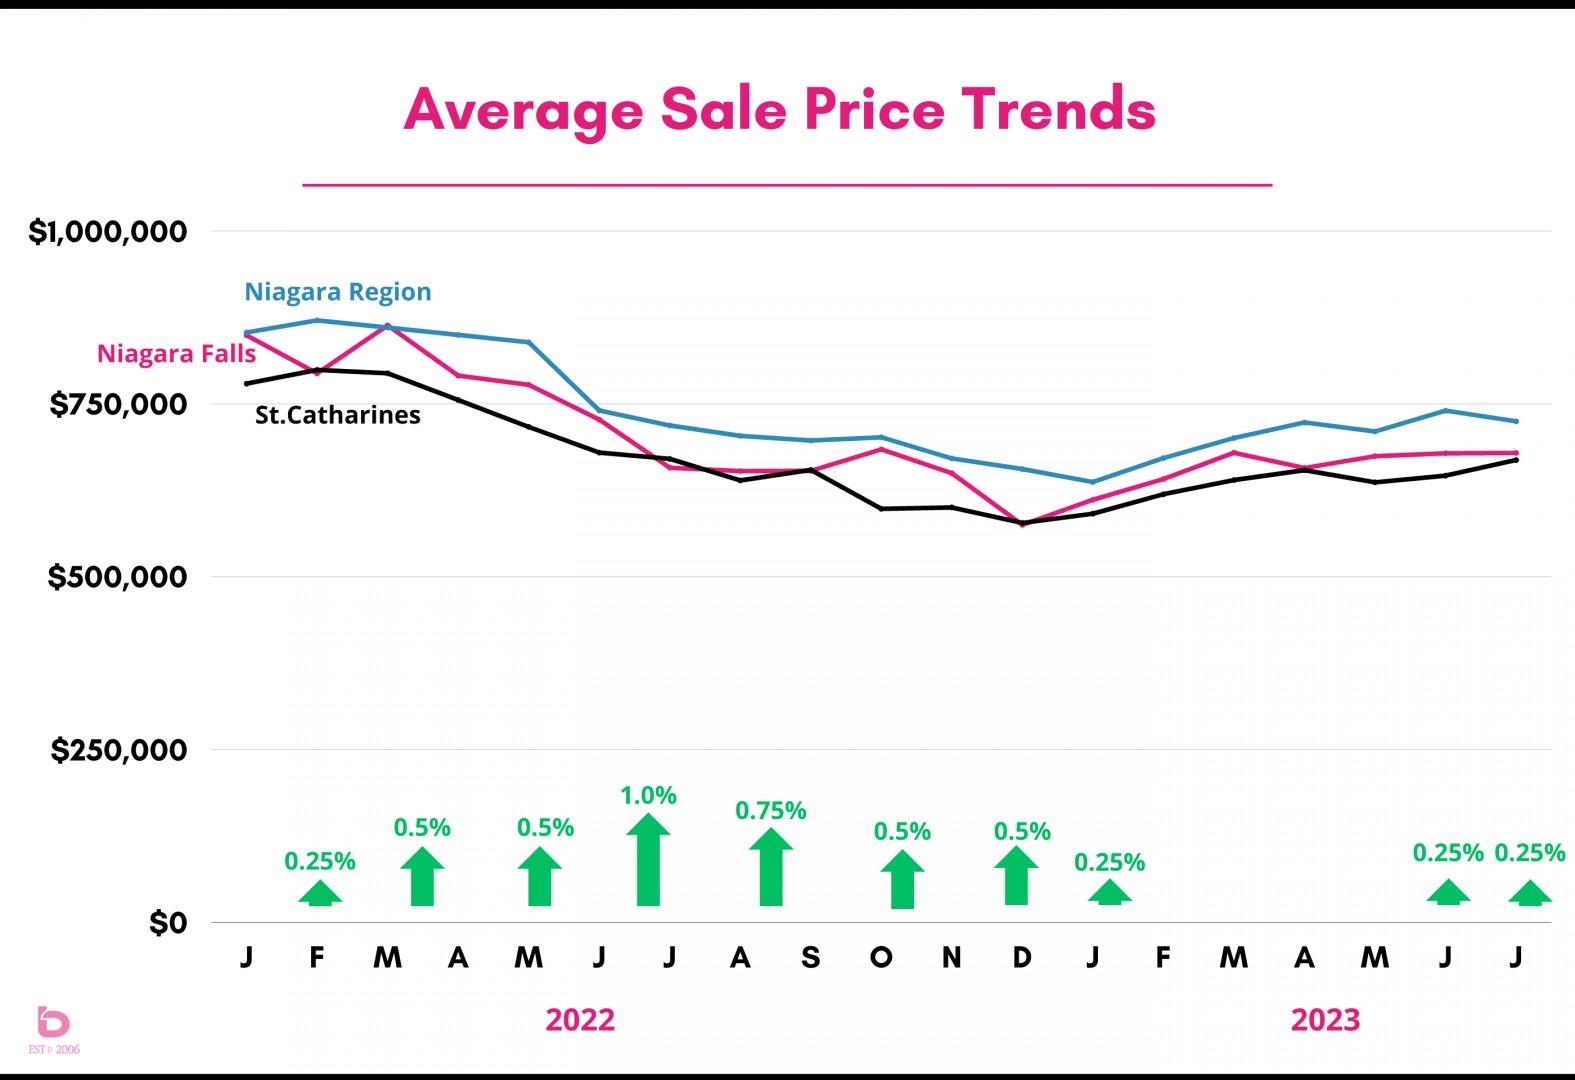
It's important to note that sale prices can be a lagging indicator, meaning what happens in April and May will impact prices in June and July. And that is what we saw as prices pulled back through the back half of 2022, only to start gaining ground through spring 2023.
With the rate increases of June and July 2023, the average sale prices can be expected to stagnate or ease back into the autumn months.
WHAT HAPPENS NEXT?
If there is one thing that the market has taught us over the last few years is that no one really knows what comes next. With the market at the mercy of so many external variables, it is a slippery slope to stand on a soap box and say “I declare the market to be thus!”
That said, here is what we expect to see.
Even though the rates just increased again, humans are adaptable. We saw that after the increases in summer 2022 as people adjusted coming into 2023. That said, buyers and sellers in the balance of 2023 will be serious buyers and sellers. The speculative investor or the recreational mover is likely going to remain on the sidelines for the foreseeable future.
Total sales in 2022 posted a decades-worst 6,486. We expect 2023 to just barely top that amount, coming in at 6,500 – 6,800 sales which will still finish this year close to the bottom of the pack when looking back over the last 10 years.
Here are our recommendations for success here in 2023:
- Homes need to be prepared very well for market. Staging matters. Clean. Landscaped. Organized.
- The days of selling a home and using the “hey, let’s see what happens!” pricing strategy are gone. Your home needs to be priced accurately for the market conditions of today, not months ago.
- It’s astonishing to even have to mention this in 2023, but listing photos taken with a mobile phone should never be acceptable. Beautiful photos and video are crucial in this day and age.
- Time is your enemy. If you’ve been on the market for 2 weeks without serious attention, then you need to review the previous items on this list.
- Local insight is important. The market is made up of many moving parts so make sure you hire someone who is knee deep in current market conditions.
Want to chat? Have questions?