

WHAT IS HAPPENING OUT THERE!?
If you’re confused about the current real estate market, you can take comfort that you’re not alone. The market, data, and world in general is a bit of a puzzle at the moment.
Here is some of the most relevant Niagara real estate market data as we approach October.
Spoiler Alert: the market is struggling.
In a nutshell, the compounding effect of an oversupplied market mixed with an indifferent buyer pool is creating market stagnation, with clear downward pressure on prices.
ACTIVE LISTINGS
“Active listings” is real estate speak for the number of homes for sale. If you’ve driven through Niagara recently, you might have noticed more For Sale signs, (active listings), than usual.
Typically, we’d see about 2,000 properties on the market at this time of year. As of today (September 25th), there are nearly 3,500.
One of two things needs to happen: either many sellers will need to pack it up and come back later, and/or buyers need to start showing up to the party.
This first graphic shows the number of homes for sale by price bracket, along with the percentage of total listings each bracket represents.
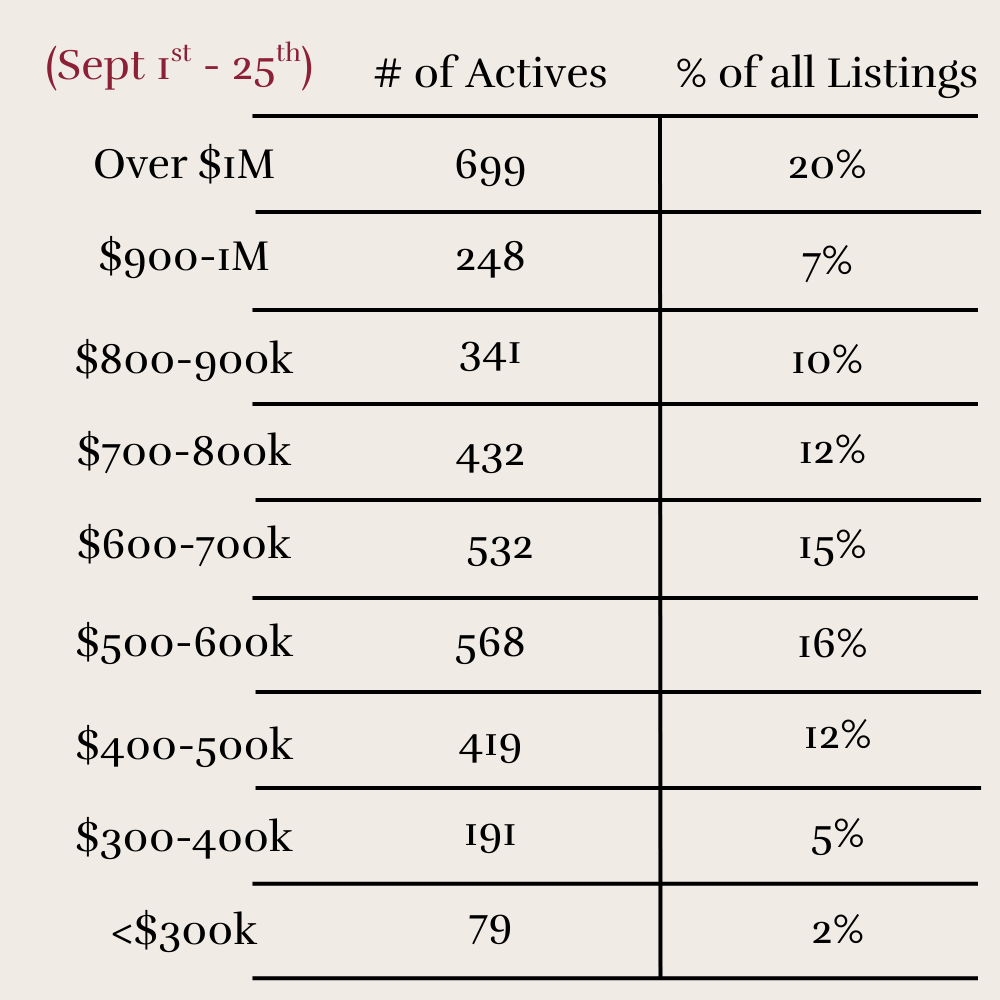
Notice that 20% of all active listings in Niagara are priced over $1 million. The next busiest range is $500 – 600,000, followed by $600 – 700,000. The churn in the lower price ranges is a sign of increasing first time buyer activity which is critical to the health of the overall market.
SOLD HOMES
Now compare that to sales by price bracket:
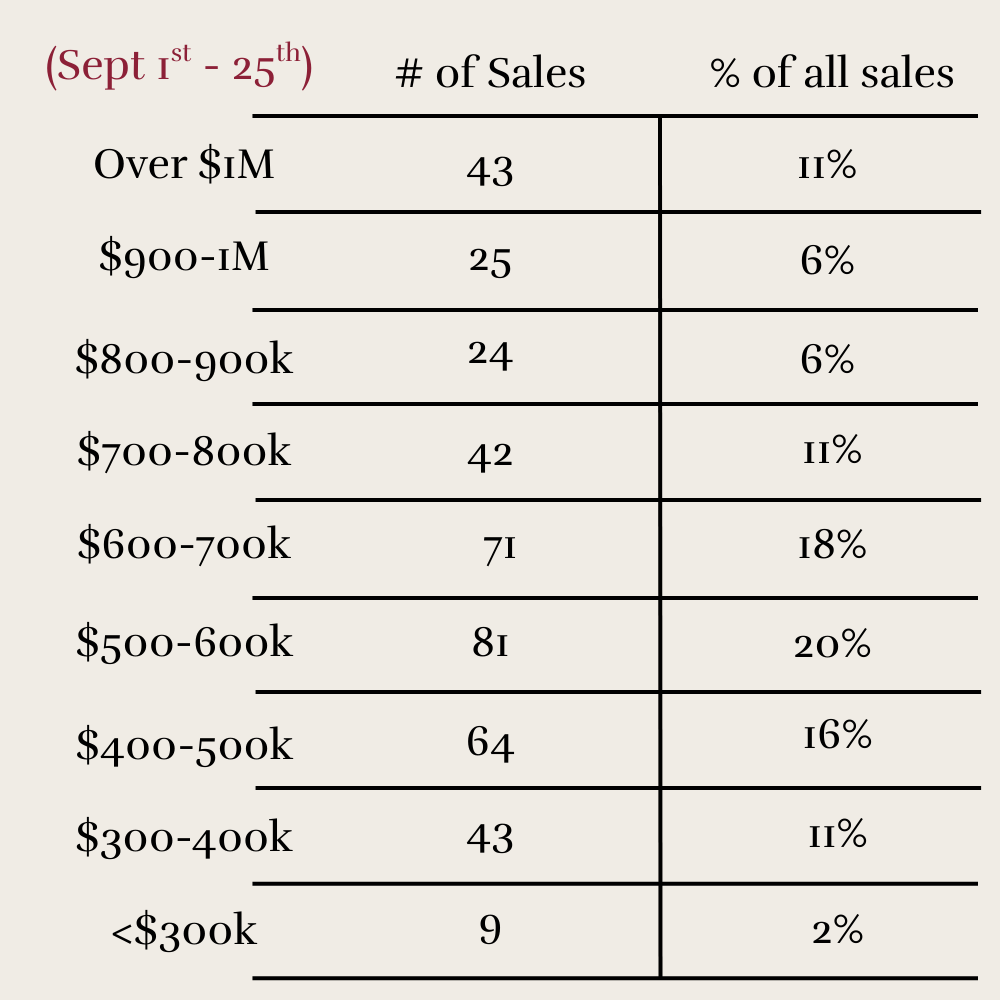
While the $1M+ bracket is one-fifth of all active listings, it only accounts for 11% of all sales. Notably, that is a small boost from just under 10% where it remained over the summer months.
Meanwhile, the $500–600,000 range is where most of the action is, reflected in the median price holding around $600,000 for the past 90 days.
SUPPLY v DEMAND
Another way to view the imbalance in the current market is by comparing active and sold activity side by side
In the below graphic, you’ll see MOI which represents Months of Inventory. It is calculated by determining the number of active listings and dividing that by the number of sales in the past 30 days.
Otherwise known as absorption rate, it represents the speed at which the buyer demand is consuming available inventory.
- Under 2 MOI = fast, seller’s market
- 3-4 MOI = a fairly balanced market
- Over 5 MOI = buyer’s market
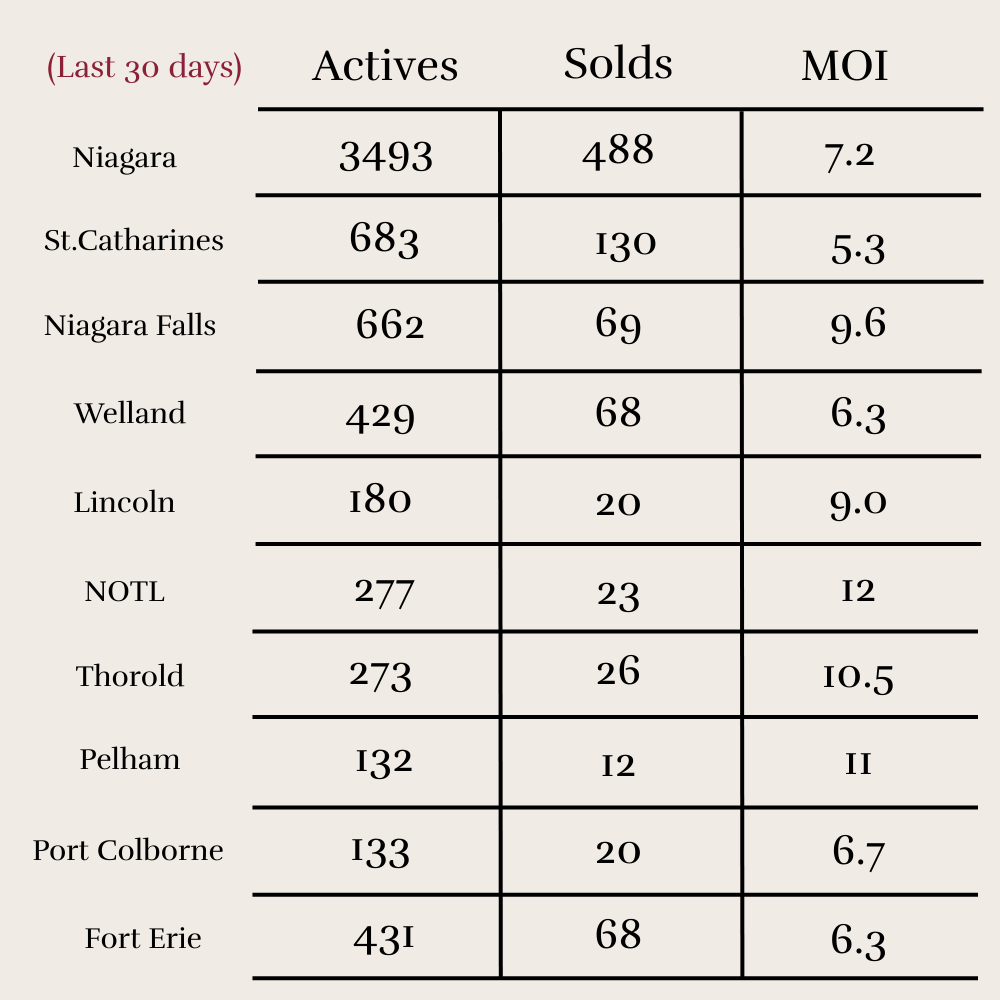
With Niagara coming in at 7.2 MOI, we are knee-deep in buyer’s market territory. And what’s notable is this: both the Niagara Region and its municipalities are at or near their highest MOI of the year. In other words, as buyers continue to stand back and watch, more homes continue to arrive on the market.
HOW ABOUT PRICES
High supply + low demand = downward pressure on prices.
The store owner with overstocked shelves will hunt through the back room for that big SALE! sign to put in the front window. The result is lower prices, which is exactly what we’re seeing across much of the real estate market in Ontario and beyond.
This chart shows the average and HPI prices going back to 2021:
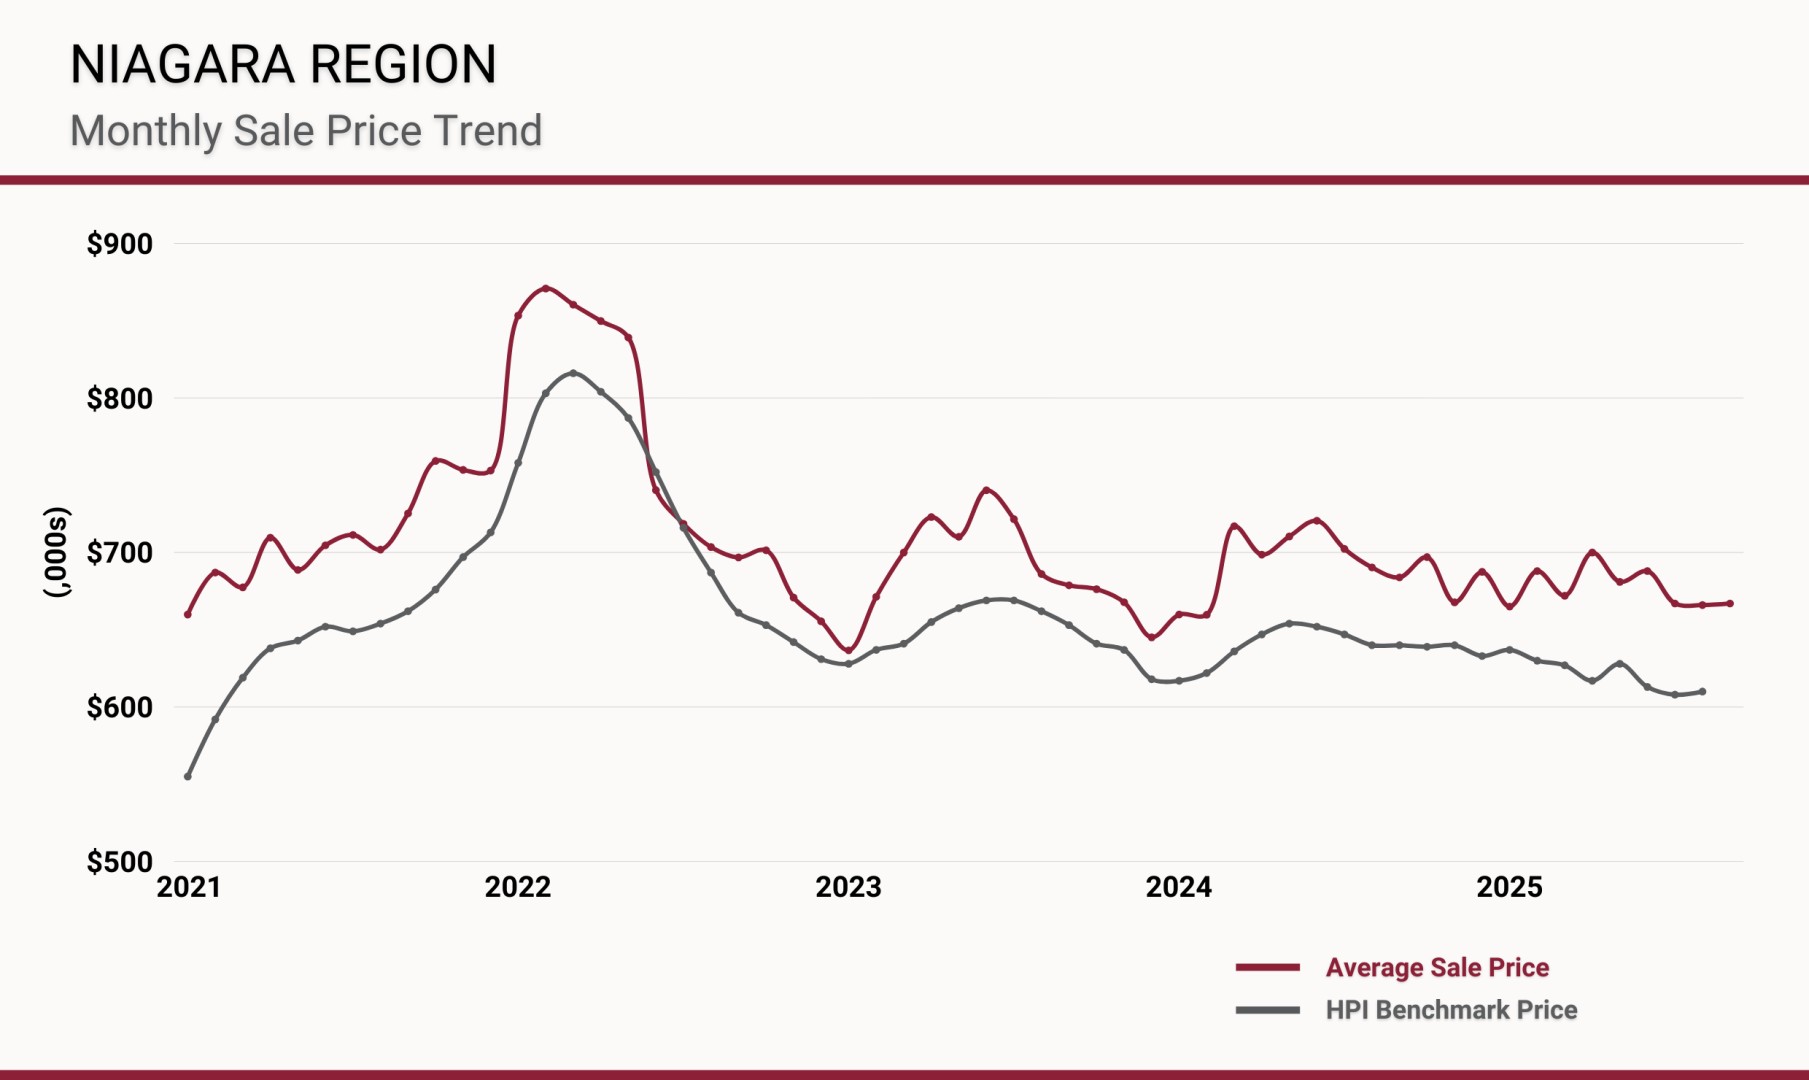
- The burgundy line = monthly average, which is typically volatile due to the presence or absence of large scale three or four million plus sales
- The grey line = the HPI price which takes all of those outliers and relative volatility out of the data. Thus, the line is much smoother, but still follows a similar trend.
To sum up pricing, as long as the entry level housing is experiencing the most buyer activity, we'll continue to see those averages settling in at current levels.
HAS THE MARKET BOTTOMED OUT?
Consider this. Over the past 90 days, we have seen:
- Average sale price within a few thousand of $665,000
- Median sale price within a few thousand of $600,000
- Sales running 23-24% below the 10-year average
- Available inventory stuck in the 3,400-3,500 range (60-70% above the norm)
What will break the trend?
- A calming of the geo-political climate?
- Continued lowering of the overnight rate by the Bank of Canada?
- Improved economic data (GDP, employment)?
- The Blue Jays winning the World Series?
- Sellers adjusting their asking prices closer to current conditions?
Perhaps an improvement in any or all of the above would lead to increased market sentiment. We can only watch and wait.
So, what does this mean for your home? Please don't hesitate to reach out anytime. We're here and happy to help!
....oh, and lastly, Go Jays Go!