
The Smart Baker
It’s early 2022. The Baker is working 8 days a week trying to make enough sour dough to satisfy the seemingly endless line-up of people outside.
The ovens are barely able to cool down at night before they’re cranked up again at dawn the next day. The Baker makes 100 loaves but 150 Bread Buyers want to buy them. New staff are hired, and hours are extended.
“$12 for a loaf!?”
“Uhmmm… Excuse me…I’ll pay $18”
“Really!? Ok fine. I’ll pay $22”
Then suddenly (April – May 2022), the Bread Buyers learn that the cost to buy that delicious loafy goodness is going to go up. Not just the price, but the bank charges are increasing too (yes, stretching the analogy but you get the point).
The Baker is worried. The line-up is suddenly not out the door. In fact, there isn’t a line-up at all.
“Quick. Make more bread! There’s still a chance!!” (…in the voice of Logan Roy)
“…are…are you sure boss?”
“YES! Make bread before it’s too late!”
Unfortunately, the line-up is now reduced to a few people standing around wondering if they actually still want the sour dough experience at all.
The Baker makes another 100 loaves on Wednesday. Then 120 on Thursday. At the end of the day on Friday, the shelves are overloaded with unwanted bread.
"BAAAAKE!!!"
$12? How does $8 sound. Or $6... Suddenly, the compost bin is full of unloved and unwanted sour dough. (June, July 2022)
By late summer into fall, The Baker starts to recognize the new reality. They’re still making too much but at least only 10 or 15% too much. Prices start to stabilize as they start to understand the new level of Bread Buyer demand. Not a line-up but still, bread is still on the grocery list.
THEN ALONG CAME 2023
The Baker, resigned to his fate, starts to make less and less bread on a monthly basis.
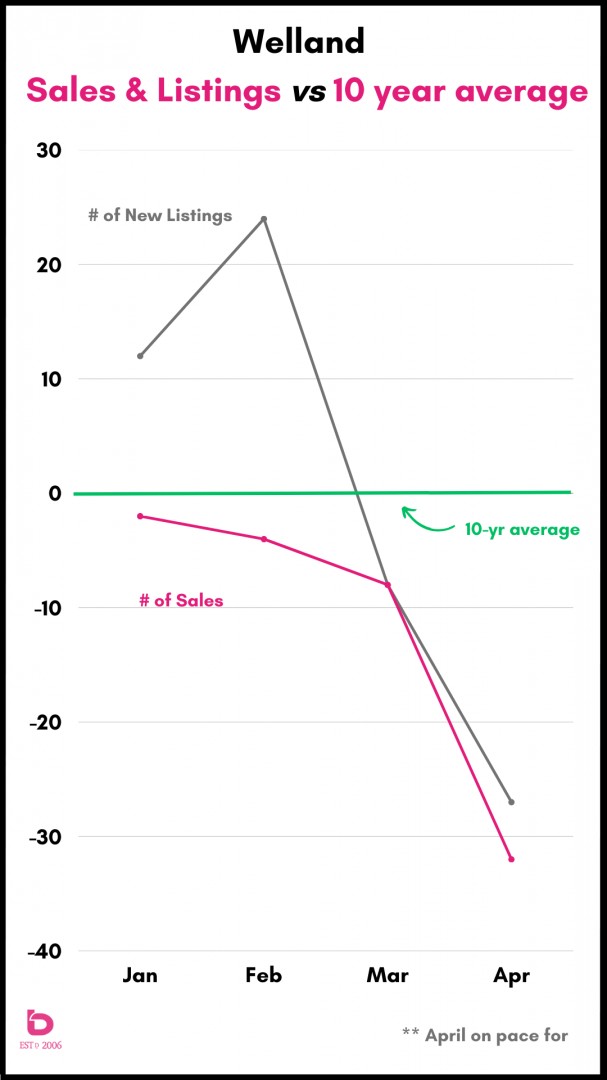
January 15% more than normal
February 9% more than normal
March 2% more than normal
April 9% less than normal
Now, even though there are less sour dough loaves being sold, at least there aren’t dozens going to waste every night.
Meanwhile, the number of Sourdough Enthusiasts has started to level out. Still, far less than normal, but on a monthly basis, they’re similar. Compared to the normal numbers, they are:
January 23% less than normal
February 13% less than normal
March 15% less than normal
April 30% less than normal
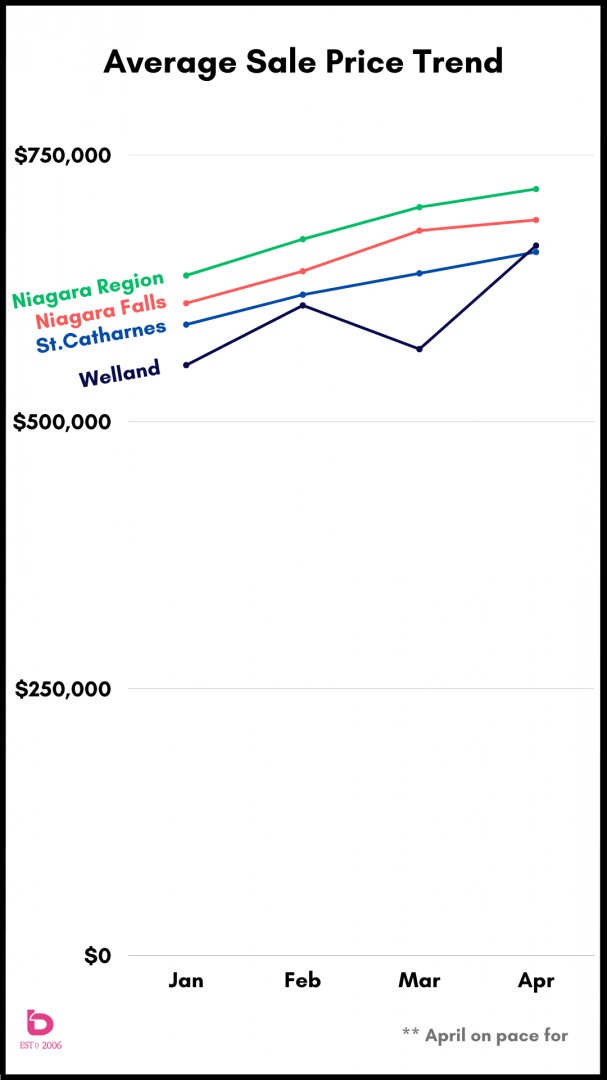
As Bread Buyers see their choice of sour dough start to drop, prices have started to increase, even just a bit. Now that loaf of wonderment has gone from $8 to $12 to $14. Sure, it’s not the $22 of last year but hey, compared to even just a few years ago, that’s still a great price.
The Baker is feeling better. Things are a bit more predictable.
The Bread Buyer is feeling better since they have some choice and sure, prices are up but they’re not at early-2022-ridiculousness levels.
CHANGE THE CHANNEL
The Baker = the home seller
The Bread Buyer = the home purchaser
The supply of Sour Dough = the number of homes listed for sale.
The number of loaves sold = the number of homes sold
So yes, here in spring 2023, the market has improved and yes, the prices of homes are up so far this year. And the main reason is that even though the number of homes sold are down 10 or 20 or 30% compared to the 10-year average, the number of homes listed for sale has also declined.
Reduced supply & Reduced demand = 2023 price trends.
As long as those two pieces move in some form of symmetry, we will see prices hold or escalate.
The next 4 – 8 weeks will be key to watch. Will the number of Bread Buyers increase? After all, it’s the spring bread market. And, if that line-up starts to form again, how willing will The Baker be to fire up the ovens and increase production?
Stay tuned. This sourdough saga is far from over.
Looking for graphs? (...of course you are).
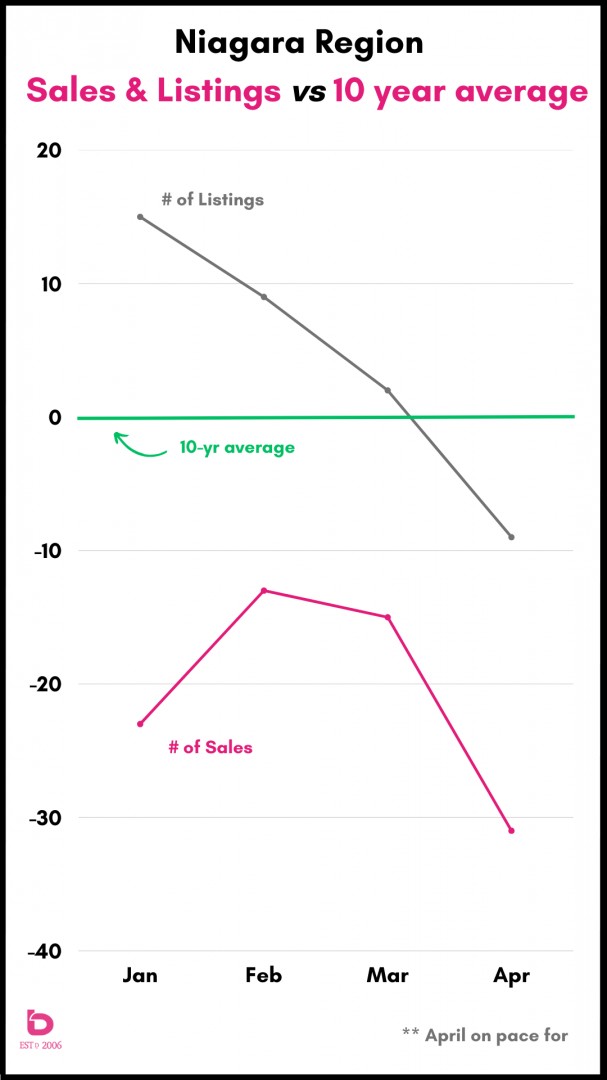
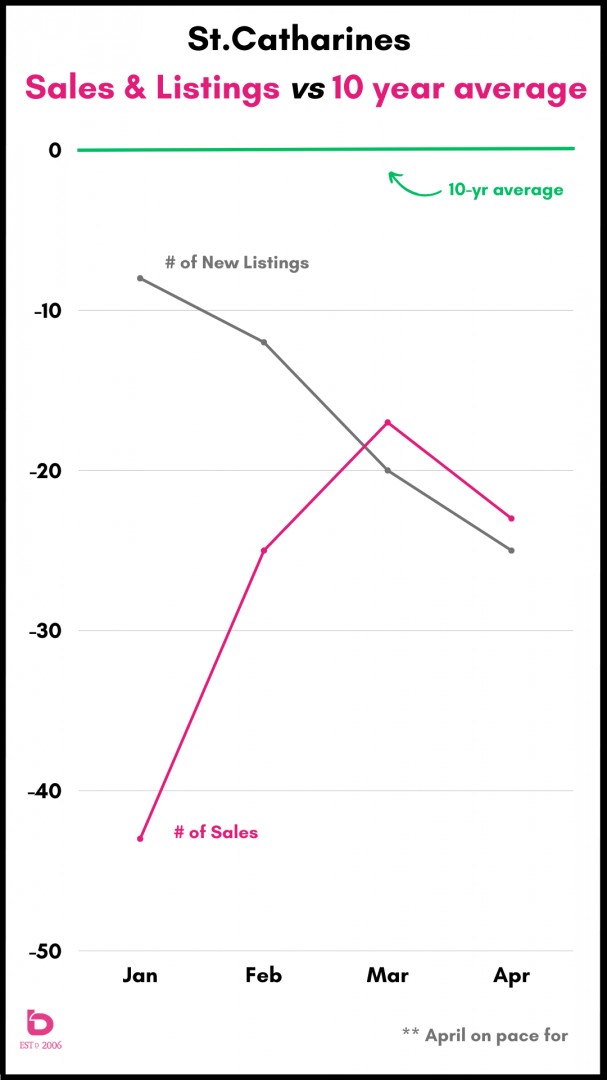
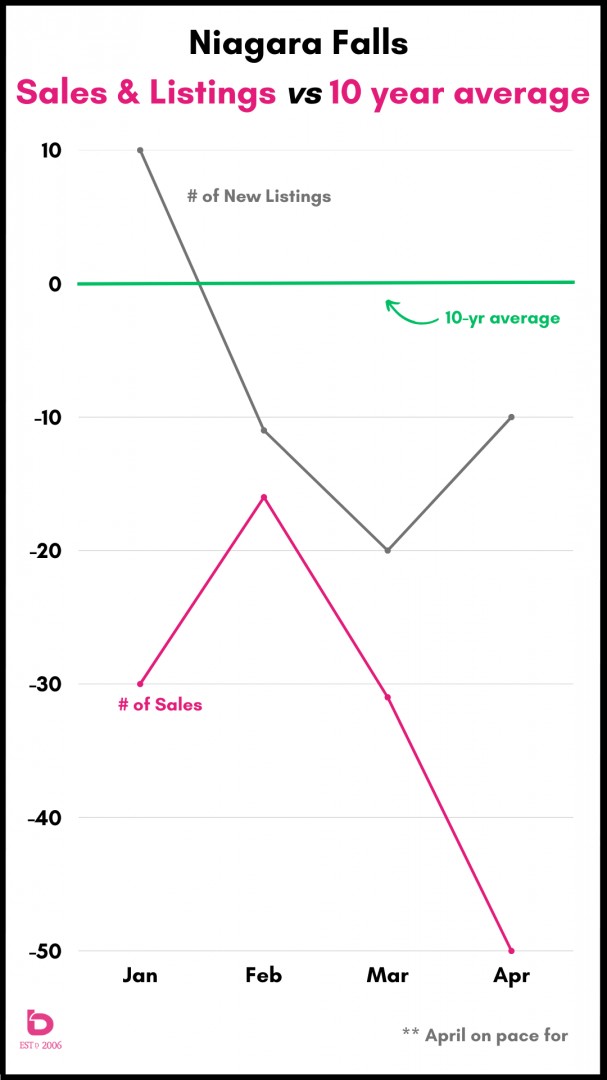
Here are a few that will help show how 2023 has performed:
2 things.
1. The grey line is the number of new listings. The pink line is the number of homes sold. And the green line represents the 10-year average. So, 10% above that line equales 10% above average.
2. April 2023 is "on pace for" as of the 3rd week of April.
Questions? Want to chat about your home or the market?