

The Roller Coaster Ride Continues!
Remember earlier this year when the market was running at full steam?
The number of new listings in March were up 50% over the 10 year average. Sales? They were up 79%!
April 2021? There were 1,163 sales in Niagara, up from a COVID decimated 292 sales in April 2020. The average over the last decade in April was 671 so yes, April 2021 beat the 10 year average by 73%.
Cue the 'unprecedented times' refrain.
So, naturally, after a race car or horse or marathon runner or market runs flat-out at a record-breaking pace, it is only natural that it eases. The question/concern is how much does it ease. Does it slow down to a comfortable trot? Or does it blow a tire and crash into the barrier on the final turn?
As of now, we are seeing a market that has simply geared down, pulled over into the right lane and started to cruise at the speed limit. ...this shall conclude the car racing analogy.
What's happening with the number of sales?
The numbers speak for themselves. This chart shows you the demand (# of Sales) monthly in Niagara as the market has calmed since May:
| # of New LIstings (Supply) | 2021 | 10 yr Avg |
% difference |
|
May |
1,099 | 774 | 42% |
|
June |
942 | 774 |
22% |
|
July |
815 | 737 |
11% |
|
Aug |
798 | 718 |
11% |
|
Sept (on pace for) |
710 | 658 | 8% |
To sum that up, sales in March were up 79% over historic levels while September settled down to being up 8% over normal.
What's happening with prices?
One important part of the market is the level of synchronicity between supply & demand. Meaning, if the supply of new listings moves in similar fashion to the number of sales (demand) then the pricing trends should maintain some consistency.
This graph shows you the monthly number of sales and new listings so far in 2021. Note: September's numbers are "on pace for".
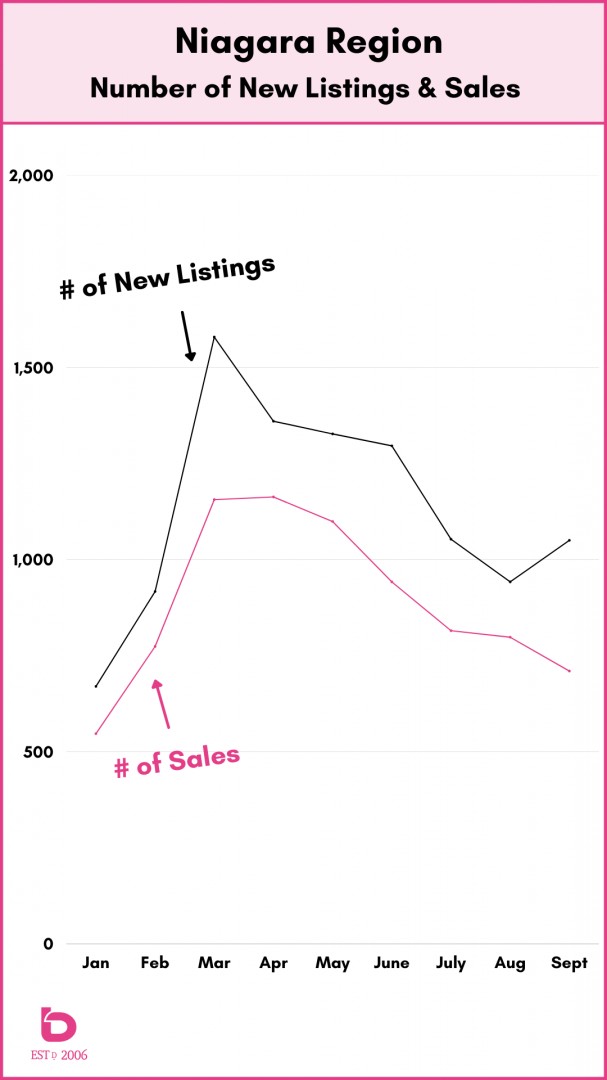
Note that for the first time this year, the number of new listings and the number of sales have gone in opposite directions. At this point, any build in inventory is a welcome change for all of the buyers out there.
That being said, the monthly pricing numbers have held and continued to escalate throughout the year, with many cities in Niagara posting all-time monthly records in either August or September. Again, any September numbers are "on pace for" but here on the 24th of the month, we can put some weight into the data so far.
Here is a quick look at where things stack up in terms of average sale price for the Niagara Region, St.Catharines and Niagara Falls:
NOTE: ASP = Average Sale Price:
| ASP September 2021 | ASP YTD | ASP 2020 | % change from 2020 | |
|
Niagara Region |
$723,000 | $696,000 | $554,000 |
26% |
| St.Catharines | $667,000 | $635,000 | $496,000 |
28% |
|
Niagara Falls |
$665,000 | $653,000 | $515,000 | 27% |
26% up? 28% up?
Yes, you're reading that correct. In fact, every municipality in Niagara is up between 24 - 28% annually aside from Fonthill and Niagara-on-the-Lake which are up 19% and 13% respectively.
Here is a quick look at where each of the other cities in NIagara are YTD and how they relate to last year:
| City | ASP YTD | % chance from 2020 |
|
Welland |
$580,000 |
28% |
|
Fort Erie |
$652,000 | 28% |
|
Grimsby |
$848,000 | 26% |
|
Thorold |
$636,000 | 26% |
|
NOTL |
$1,090,000 | 13% |
|
Port Colborne |
$650,000 | 28% |
|
Lincoln |
$823,000 | 26% |
|
Fonthill |
$900,000 | 19% |
Remarkably consistent across the board aside from Niagara-on-the-Lake and Fontill which happen to be #1 and #2 on the 'highest average sale price' list so not a huge surprise to see them a bit more level.
That's a wrap for now. If you're ever curious on other aspects of the market or if you'd like to chat about your home, neighbourhood or city, you are more than welcome to reach out anytime.
Thanks for visiting!