

Was February a sign of things to come?
If you were to ask around amongst the Realtor community these days, you may hear tales of a market picking up. A property went on the market and got 12 showings over the weekend and sold on Monday! You know, that type of tale.
Well, there is recent anecdotal evidence and there is data, and rarely do the two line up. That is until February 2024 came along. February. A month of cold temps and probably too much Netflix. Who knows why, but this February had a dose of optimism and mild urgency. Let's let the graphs tell the story.
MONTHLY SALES v 10-YEAR AVERAGE
Or in other words, how did these past few months (or years) do in relation to the 10-year average that preceeded them. You'll see below that the red line represents the 10-year average while the black line represents 2022 through to February 2024.
Note early 2022 when the monthly sales far out-paced the 10-year average. We all likely remember what happened in spring 2022. The Bank of Canada showed up and dumped a bucket of water on our collective campfire resulting in 21 consecutive months of the market underperformig the 10-year average. And by underperform, we mean under.
At its worst, the market was running 30 - 40% below the 10-year average for monthly sales while the number of active listings ran at their highest level since 2014/15. The result? Prices retreated while buyers hid in the bushes waiting for safer times.
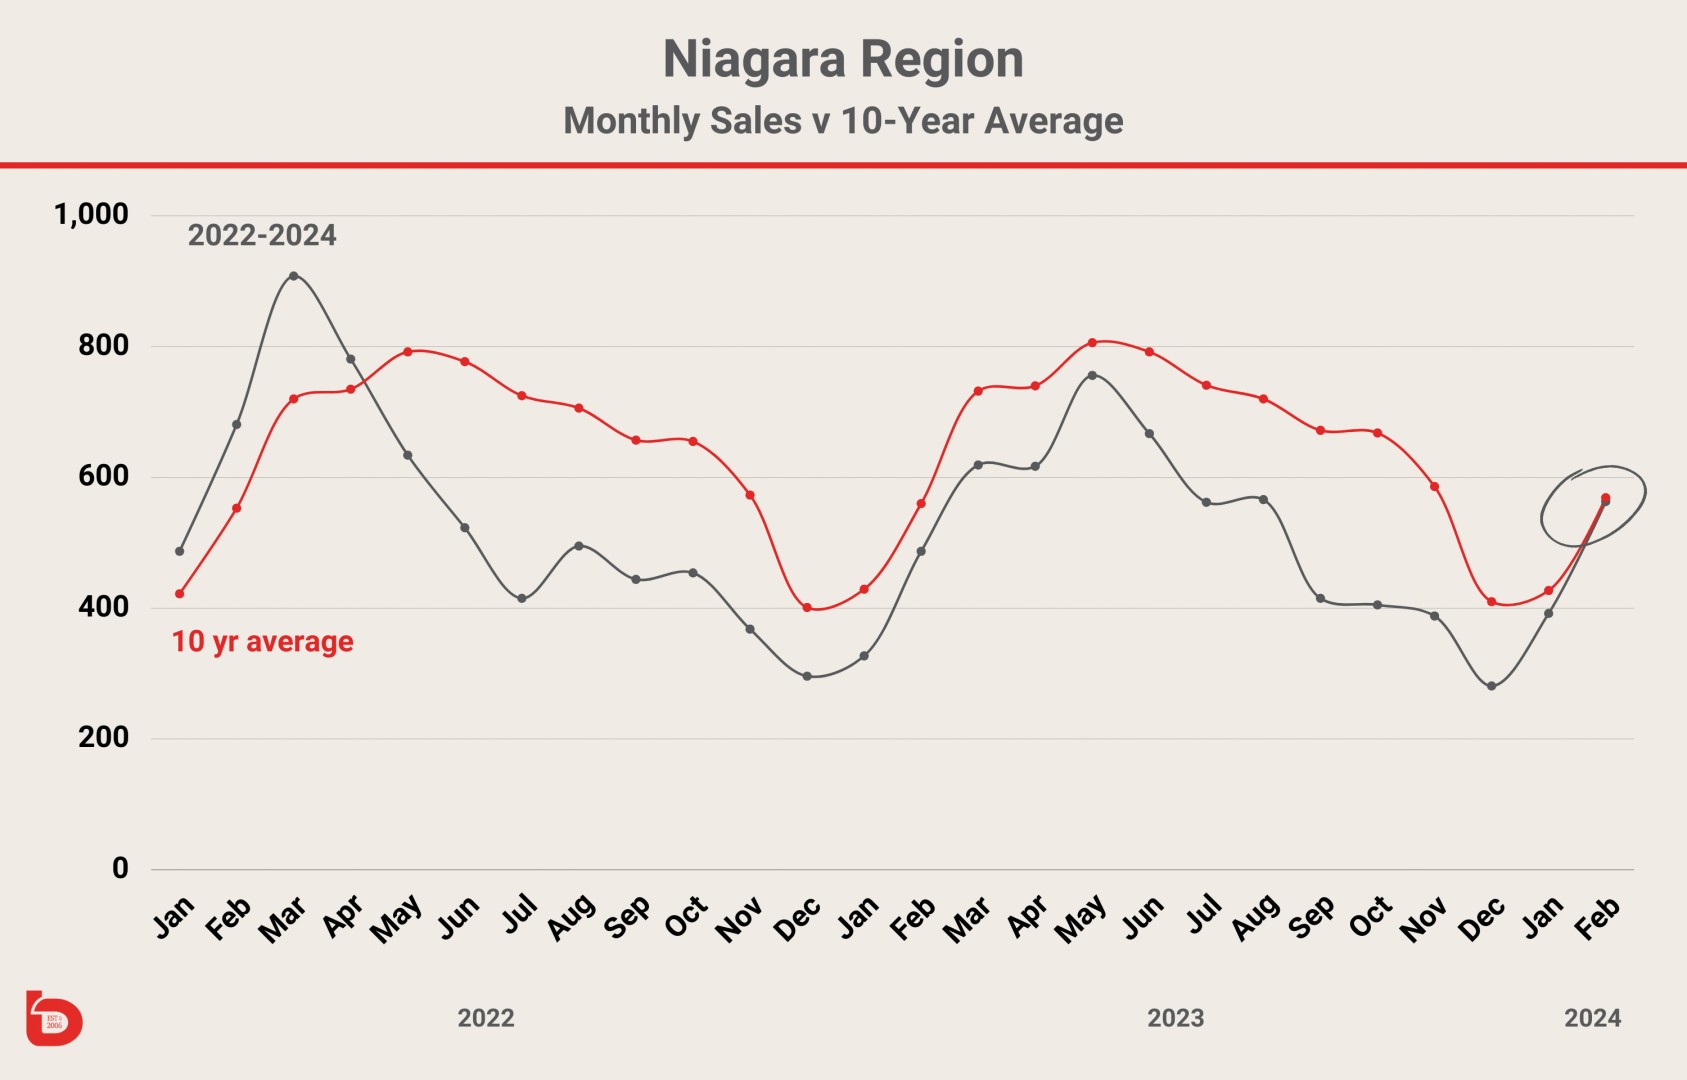
What made February 2024 so special? It was a mere 6 sales away from tying the 10 year average. Considering monthly sales in Niagara hadn't equalled or bettered the 10-year average since April 2022, the fact that January was 8% off and February was less than 1% off is worthy of some form of recognition (note addition of the spotlight in the image for this blog).
Which raises the question. Is February 2024 a harbinger of things to come in what may be an entertaining real estate market? Is overall market sentiment and confidence improving? Perhaps.
How about St.Catharines? Since St.Catharines produces the highest annual sales of any city in Niagara, we tend to keep more of an eye on this relative metropolis. And yes, the graph shows much the same story.
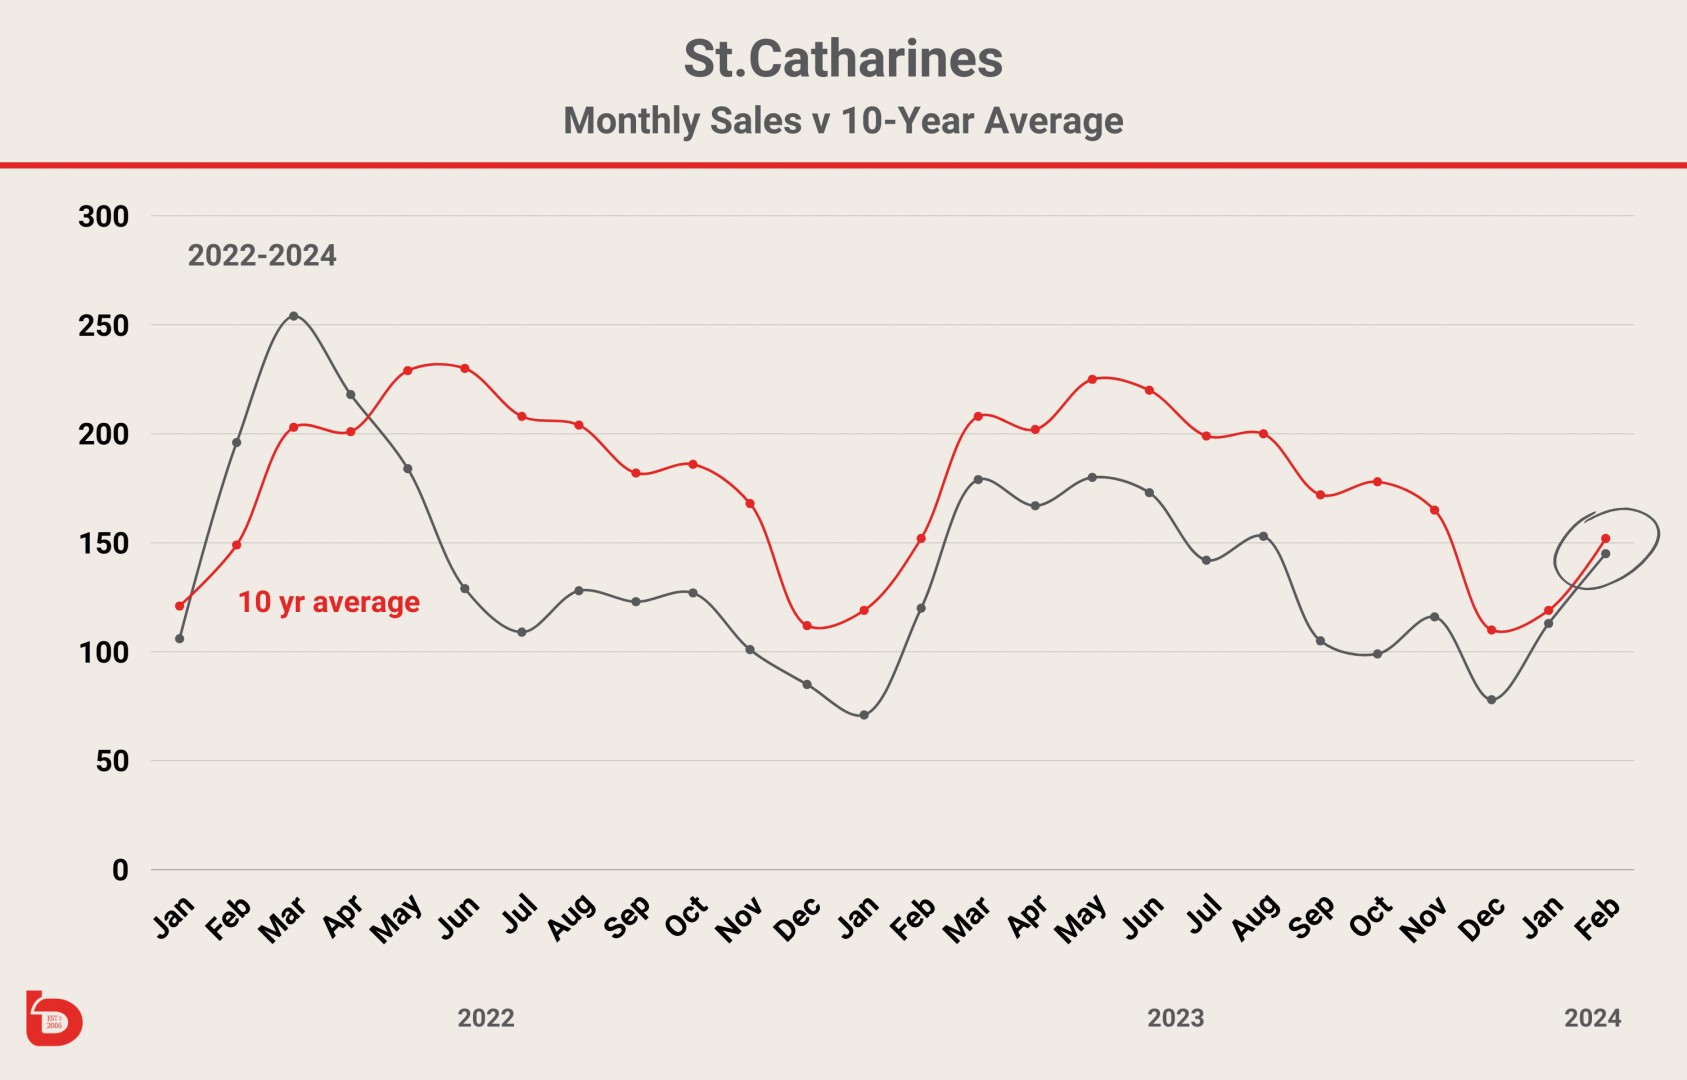
February 2024 in St.Catharines wasn't quite the comeback kid that the Niagara numbers were, but both January and February were a mere 5% off the 10-year average. Considering the last 6 months of 2023 were 25 - 45% off of the 10-year average, we will take 5% off any month of the year.
WHAT HAPPENS NEXT?
March and April are setting up to be a fascinating time for us real estate data nerds. If you'd like to keep track of the latest and greatest numbers, please keep tuned in here.
As always, thank-you for visiting.