
WHAT HAPPENS NEXT?
When things go bad, we wait, sometimes patiently, for things to improve. And often when things are riding too high, there's always someone in the room that will say "yeah...but...". And of course, the same applies to any real estate market.
After the roller coaster we've all been riding on in recent years, it's understandable that a market watcher would expect to see quick and abrupt change yet again. At this point, we've almost been conditioned to it. So, with the rumblings of market improvement here in early 2023, it's important to look at the monthly data as well as trends to get a better handle on the market realities.
BASIC MARKET CONDITIONS
First, let's look at supply versus demand. How many homes are for sale and how many people want to buy them.
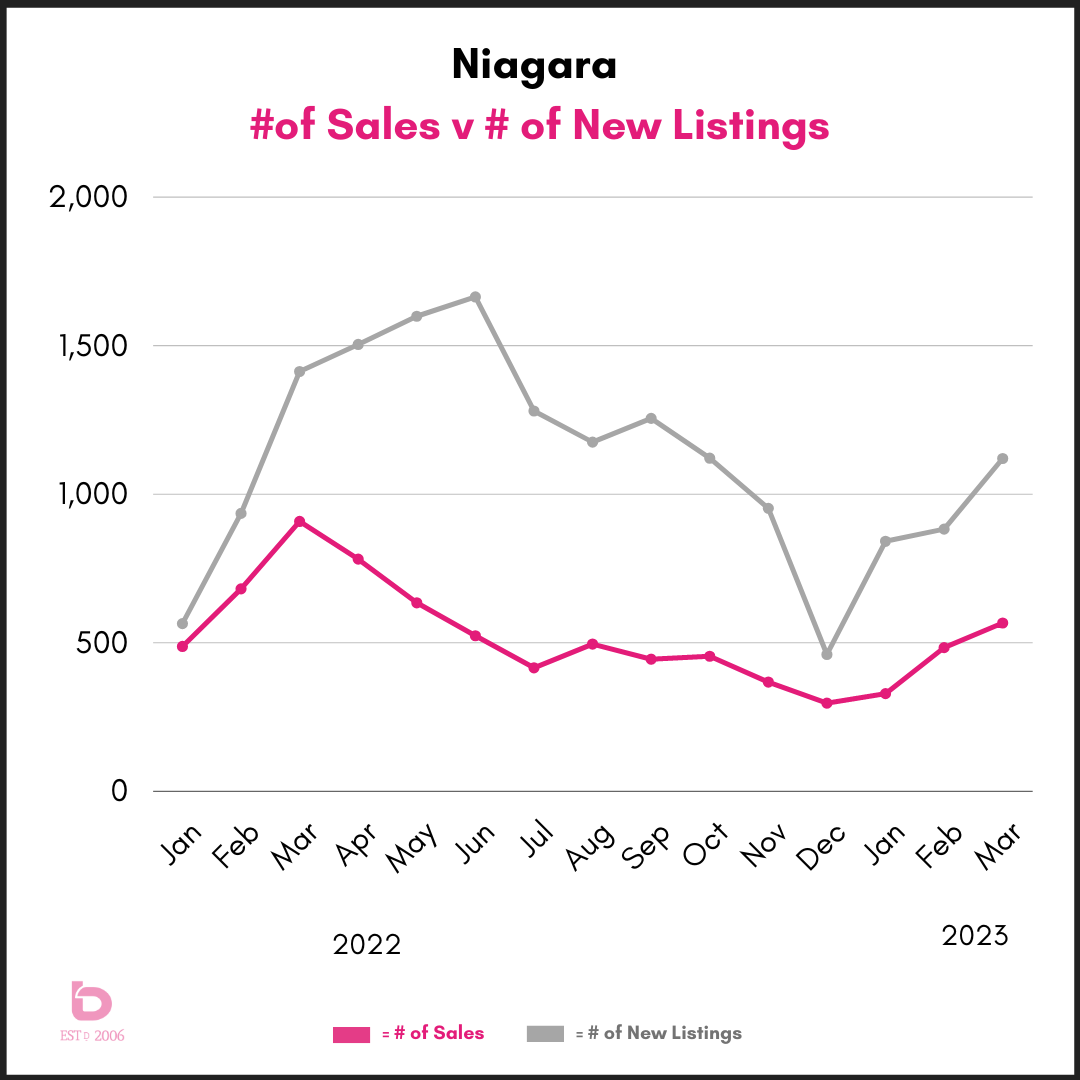
This graph shows you the number of new listings (in grey) against the numer of homes sold (in pink). It's important to note that the March 2023 are "on pace for". This blog is written and published on March 16th.
We typically see a push of new inventory in March through May so that ascending grey line is no real surprise. The key is the buyer's appetite to absorb those new listings.
There are 2 key points to know.
- The number of new listings In January was 15% above the 10-year average. February was 9% above while March is only on pace to be 2% above the 10-year average. Given the modest amount of buyer demand, the tempered supply has helped this recent price growth.
- The number of homes sold in January was 23% below the 10-year average. February was 13% below and now March is currently on pace to take a step back and settle in 20-23% below the 10-year average. As a result, the price bumped up in February and has remained somewhat flat here in March.
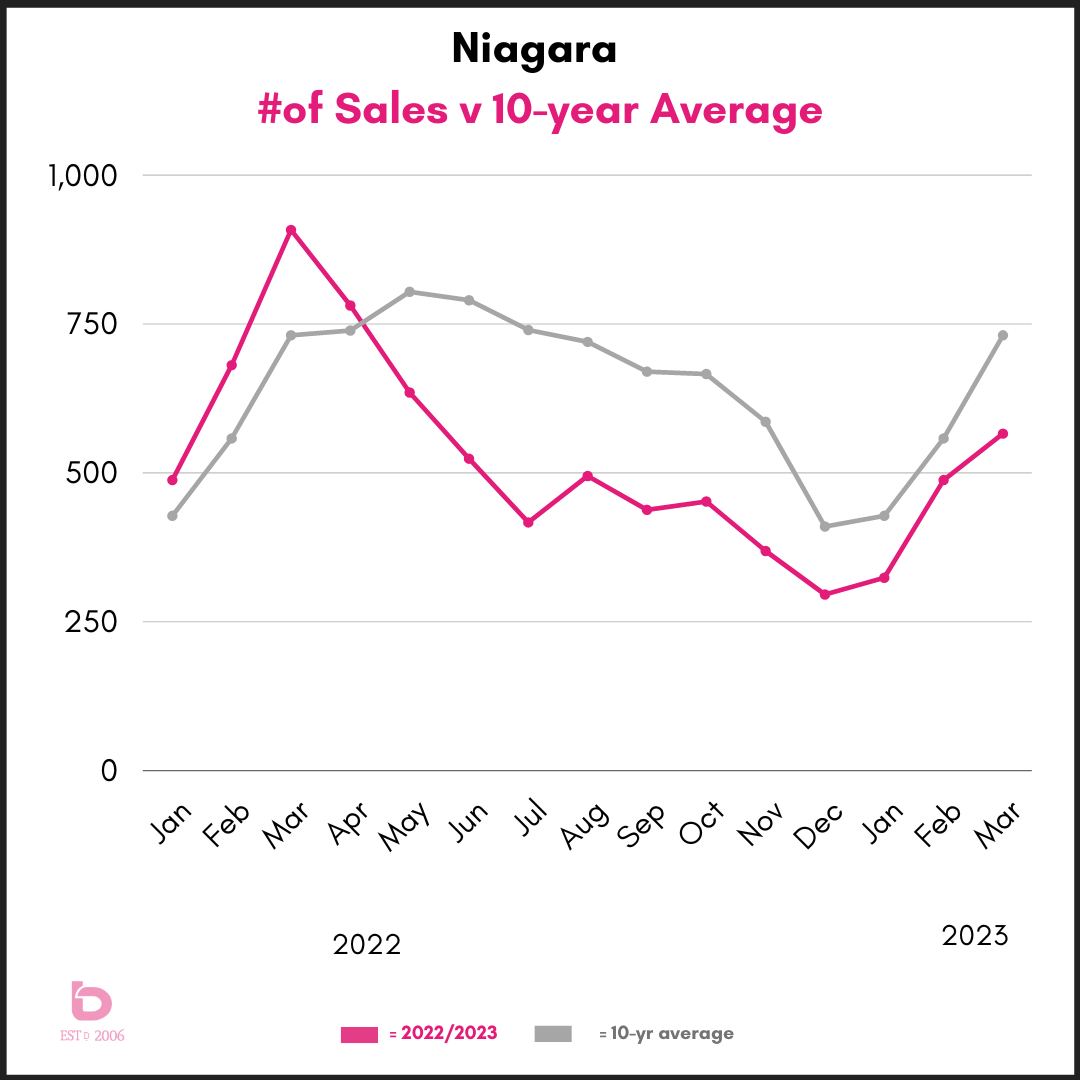
This next graph takes a look at how sales have performed since January 2022 to now, in comparison to the 10-year average. You can clearly see the various stages that the market has gone through. One thing we'd like to see is that pink line (current conditions) keep pace with the grey line (historical norms).
ST.CATHARINES
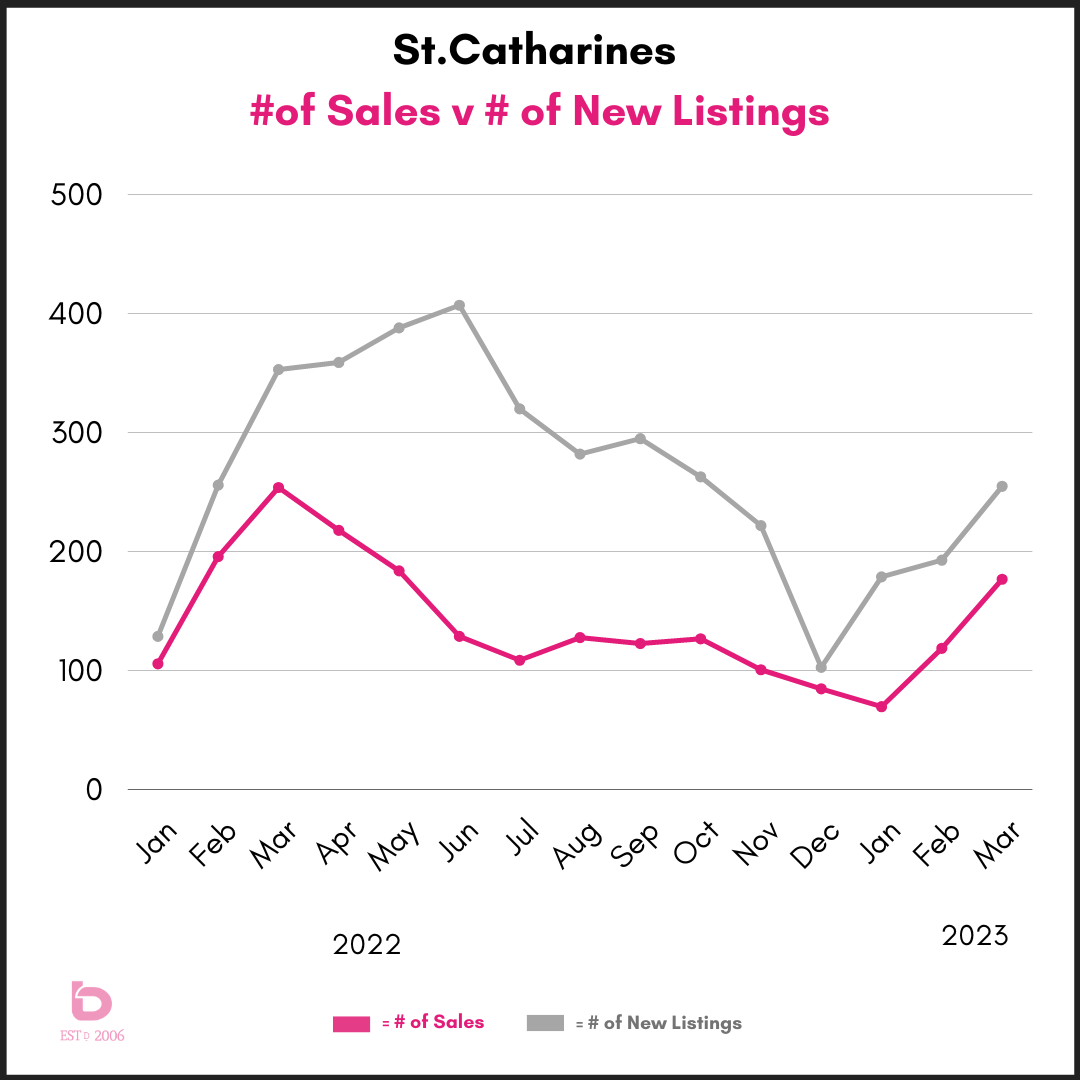
For the sake of comparison, let's look at the same info for St.Catharines. In general, it looks the same but in reality, the market dynamics are tighter in St.Catharines.
There are 2 key points to know.
- The number of new listings In January was 8% below the 10-year average. February was 12% below while March 14% below the 10-year average. In fact, Q1 2023 is on pace to be 12% below the 10-year average for new listing inventory.
- The number of homes sold in January was a staggering 43% below the 10-year average. February was 21% below and now March is currently on pace to be 15% below the 10-year average. That would be the strongest monthly sales numbers since April 2022.
So, while sales are 15% below the 10-year average, the number of new listings is 12% below, resulting in the average sale price in St.Catharines popping up 10.2% from January to March.
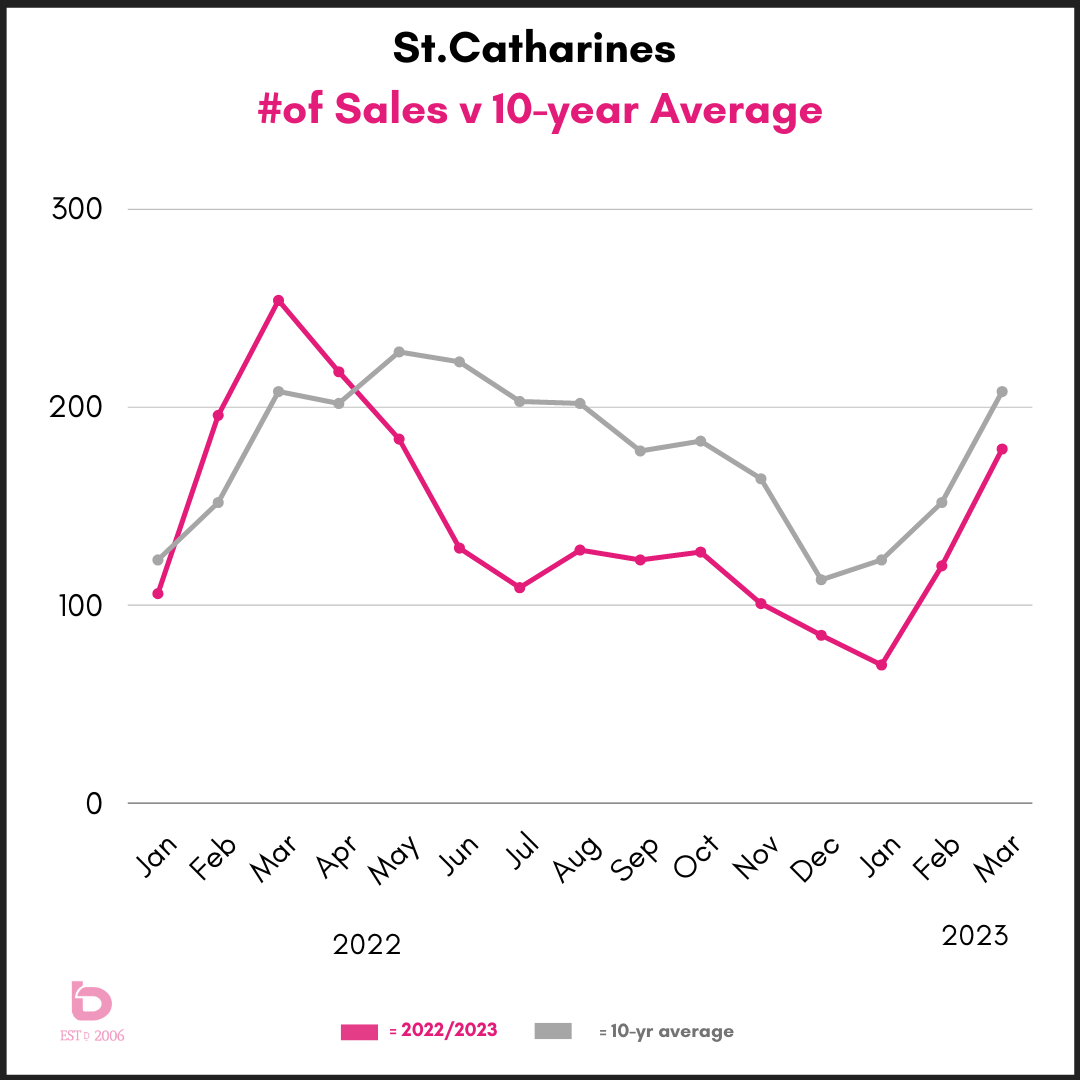
Similar to the Niagara Region, you'll see the same highs & lows in the number of monthly sales compared to the 10-year average. While still below, you can see the pink line (current market) is inching towards catching up with the grey (historical norms).
WHAT ABOUT MY CITY?
A few things. Niagara Falls and Welland (#2 and #3 respectively in the number of homes sold in Niagara) behaved fairly similarly to St.Catharines. In the interest of keeping this bite-sized, we only used St.Catharines as an example. If you'd like specific information for those cities, scroll down and reach out to us anytime.
The other cities with smaller monthly sales numbers produce very volatile data. With only 15 or 25 sales in a month, it doesn't take a lot to produce double digit percentage changes in either direction. Again, if you have questions specific to one of those cities, pelase don't hesitate to reach out.
SALE PRICES
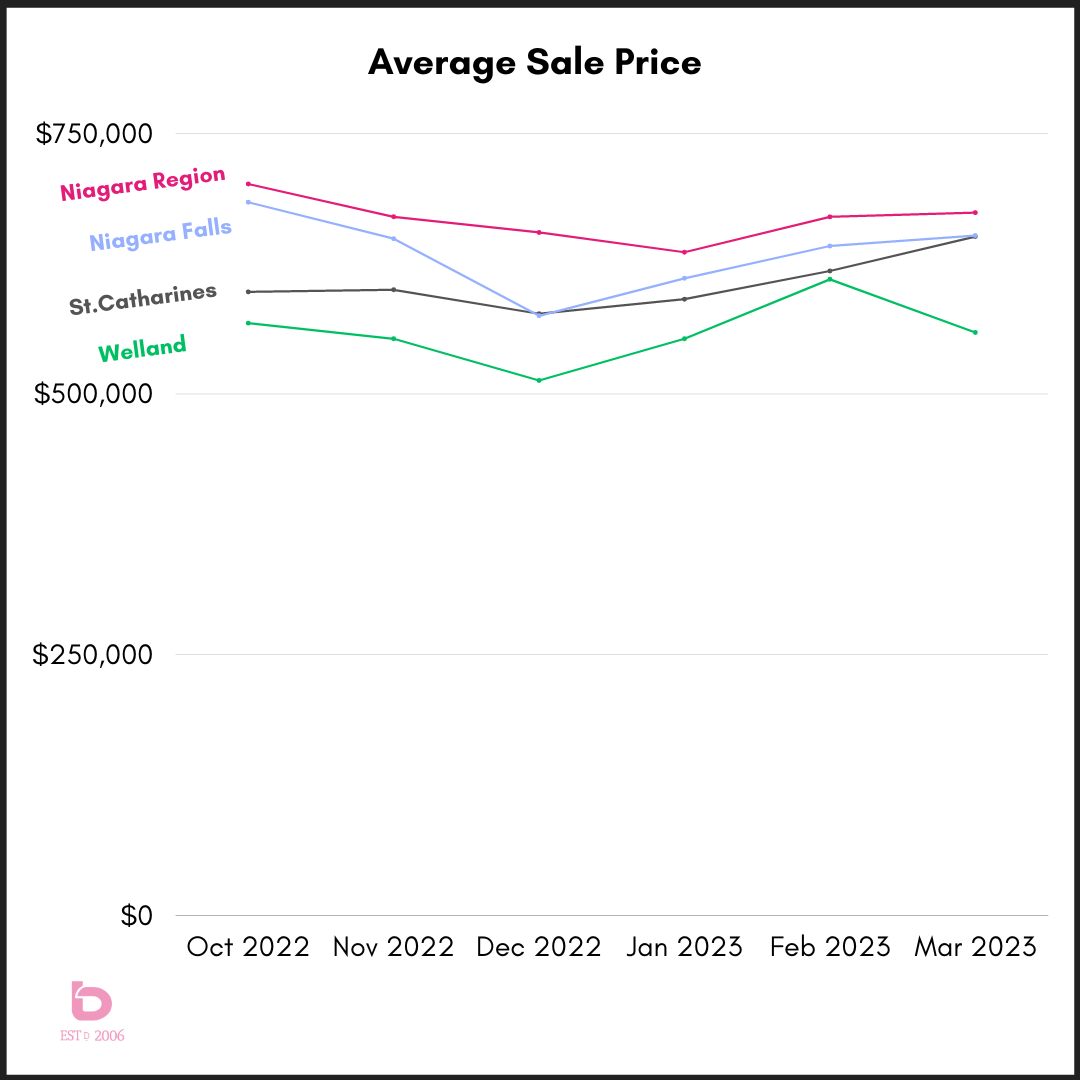
The price of Niagara real estate has tracked in direct relation to buyer demand mixed with how many homes are for sale. Maybe my high school economics teacher was onto something?
After prices took an absolute pummeling through the summer, we have seen a noticeable but gentle return of buyer interest. Largely its been a product of decreasing and increasing confidence.
With that, you'll see in the below graph that we appear to have been past the pricing low, at least as of now, with most markets sitting at bottom in either December 2022 or January 2023.
...and yes, this is only halfway through March so the ball game isn't over quite yet.
What about my city?
See above. Small market cities have monthly price averages that resemble an EKG monitor read out so homes in those areas are really best evaluated on a case by case basis. If you'd like help with that, reach out anytime. :)
STAY TUNED
The weekly and monthly movements of the market are interesting to watch at the moment so be sure to check back in with us to keep on top of it!
Would you like to discuss further?
