

What is happening in St.Catharines real estate these days?
One thing is clear is that the St.Catharines Real Estate Train continues to chug along at a torrid pace. The overall market dynamics of not enough supply mixing with strong sales volume started 6 months ago in September 2020. Since then, we have seen the impact of a heavy seller's market as the average sale prices continue to escalate.
Have a look at how those 6 months (September 2020 - February 2021) fare in comparison to the 10-year average for # of sales and # of new listings:
Number of Sales:
| # of Sales | 10-year average |
% difference 10-yr avg |
|
|
September 2020 |
238 | 171 | + 39% |
|
October 2020 |
251 | 169 | + 49% |
|
November 2020 |
201 | 160 | + 26% |
|
December 2020 |
145 | 105 | + 38% |
|
January 2021 |
142 | 117 | + 21% |
|
February 2021 |
177 | 147 | +21% |
Here is that same data for New Listings:
| # of Sales | 10-yr average |
% difference 10-yr avg |
|
| September 2020 | 339 | 275 |
+ 23% |
| October 2020 | 295 | 269 |
+ 9% |
| November 2020 | 180 | 210 |
- 14% |
| December 2020 | 99 | 116 |
- 15% |
| January 2021 | 165 | 216 |
- 24% |
| February 2021 | 200 | 225 |
- 11% |
How do we compare to the last 10 years?
Have a look at this next graph.
The horizontal line at 0 represents the 10 year average for both number of homes sold (Number of Sales) and number of new listings.
The grey line shows that the Number of Sales have been 20 - 50% above the 10 year average for their respective months. Meanwhile, the Number of New Listings dropped down to being consistently below the 10-year average for 4 straight months.
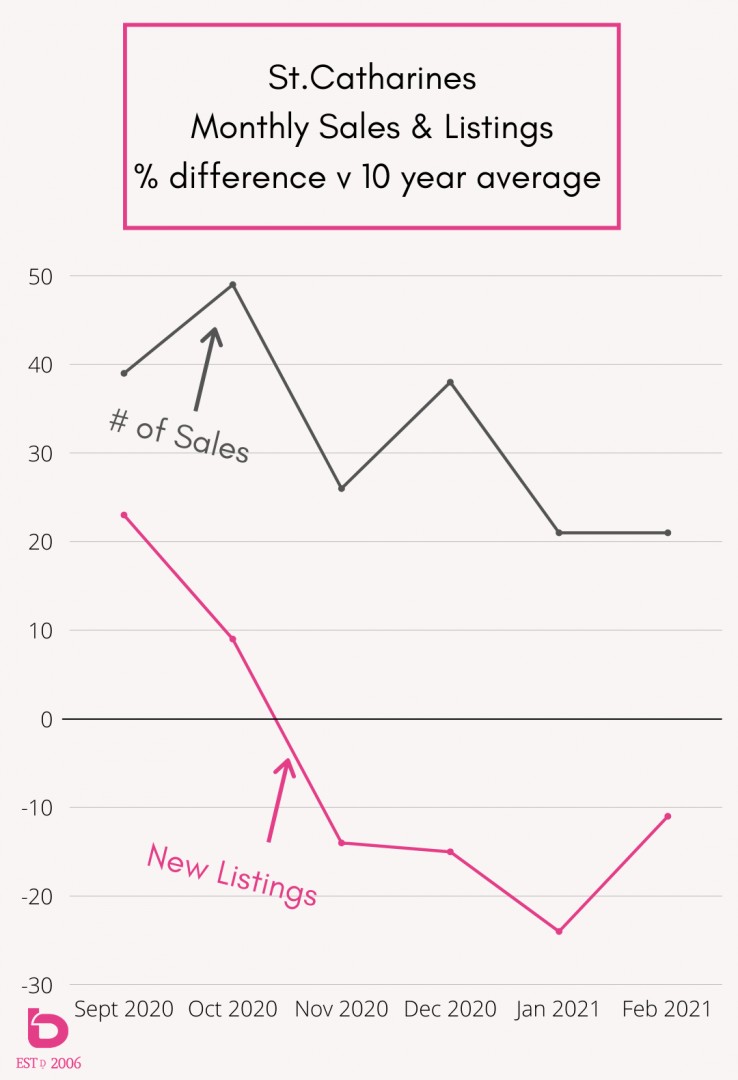
That disparity between low(er) supply and high demand has been at the core of the price escalation that we've experienced. Too many buyers, not enough product.
The Good News?
Here we are 9 days into March and the trends are actually giving us cause for hope. In fact, March 2021 is on pace for:
New Listings +20% above the 10-year average
Number of Sales +18% above the 10-year average
The Dance
That dance between supply and demand has been what has been driving our data. For example, have a look at this graph which shows the number monthly active listings in 2011 vs 2020.
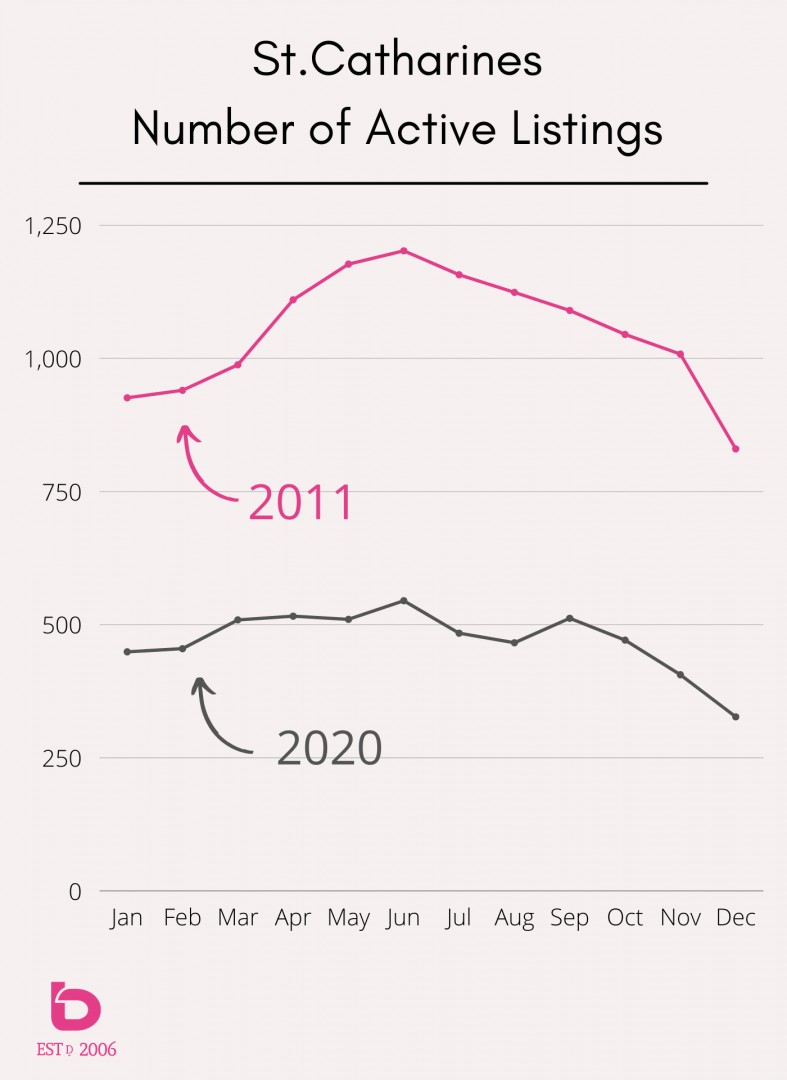
In a nutshell, buyers back in 2008 - 2015 had a lot more to choose from. What a difference a decade makes!
That difference in available homes for sale is really a byproduct of low new listing inventory mixed with high demand. That imbalance led to reduced days to on the market which are sitting at about 1/4 - 1/2 of what we saw back in the 2010 - 2015 markets.
The Antidote
So, what is the antidote to this crunched market? It is quite simply more listing inventory.
At this point, we’re hopeful to see the trend continue where the number of new listings gets back up into the 10 - 20% range above the 10-year average. That will hopefully provide more options for buyers and level off the escalating sales price average that we’ve been experiencing. How escalating?
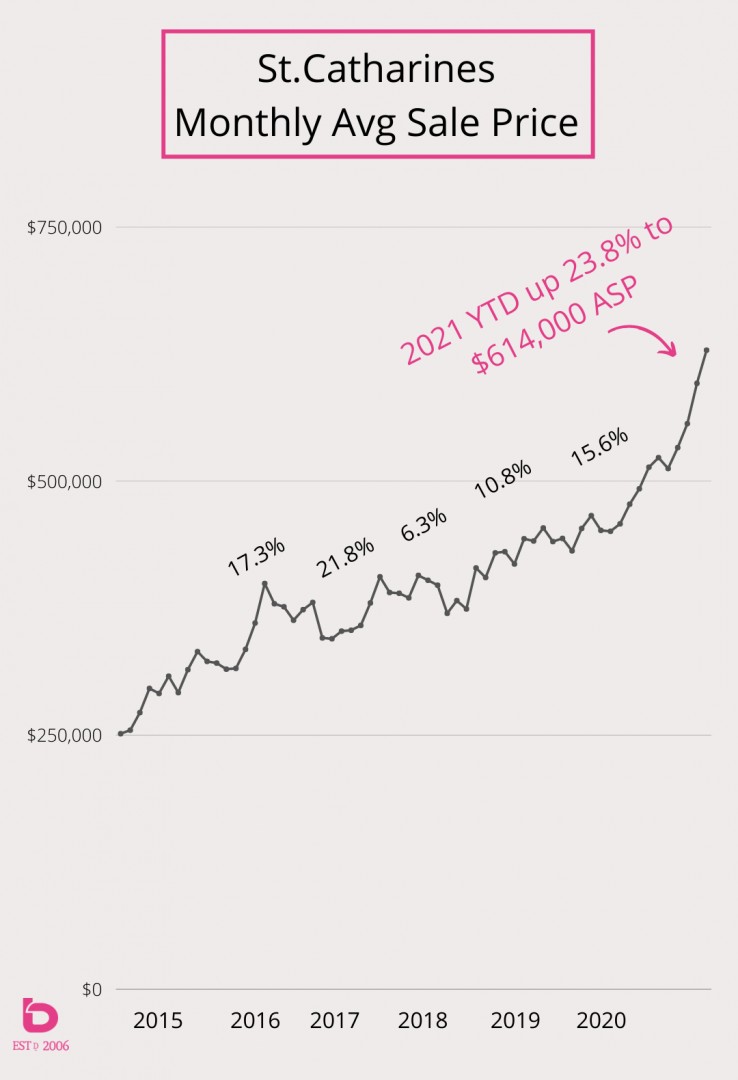
It's worth noting that for several years prior (2008 - 2014), the market experienced very modest annual gains (less than 3 or 4% annually) which has made the last 5 years that much more alarming.
For example, the average price of a home in St.Catharines has doubled from $299,000 in 2016 to the low $600s here in March 2021.
Where does the market go from here?
It depends on the area and the price category or segment. Our expectation is we’ll see new supply start to have an impact on certain price segments of the market while other segments will continue on their fierce pace through the spring market. For example, the $350 - 500,000 bracket will maintain its intensity while the upper-end may start to ease somewhat.
Here is an example of the speed of the market depending on the price point when looking back over the past 6 months.
In general, anything under $800,000 is competitive with days on the market ranging between 15 - 25 days. As you get up into the $800+ range, you'll see time on market start to edge up towards the 2 month range.
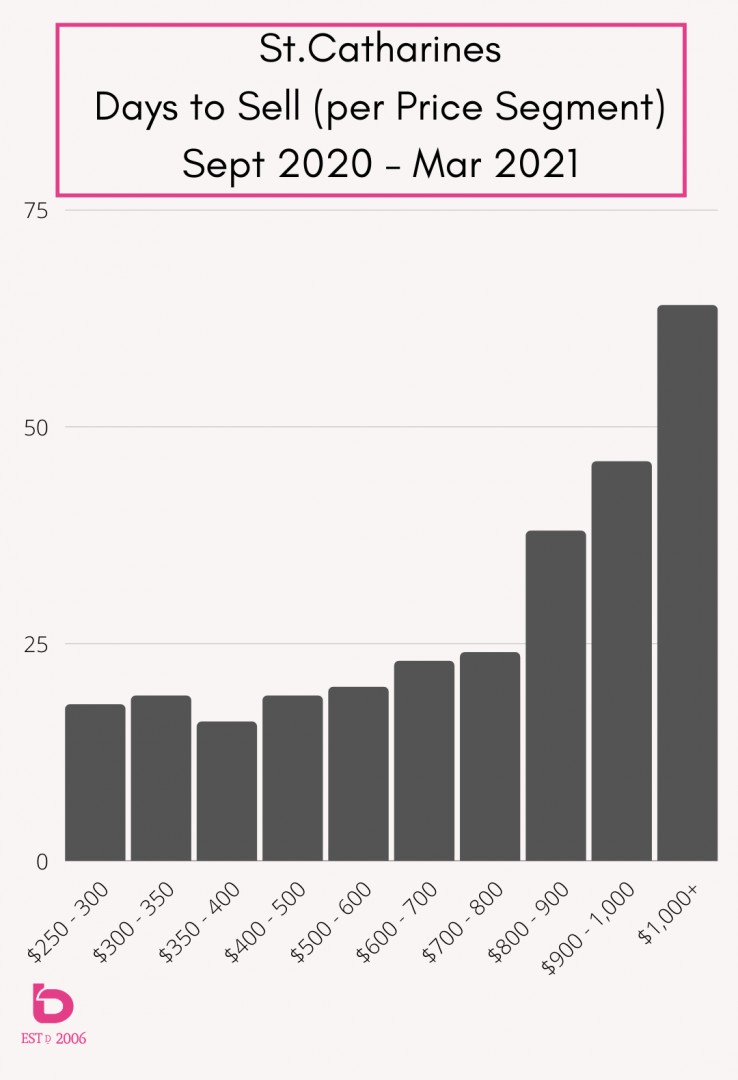
Again, it's worth noting that back in the 2008 - 2014 markets, the average days on the market was up in the 2 months range on average, so more than double where we are today.
There is one thing you can count on. We will continue to track the data and keep you updated with any new trends.
Questions on your neighbourhood or area of Niagara? Reach out anytime. We are happy to chat and answer any questions that you may have.
Prefer the Video Version? We've got you covered. :)