

Everything You Need to Know About The Niagara Real Estate Market
If there is one thing you can count on in the (Niagara) real estate market in the past several years is that you can’t really count on anything. Afterall, we’ve had record highs followed by record lows with swings in all directions in between.
As a result of that volatility, it is increasingly difficult to summarize the entire market in a simple blog or article. Challenge accepted! We have assembled what we feel are the more important aspects of the market. We hope you find it helpful.
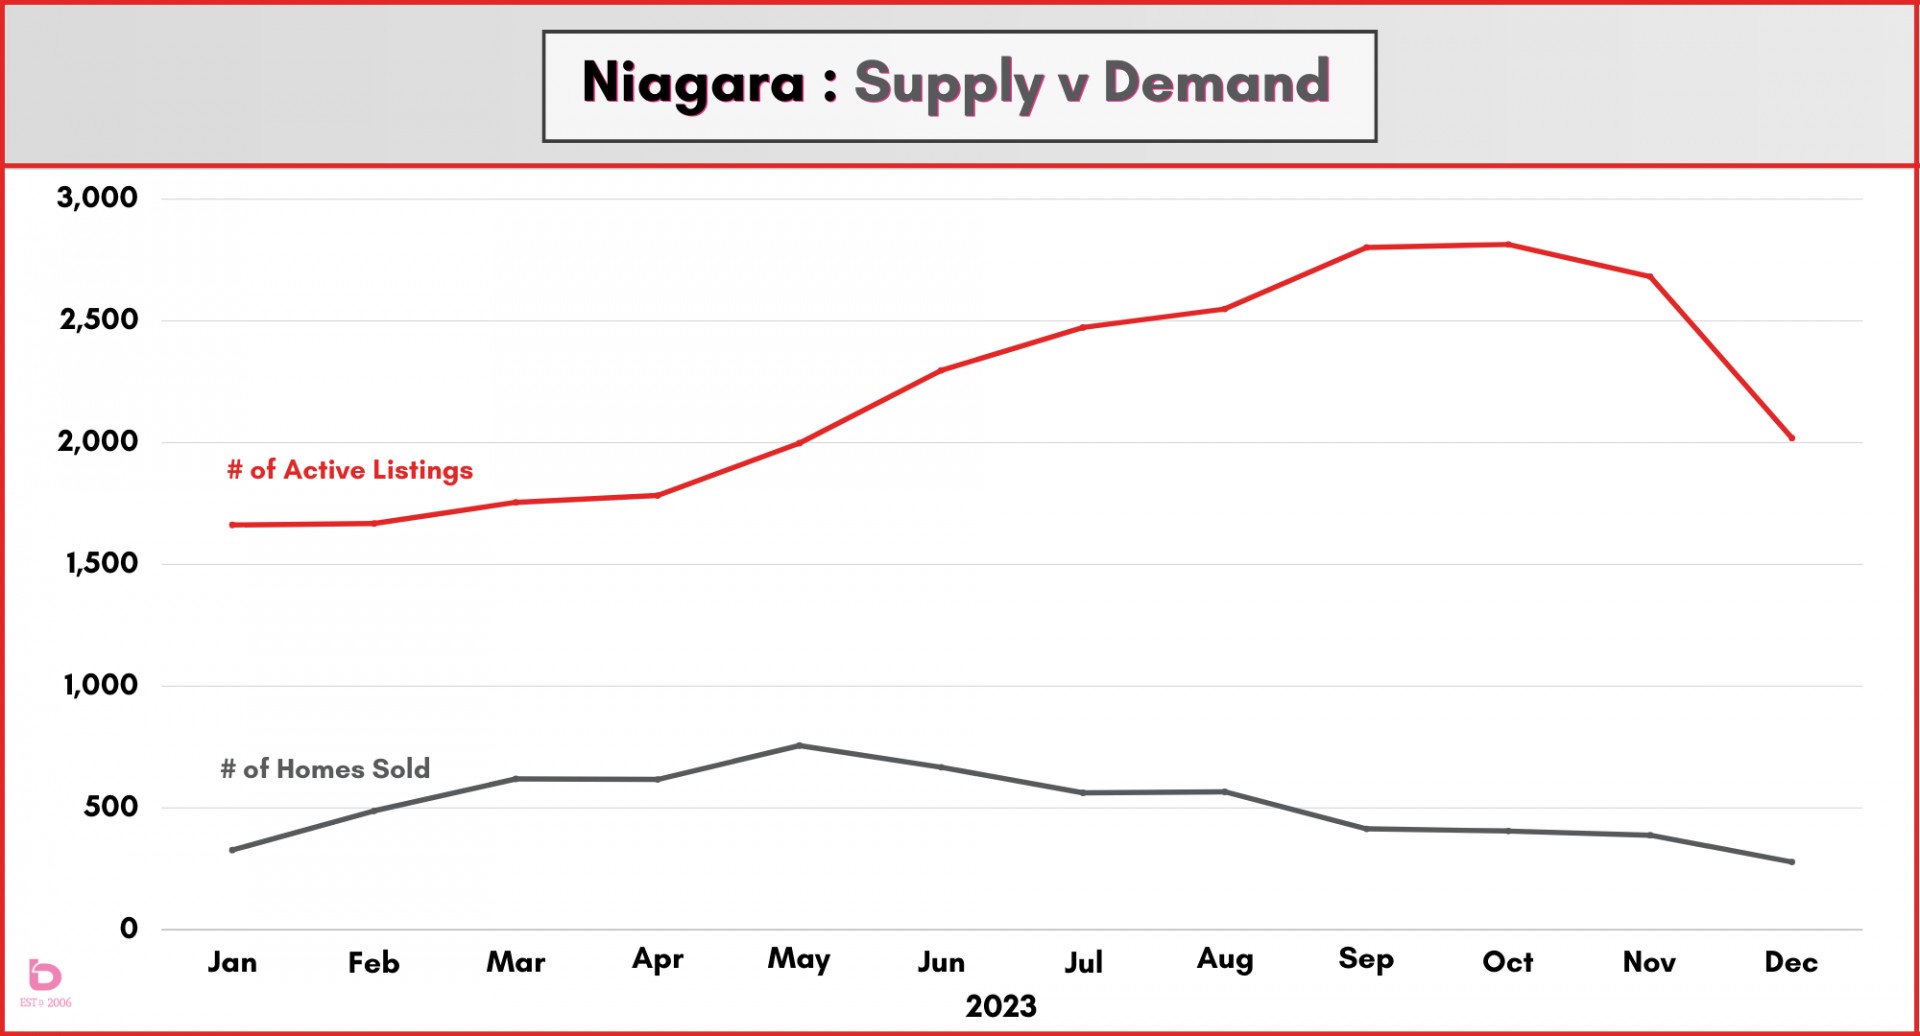
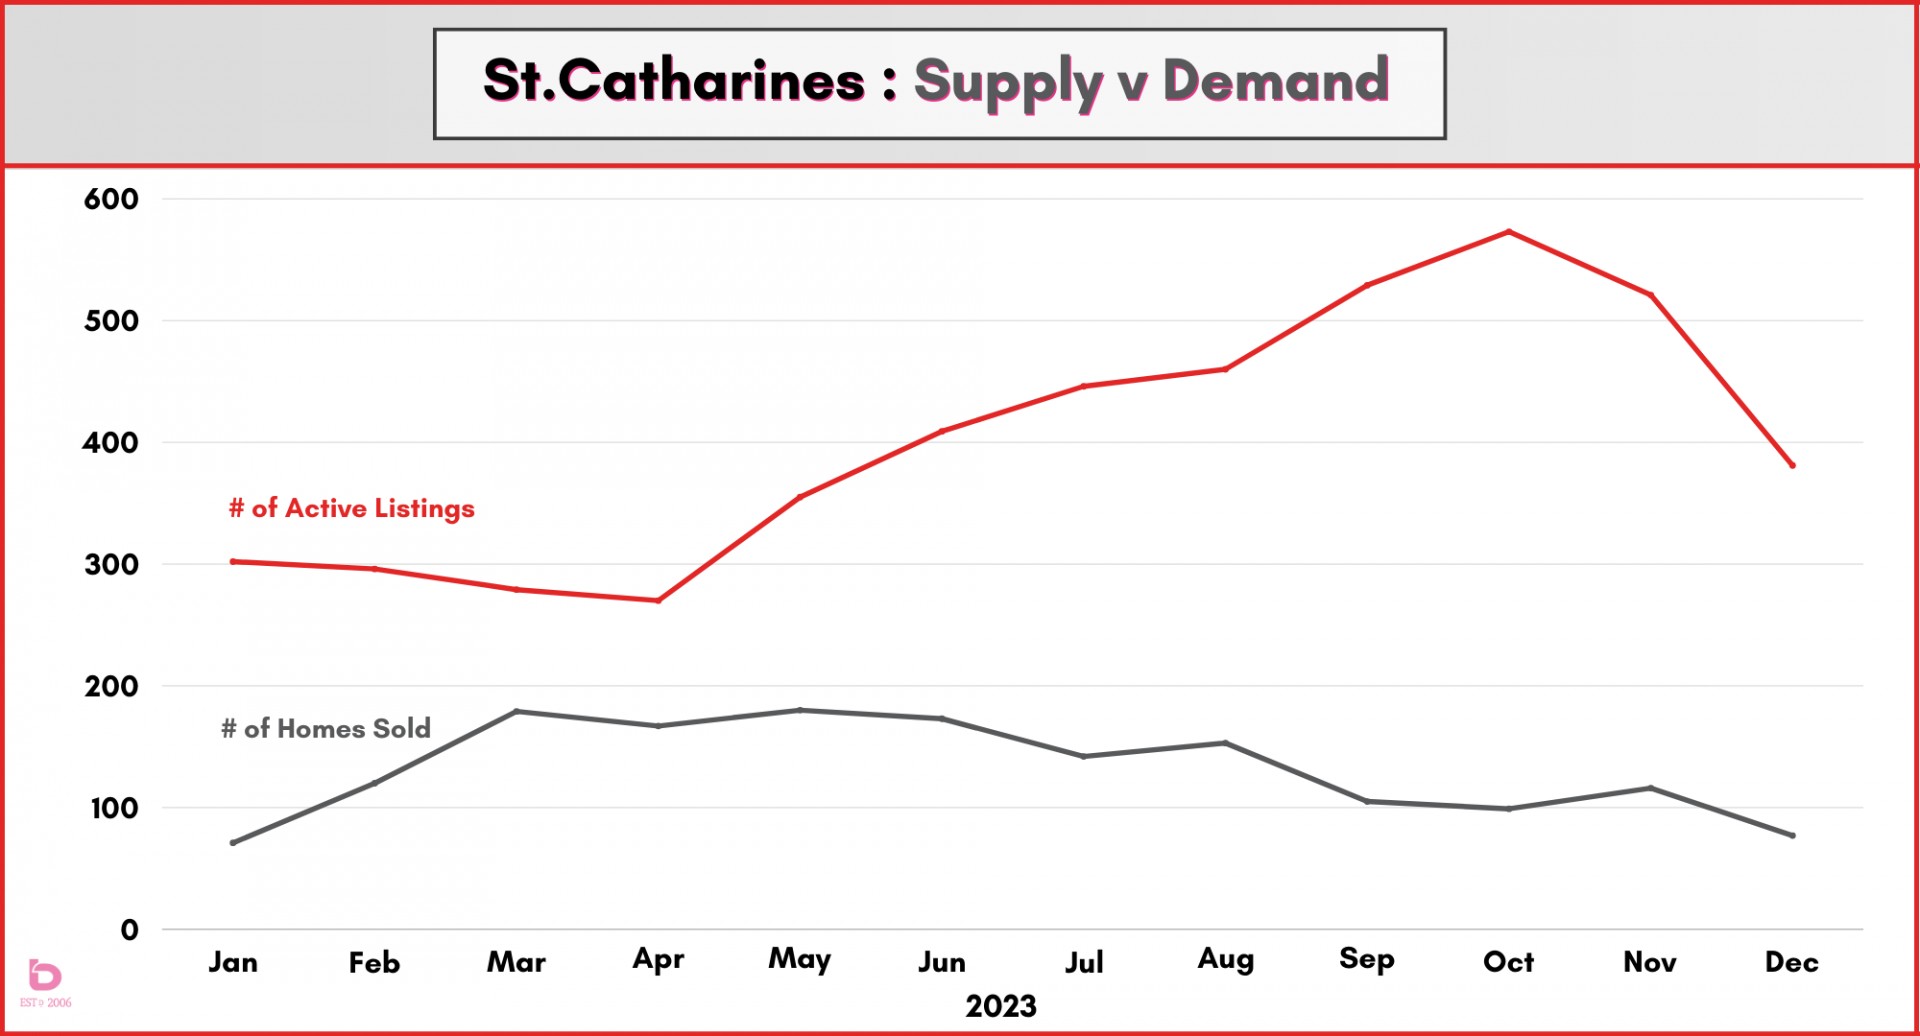
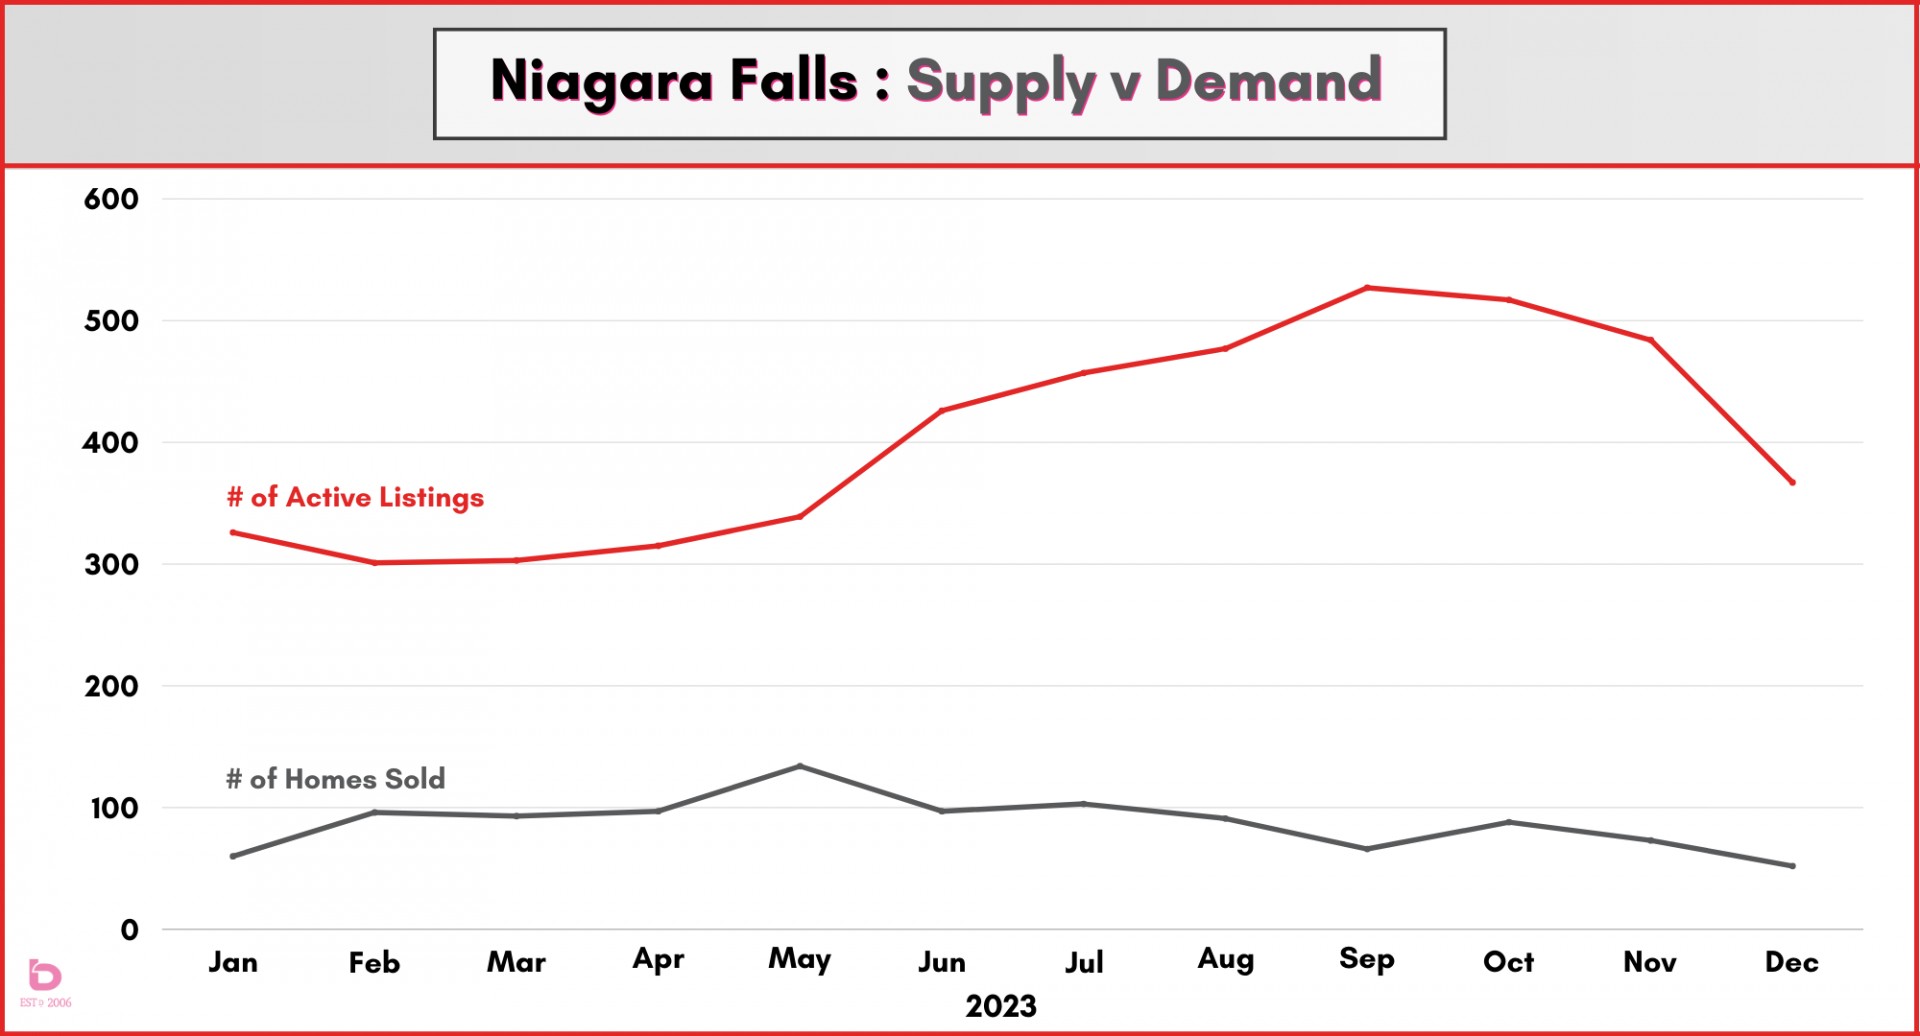
Supply & Demand
The number of homes for sale and the demand to buy those homes are inextricably connected. In a sentence, 2023 saw growing listing inventory while the demand to purchase those homes declined. The result?
- The highest number of active listings since 2014.
- The lowest number of annual sales ever.
These graphs show the supply of active listings compared to sales for 2023. Note the trajectory of sales through the spring market, which was reversed in the summer months when rates were increased. The widening gap between listings and sales was felt in the average sale price trend (keep reading).
How was 2023 compared to previous years?
This graph shows you how sales in 2023 managed in comparison to the 10-year average. It’s worth noting that while 2023 underperformed, it still followed the same monthly trajectory as the 10-year average.
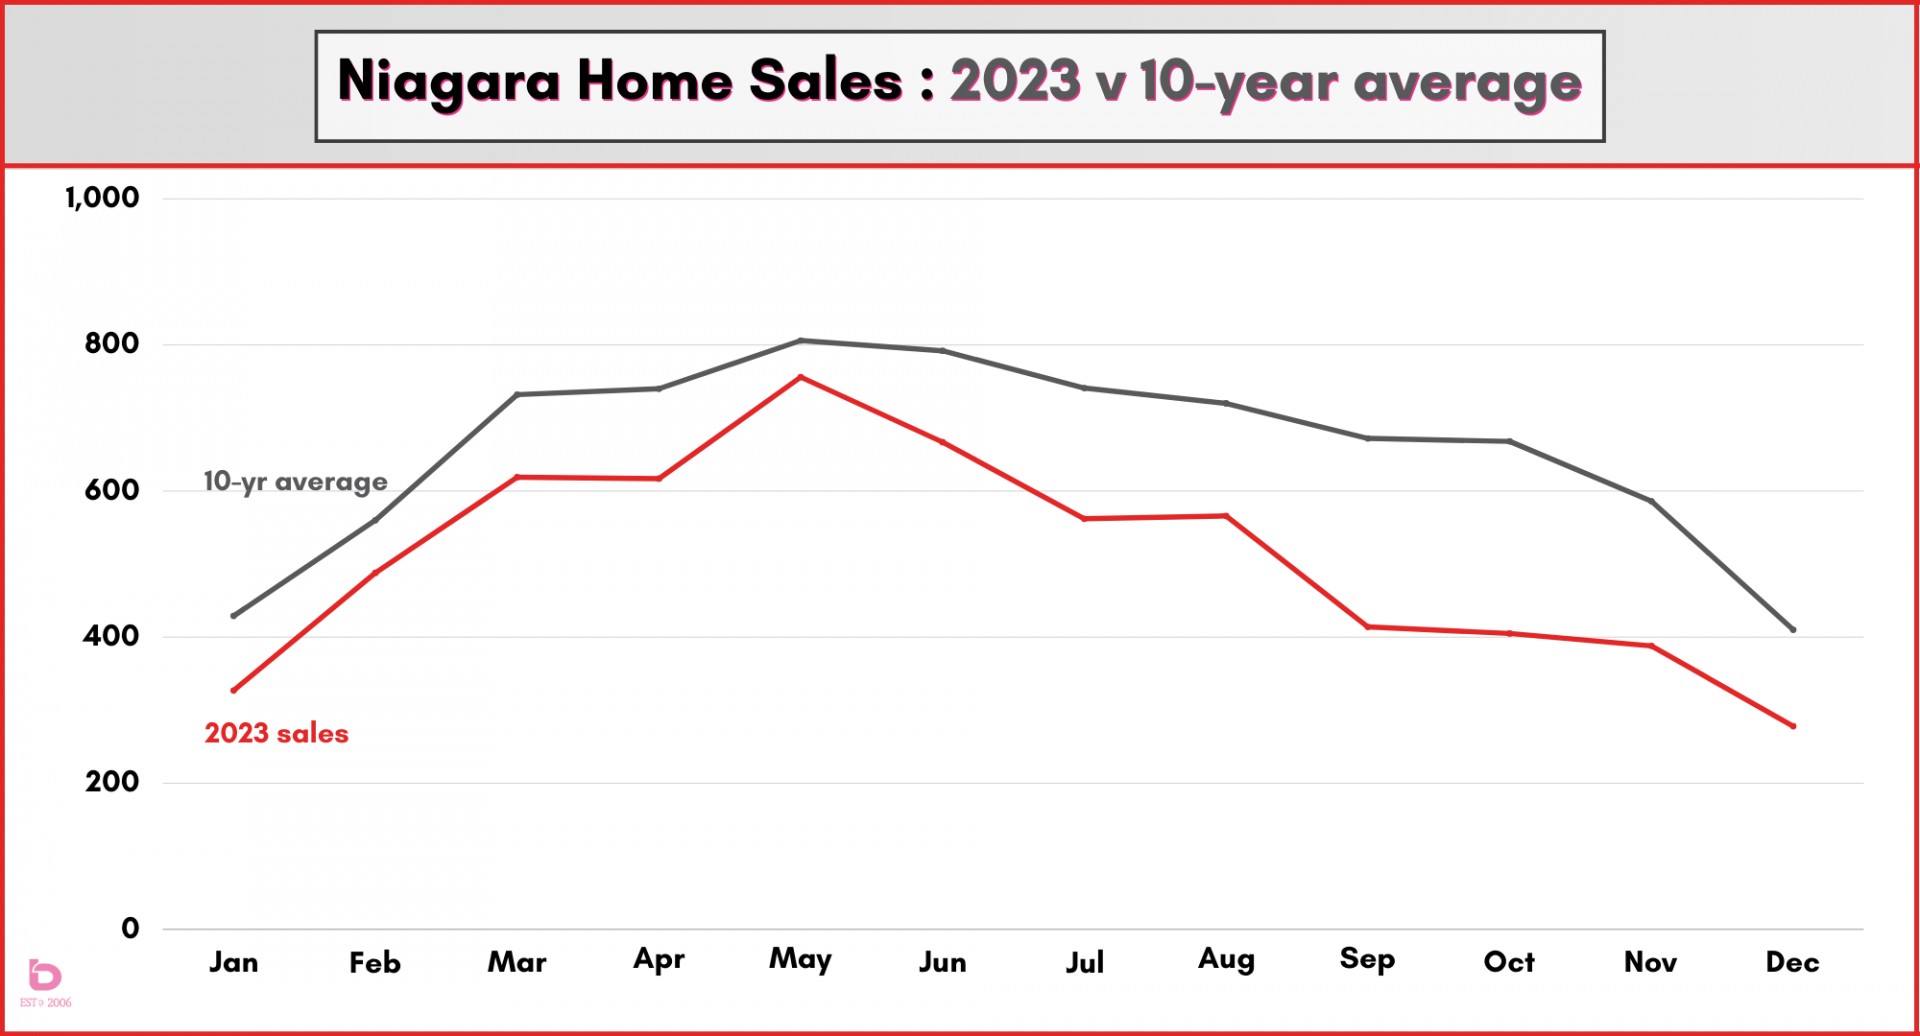
So, yes, that is what a record low year looks like when it comes to home sales. How did that impact pricing?
Pricing Trends
How much is my home worth? That’s really what most people want to know. Well, making sense of home price trends has been about as simple as catching jello. You can try but it’s probably going to get messy.
For example, 2022 really was a year of two distinct halves. The first half sale price averaged $840,000 while the second half averaged $695,000. That’s a discrepancy unlike anything we’ve seen before. As a result, when comparing 2023 to 2022, it appears worse than it was.
First, here is a simple look at the average and benchmark price for 2023.
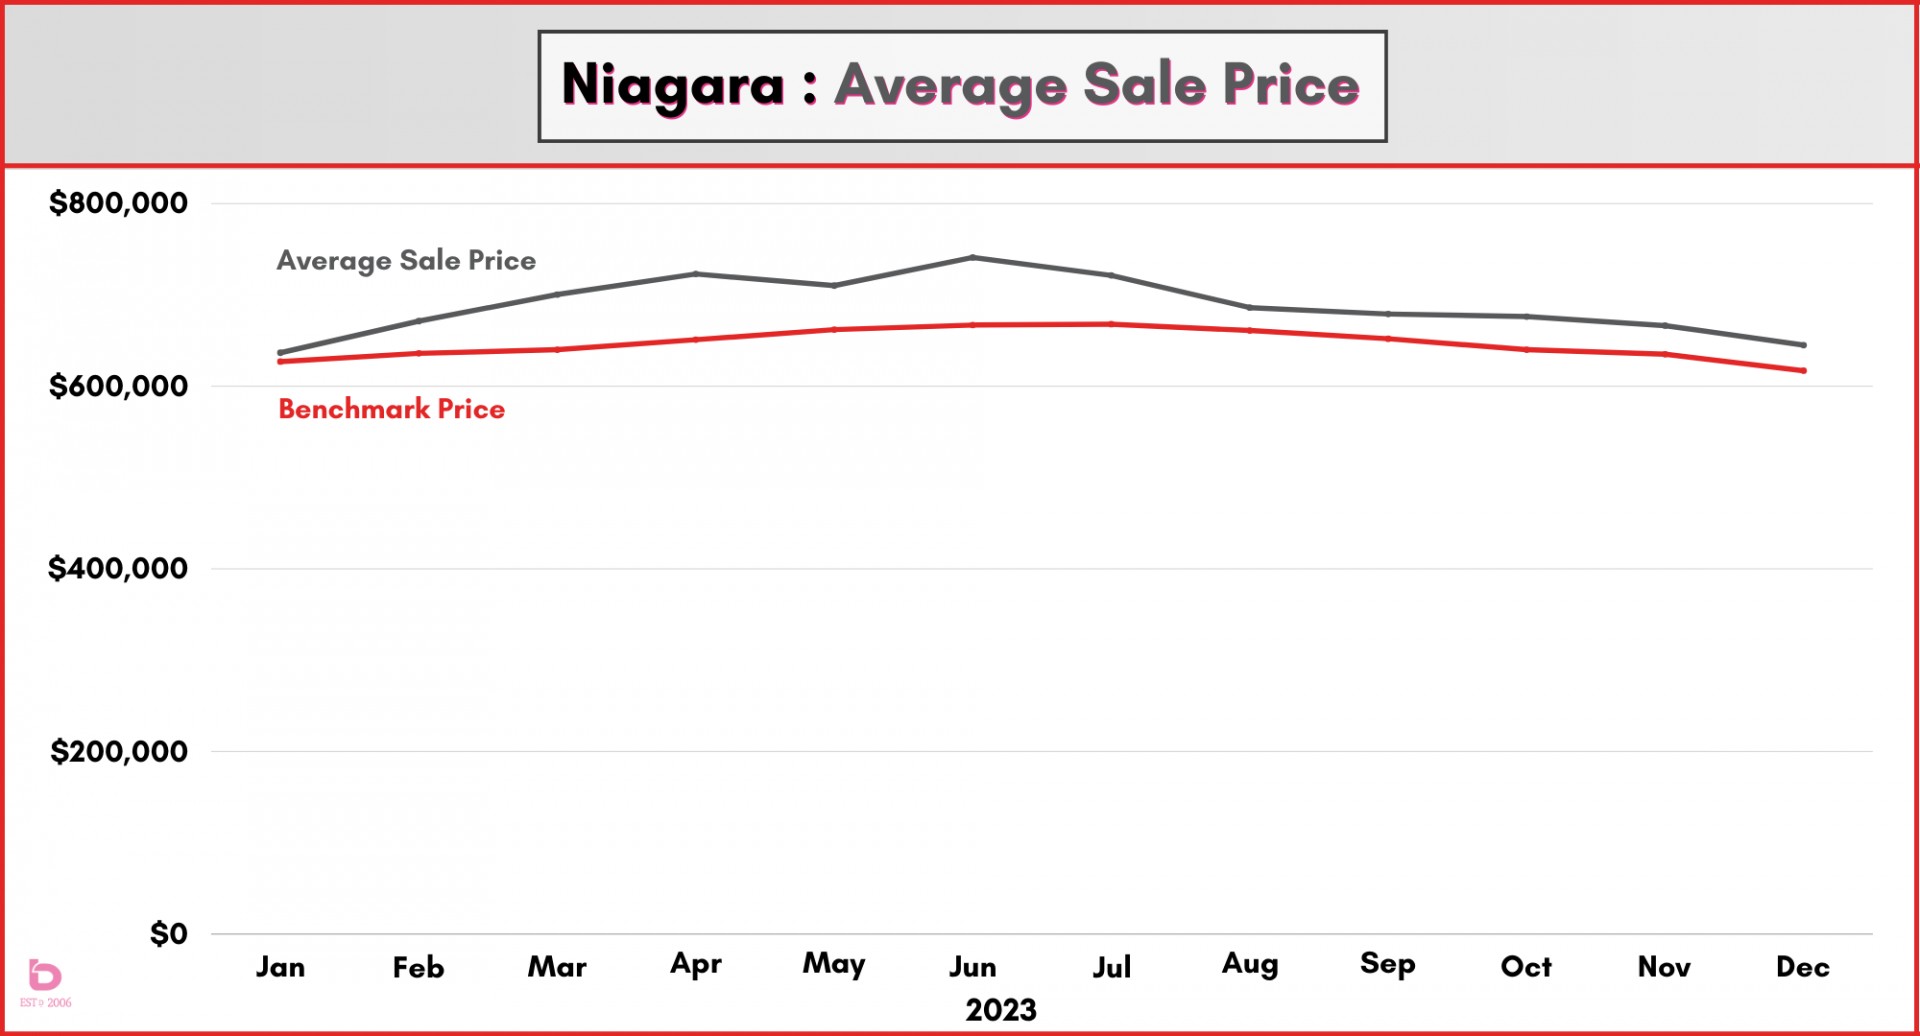
The supply and demand started to improve early in the year which resulted in a slow climb in average and benchmark pricing, followed by a quick retreat once the Bank of Canada raised rates again in June and July.
How did interest rates impact pricing?
This graph looks at average sale prices for 2022 and 2023, with interest rate increases noted in the vertical rectangles. Note that the only sustained increase was between January and June 2023, a time when the bank paused the rate increases.
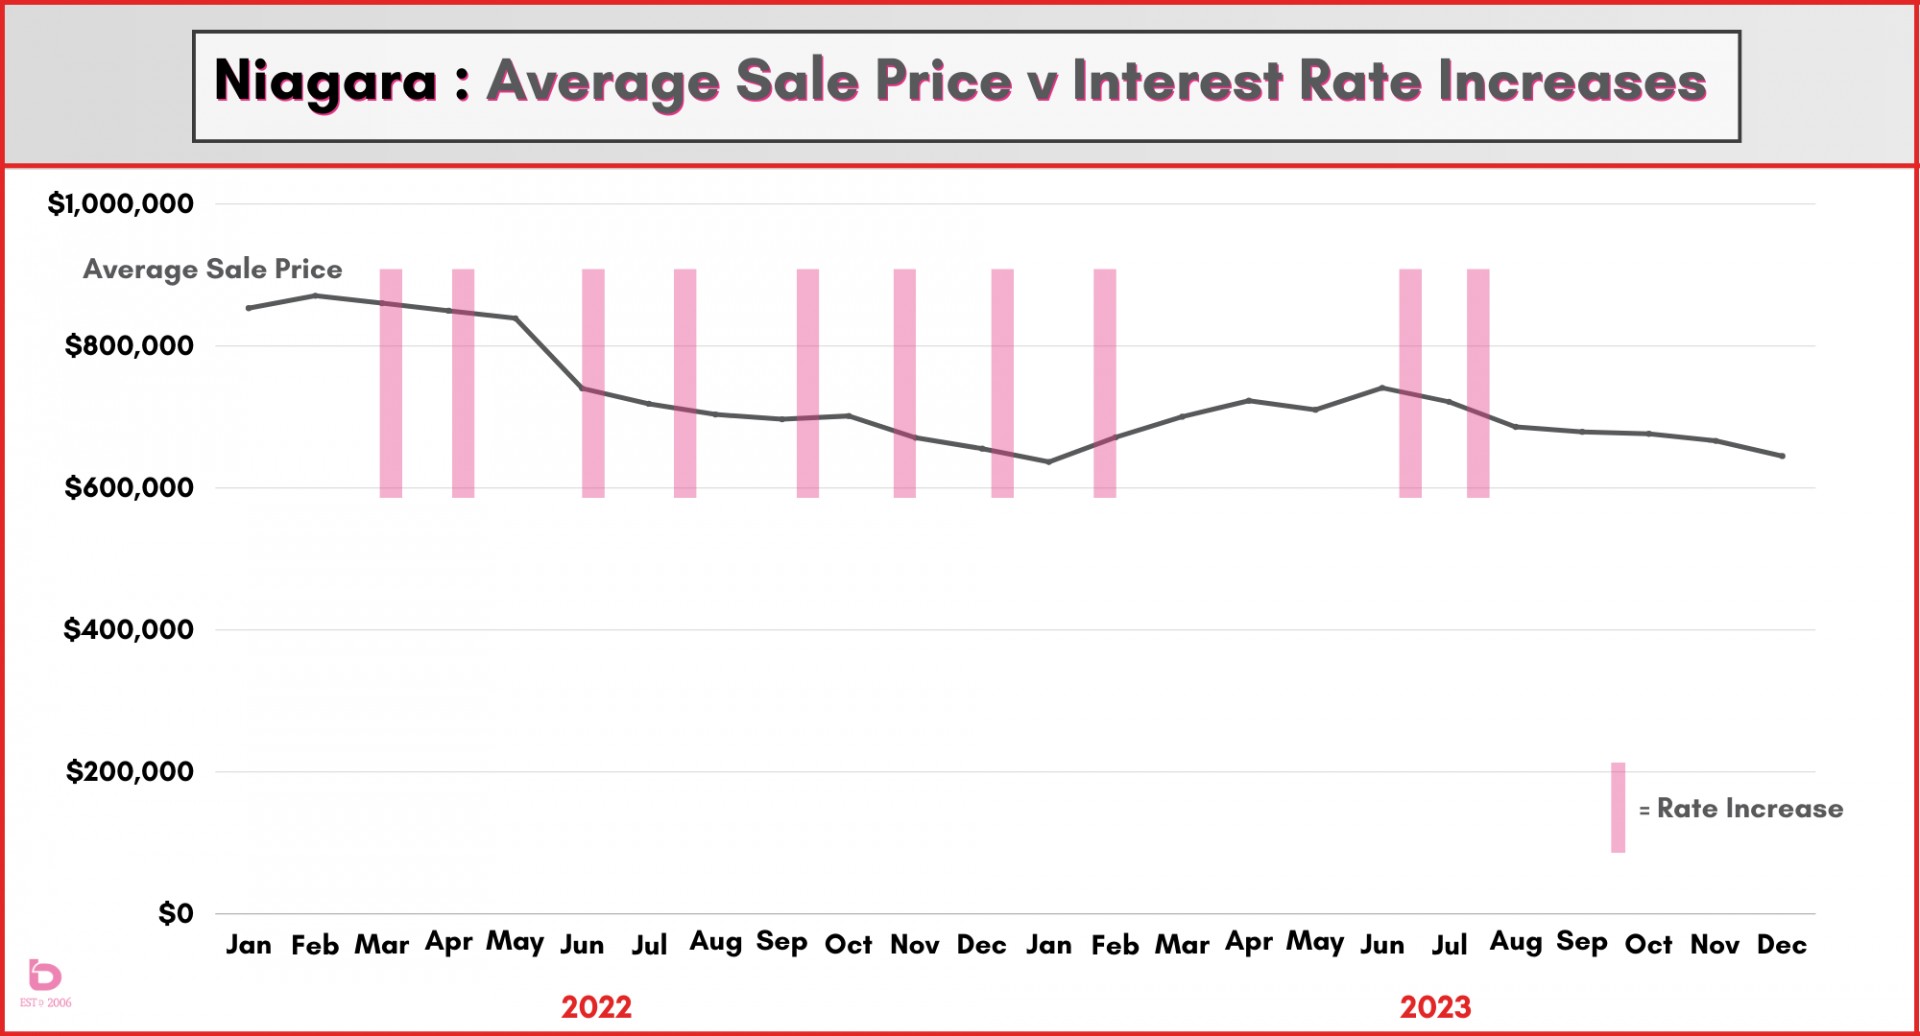
Again, as previously mentioned, the 2nd half of 2022 had an average sale price of $695,000 while the first half was nearly $850,000. The beginning of 2022 skewed the total data though, resulting in 2023 annual being down nearly 12% from 2022 annual, despite the fact that the last half of 2022 was equal to 2023.
And here is a (not overly) fun fact: 2023 is the first year with a negative percentage year/year for annual average sale price since the Toronto Blue Jays won the World Series. For you baseball fans, you'll know how significant that factoid is.
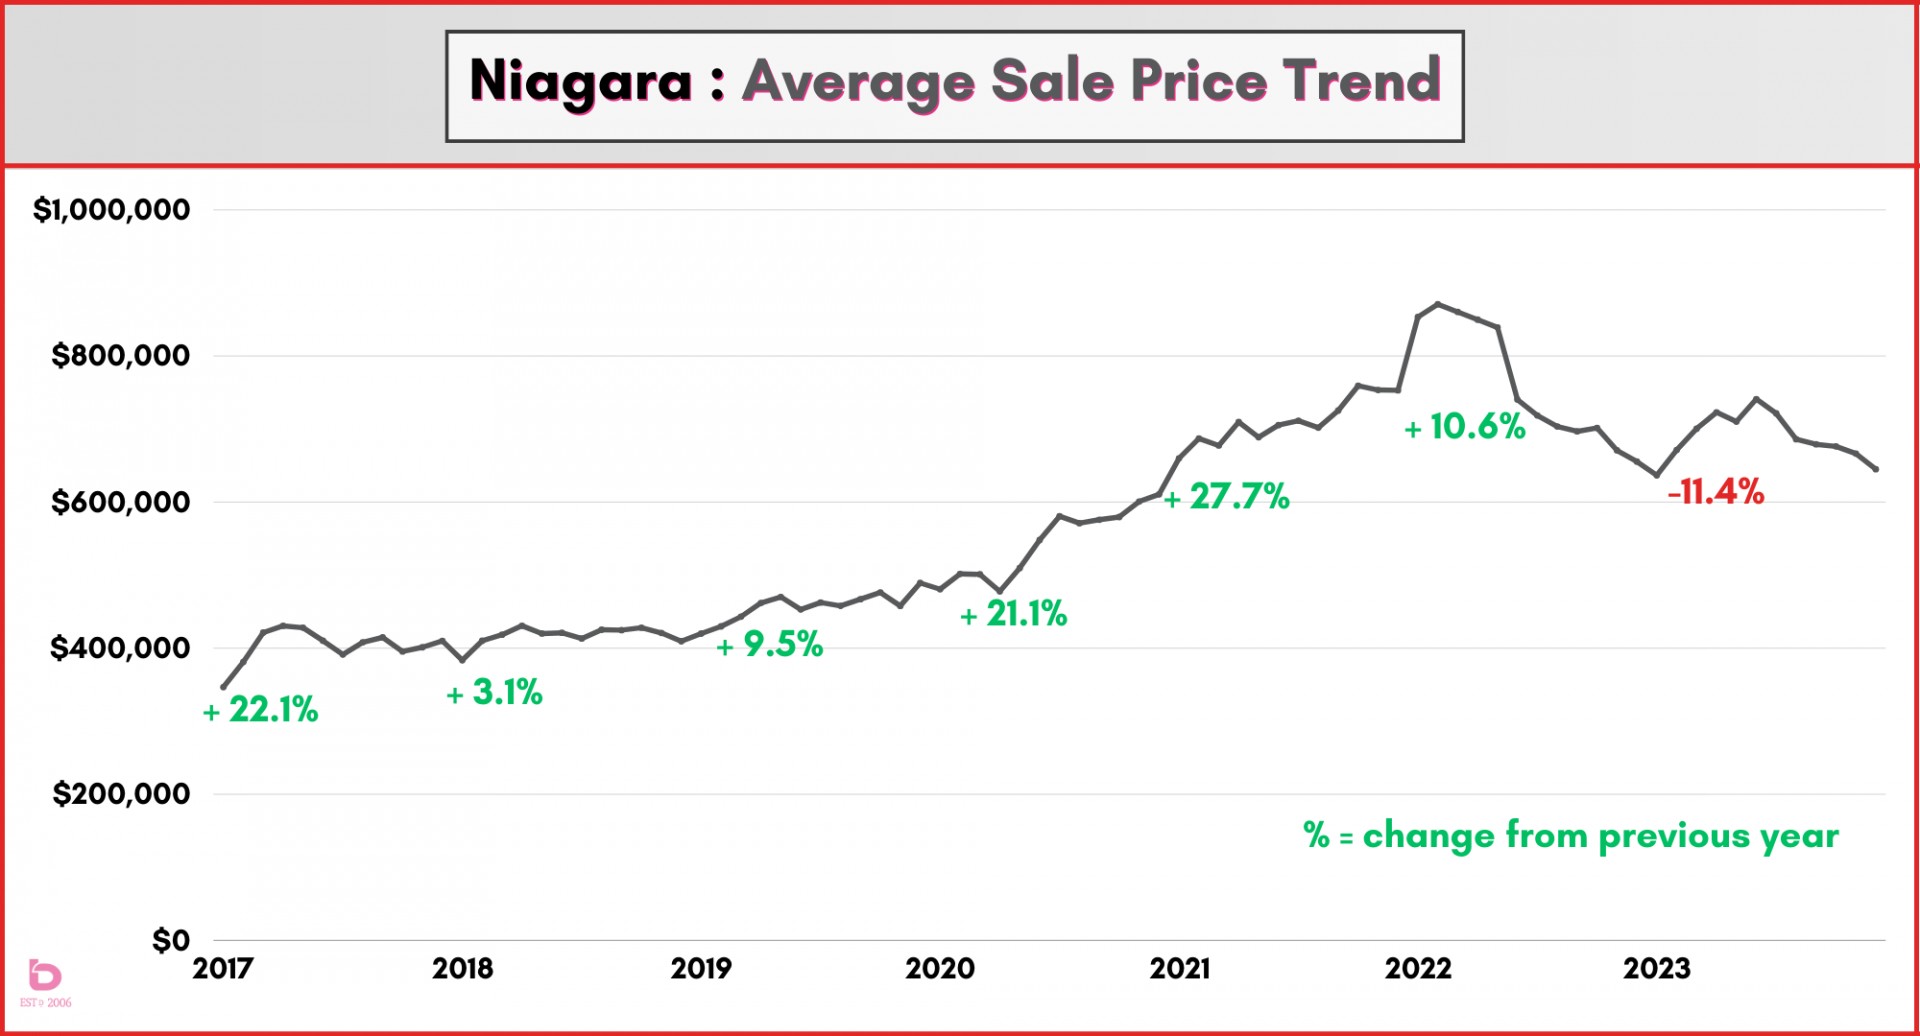
Let’s zoom out a bit.
The relevance of current market conditions is only relevant to your particular scenario so keep that in mind when seeing the next graph. Are you looking to buy and sell? When did you purchase your current home? What are current market conditions related to your specific property?
This graph shows the average sale price trend over the past 7 years with the annual year/year percentage noted in green (or red) font. It further confirms the wild ride that the last few years were.
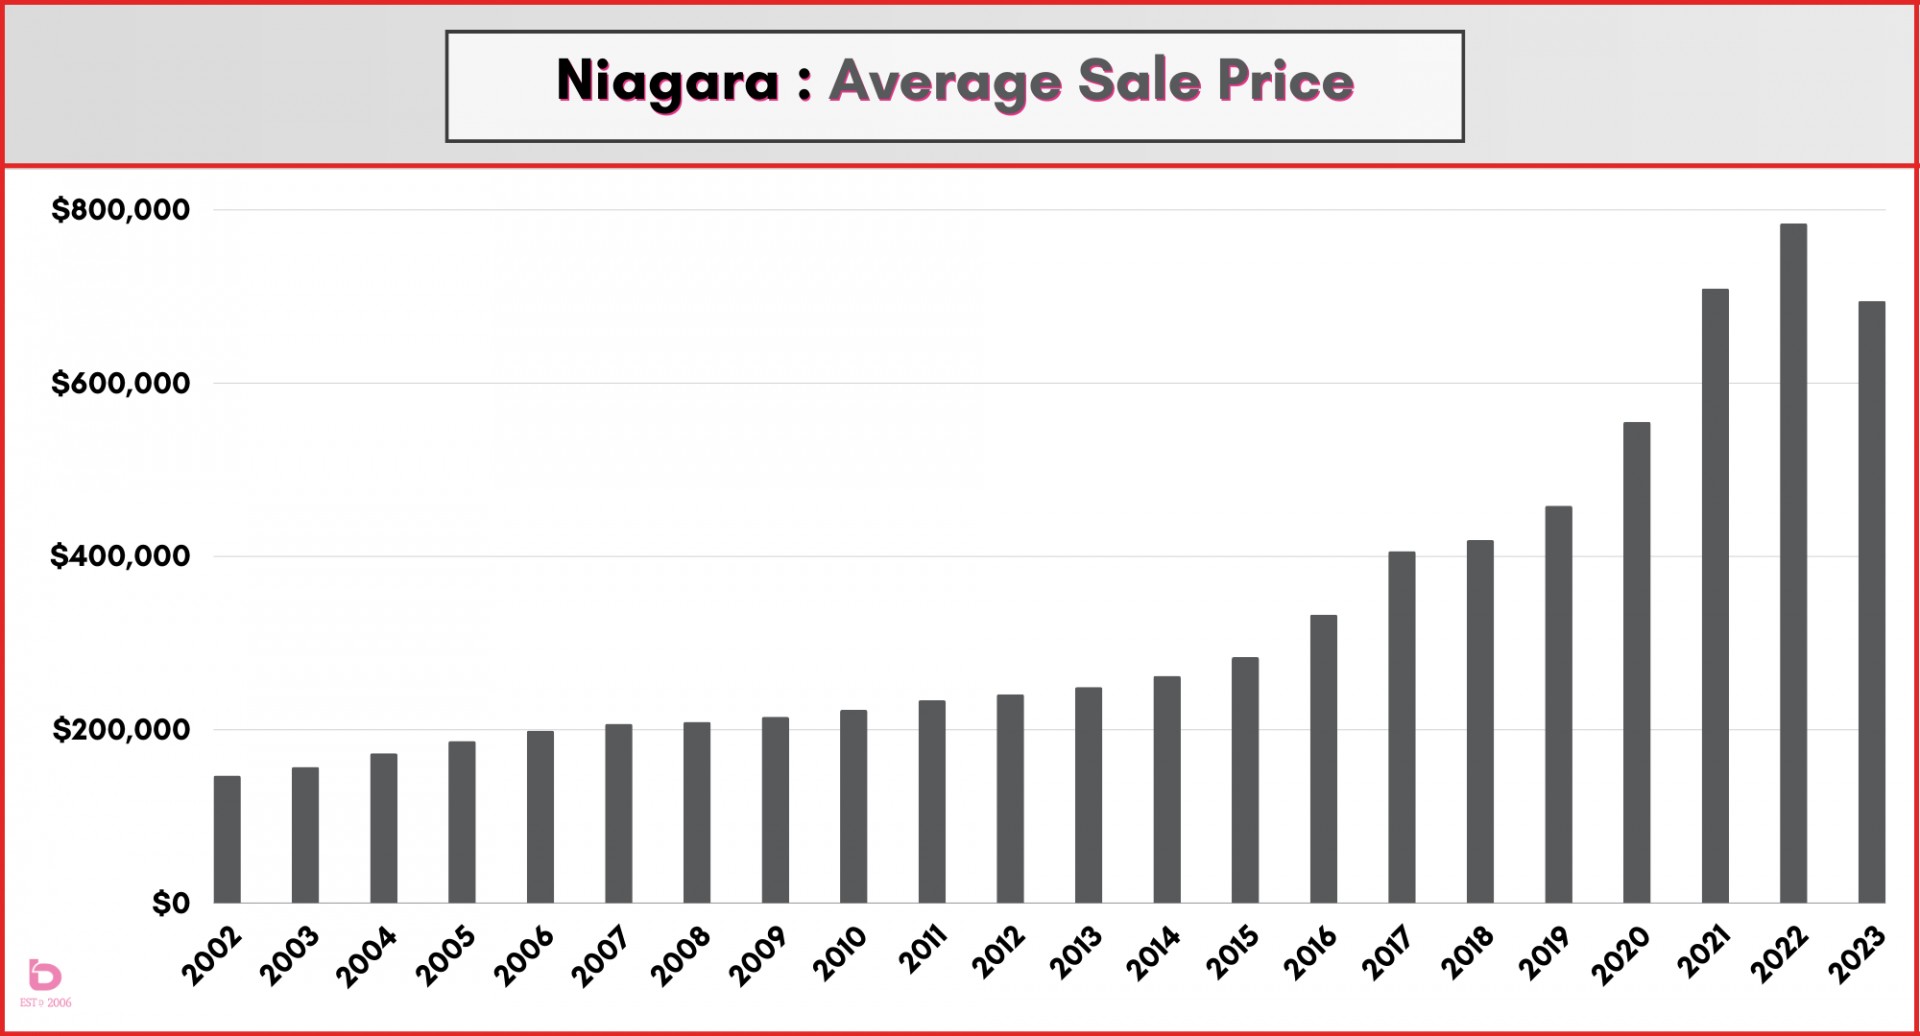
Zooming out further, this graph shows you the annual average sale price for Niagara going back to 2002. To confirm, yes, things have changed.
What happens when buyers pull back as listings pile up?
Imagine a bakery in a town of gluten intolerant people. The shelves become overloaded with stale bread and to a large extent, that is what happened in the Niagara real estate market.
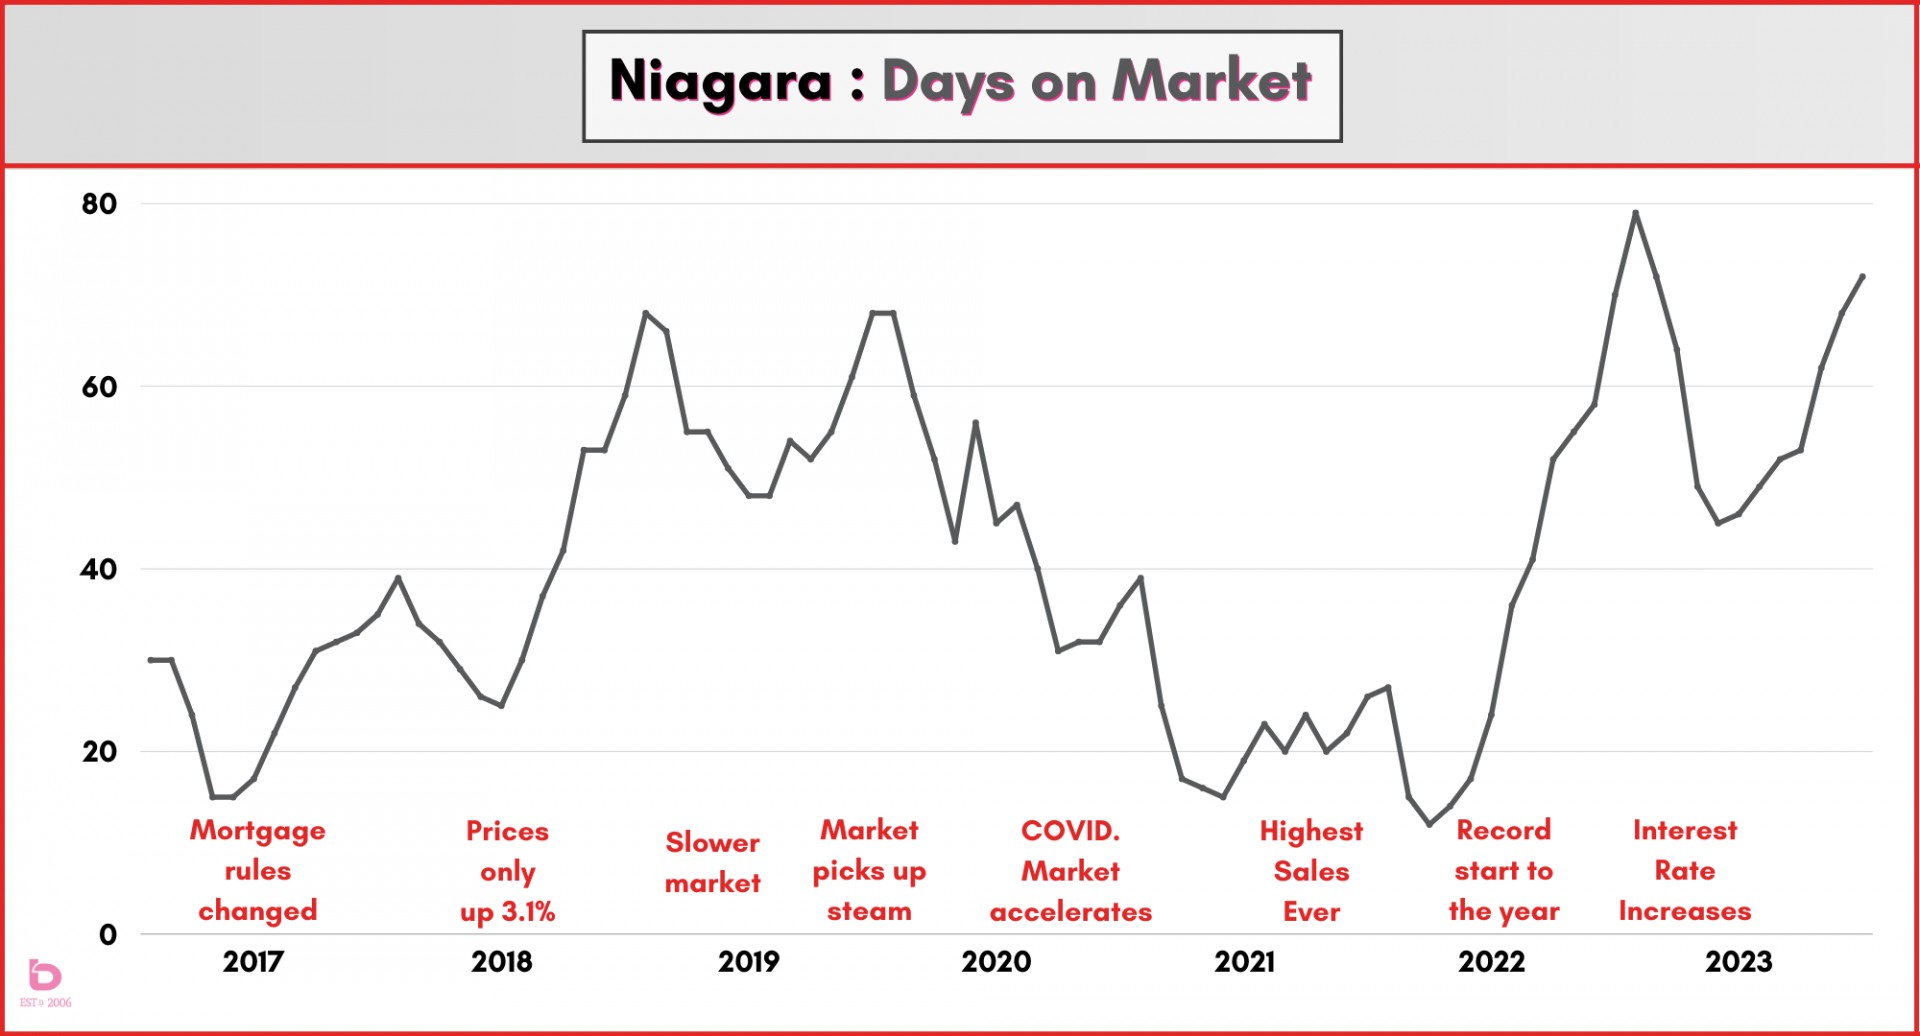
You probably noticed a For Sale on your drive home that just sat there for weeks or months on end. When days on the market move from 20 to 40 to 70, well, that’s what happens.
This graph puts the current market into some perspective, comparing 2023 to the previous 6 years. Each year was somewhat (or a lot) different from the next (see notes).
2023 in a nutshell…
Market confidence started to improve to start the year.
Bank of Canada raised rates .25% in June & July.
Market confidence took a few steps back.
Active listings piled up to record highs.
Sales pulled back to record lows.
Prices pulled back (plenty of variables there).
The year limped to the finish line.
Looking forward to 2024…
Market confidence will improve as we move into spring.
The Bank of Canada will hold rates and (hopefully ease them back a bit in May – July.)
Active listings will be at reasonable levels.
Sales will return towards normal levels.
Prices will slowly improve.
The year will stroll to the finish line with a hint of a smile on its face.
In a market like this, it is imperative that you are getting timely and relevant advice. Want to chat?
And please note, these blogs are really just our forecast, also known as our best guess(es). Please make sure you are clear before making any next steps based on the above info.