HOW IS THE NIAGARA REAL ESTATE MARKET?
To cut to the chase, the wild real estate roller coaster ride continues. Over the past five years, the market has taken several twists and turns, thanks in large part to a wide variety of global events.
2020 was defined by the COVID pandemic, which caused a massive bottleneck followed by an explosion in buyer demand and market activity.
2021 was fueled by near-free mortgage money, resulting in the highest number of annual sales ever recorded.
2022 carried the momentum of the previous years even higher in the first three months, only to be absolutely knocked out by the Bank of Canada, which raised the overnight rate from 0.25% to 4.25% by year’s end.
2023 saw the overnight rate climb even higher to 5%, which further reduced demand and produced the lowest annual sales on record.
2024 was timid but showed signs of courage, as monthly sales showed signs of life, with Q4 sitting only 11% below the 10-year average. Compared to previous quarters, that was a positive sign.
Which brings us to 2025.
The quick story is that the U.S. election created massive uncertainty, causing a supply-and-demand imbalance that continues to this day. Here are the main points:
THE NUMBER OF HOMES FOR SALE
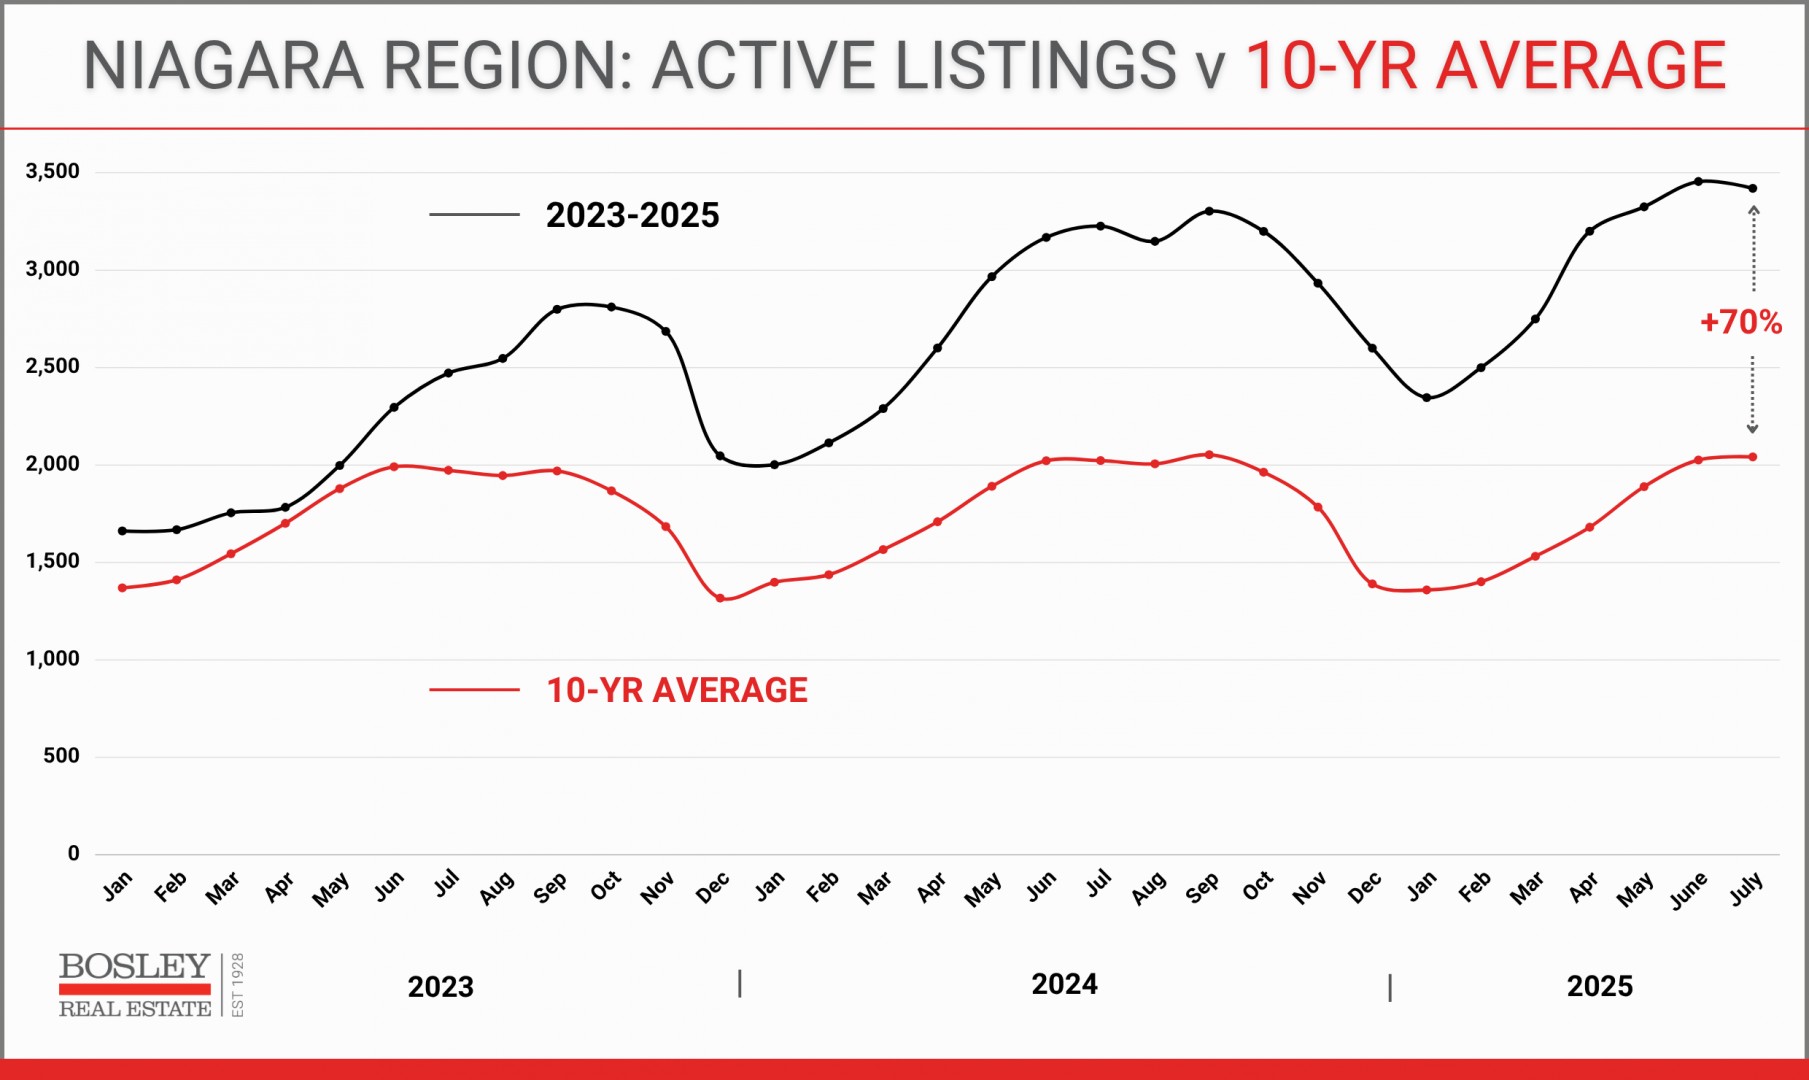
Every month in 2025 has set a record high for the number of homes for sale.
This chart shows the 10-year average (in red) compared to the previous few years (in black). That gap has ranged between 69 and 106%, meaning that each month this year, as well as much of 2024, has run at historically high levels of supply.

What does that mean? In general, elevated supply comes from a combination of:
- Reluctant buyers, many waiting to see what happens next.
- Buyers who need to sell first, freezing the market as dominos wait to fall.
- Stubborn sellers who insist on asking price the market doesn’t support. Reasons vary: stubbornness, being poorly informed, or being financially stretched based on when they purchased.
We will continue to see a slow market with stagnant pricing until that level of available inventory gets within range of normal levels.
HOME SALES
Monthly home sales, otherwise known as buyer demand, have been a tale of woe since spring 2022. In fact, monthly sales have been below the 10-year average every month since May 2022, largely tied to the market’s reaction to shifting overnight rates.
This chart shows the 10-year average (in black) with the monthly sales since 2023 (in red) doing their best to keep up. Note the progress made in the back half of 2024, which has been sideswiped here in 2025.

What does that mean?
- As a seller, you need to be tuned into the buyer demand as it relates to your home.
- As a buyer, you need to know what to expect in terms of competition, or lack thereof, for what you’re looking to purchase.
- If you're looking to sell and buy, that awareness is even more critical. While many will look to find "a deal" on the buy side, they will slow down any and all progress with an unrealistic asking price on their own home.
Since January 2024, monthly sales have averaged 19% below the 10-year average. This is not the time to test the market as a seller.
SALE PRICES
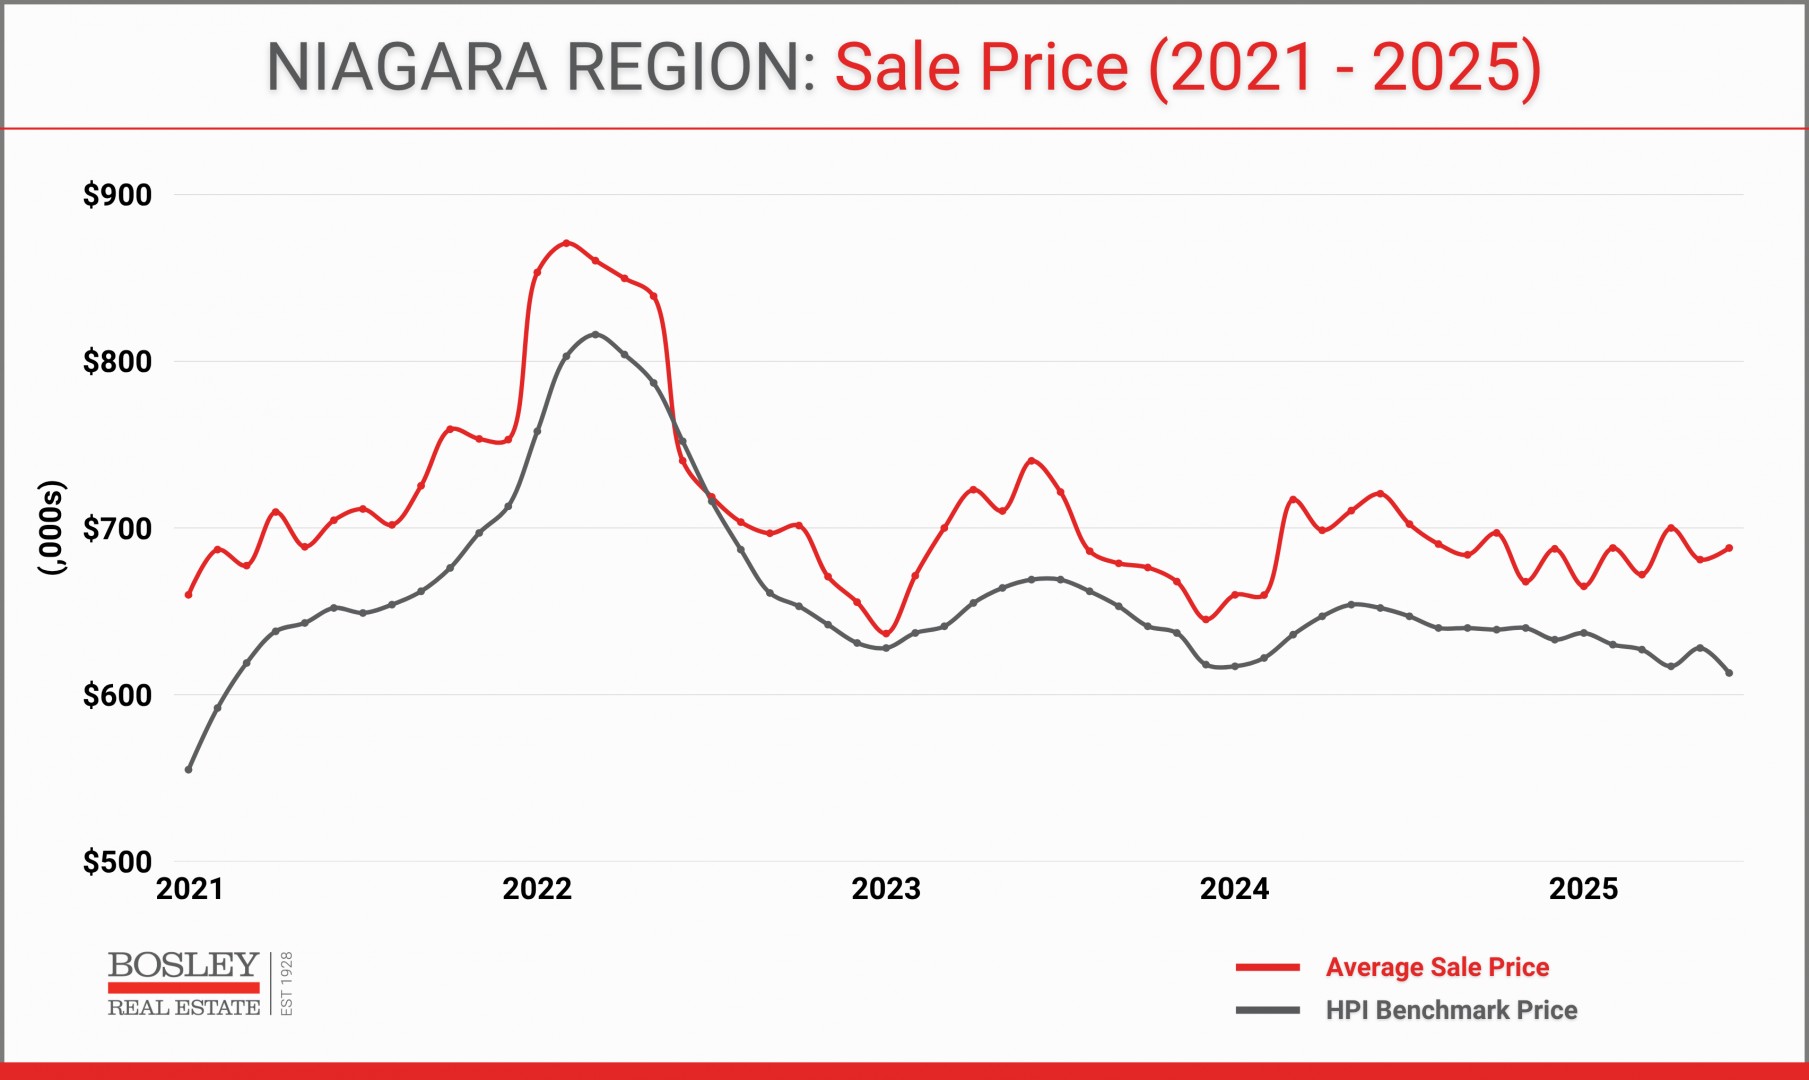
It doesn’t take an economist to know that elevated supply mixed with tepid demand results in downward pressure on prices. That is exactly what we have seen, as prices have largely bounced around the same range for the past four years.
Aside from late 2021 and early 2022, the average sale price has hovered around the high $600s to the very low $700s.
In the chart below, you’ll see the average sale price alongside the HPI benchmark price. The benchmark price reflects the “typical” home in Niagara, which is, in general terms, a 3-bedroom, 2-bathroom, brick bungalow with a full basement and attached garage. That definition removes the outlier sales, creating a smoother and more stable month-to-month trend.

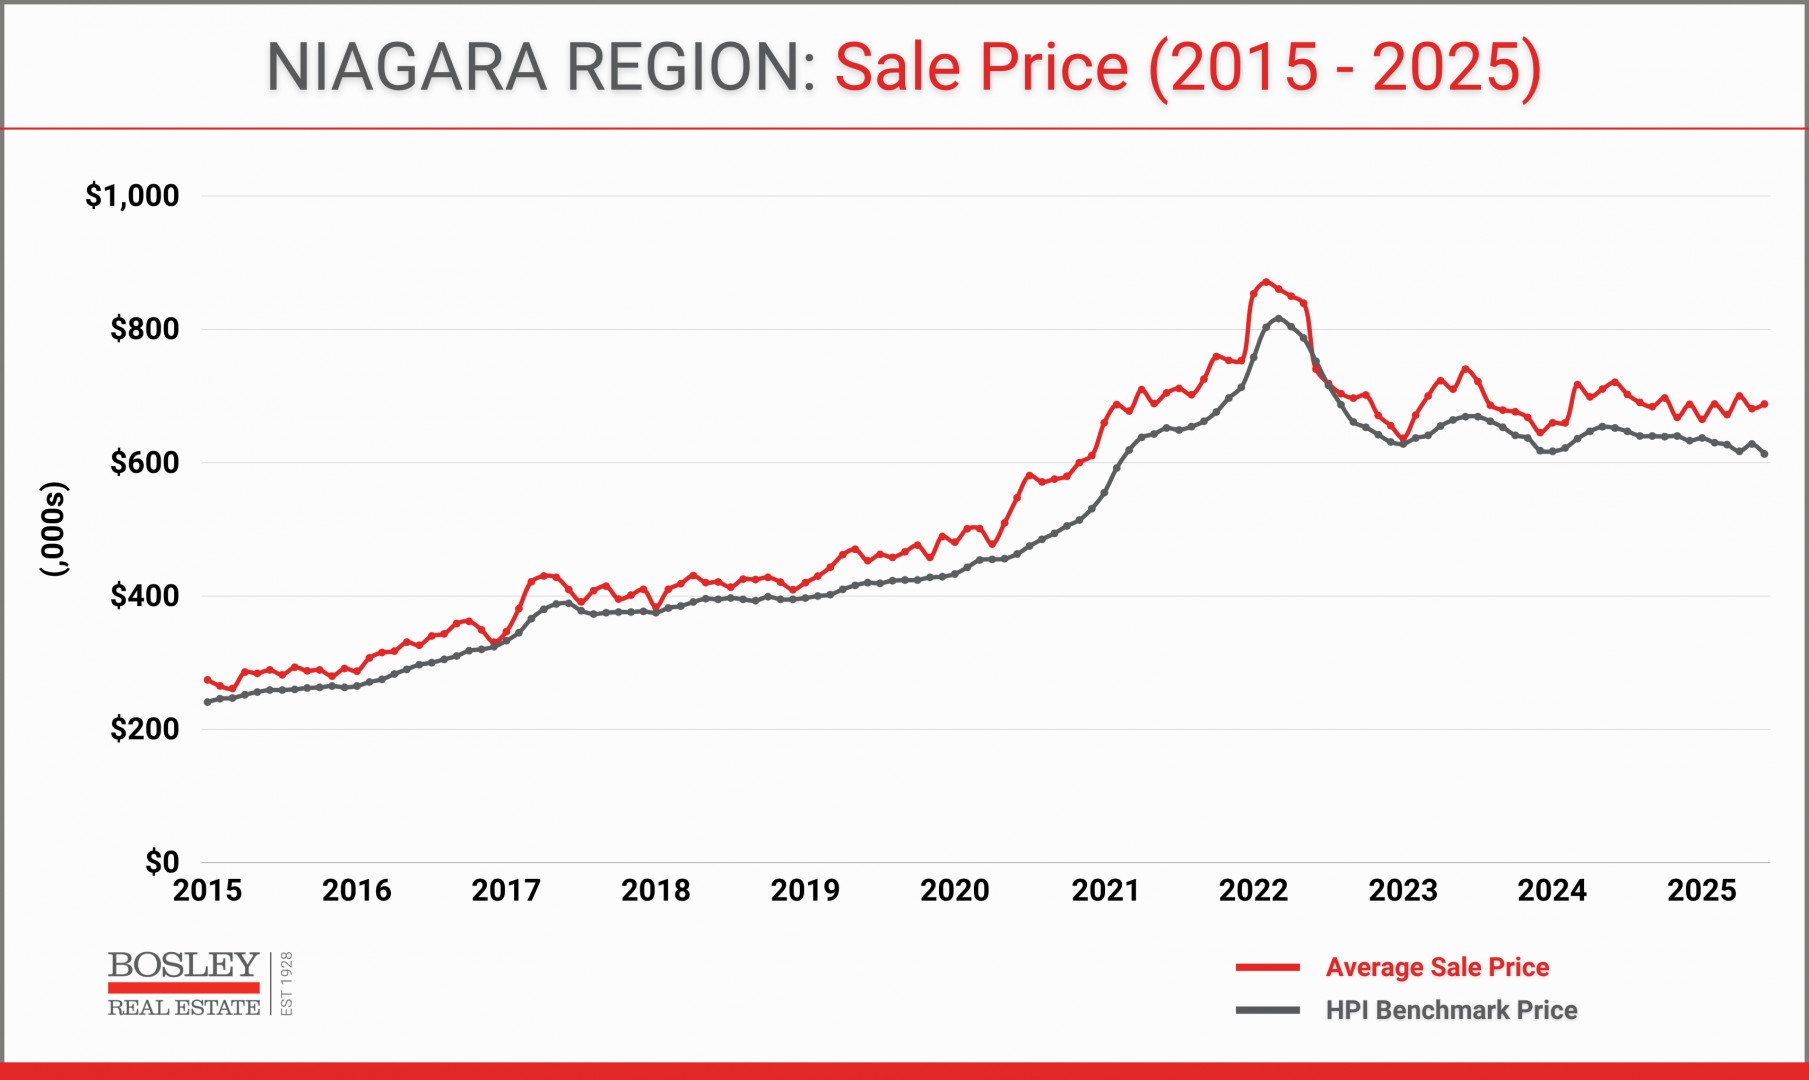
To provide further context, this next chart looks at average and benchmark pricing going back to 2015. It's worth noting that while the past five years have been stagnant, prices are still up nearly 25% since 2020.

What does that mean? Having an accurate understanding of values is critical, whether you are selling a home or buying. What are the recent trends? What is reasonable to expect? You can only buy or sell in the market of the day, so be cautious about using past, unrelated markets as justification for your strategy.
WHAT HAPPENS NEXT?
The real estate market is exactly that: a market. It ebbs and flows in parallel with confidence and overall market sentiment. We are living in a time of orchestrated uncertainty, which is clearly translating into a hesitant real estate market.
While July showed improvement when compared to the previous six months of 2025, we will take a wait-and-see approach over the next two or three months.
Will a Canada-U.S. trade agreement be put in place?
Will the economy stabilize?
What will the Bank of Canada do with the overnight rate in September and October?
All of that, and more, will determine the headlines we read and hear, whether on mainstream news, or from a buddy's unhinged post on Facebook. It all goes into the pot that stirs the emotions behind big life decisions, moving being one of them.
IDEALLY...
This is strictly hypothetical, but these are three big trends that we'll monitor:
1. Supply - we need to see the number of active listings get back into the 2,500 range.
2. Sales - monthly sales need to stay in the 10% above the 10-year range in order to instil some more buyer intent.
3. Prices - not only the average, but also the median, HPI benchmark, as well as movement in several market segments will be important to watch.
We will continue to watch, so you don't have to. Questions?
