

2023 v 2022
This blog is a tale of caution. In particular, the dangers of comparing any month to the same month in the previous year and then assigning too much significance to it.
Let’s look back (very briefly) to the first half of 2022.
Sales were well above normal, running 15 – 25% above the 10-year average. Meanwhile, the number of new listings were particularly tight with January 2022 coming in 23% below the 10-year average.
So, with sales that far above normal while available inventory was so low, we had a Unicorn Q1 of 2022 with prices lurching to record highs. Remember when homes were getting 23 offers and selling for $150,000 above asking? Yes, that market.
As you probably recall, the market flipped on its head in April and May as listings piled on while sales receded and then dropped off the map. And this is why year-over-year comparisons are dangerous territory.
While driving to the office today, I listened to someone on the CBC quoting a CREA report that talked about May 2023 being the first month in some time that had increased sales year over year. What happened here you ask?
Let’s look at Niagara.
Have a look at the graph below. The pink bars are the monthly sales for 2022 while the grey bars show the 2023 numbers.
Notice how January to March 2022 were incredibly strong while early 2023 was weak in comparison. Then March through June 2022 took hefty steps down into the summer. Meanwhile, May 2023 took a serious step up.
How significant was May 2023?
It was the first month since June 2021 to have more monthly sales when compared to the same month in the previous year.
Let's put that another way. For nearly 24 consecutive months, each and every month underperformed when compared to the same month in the previous year until May 2023 came along and broke the streak. Note: that is good news. But...keep reading.
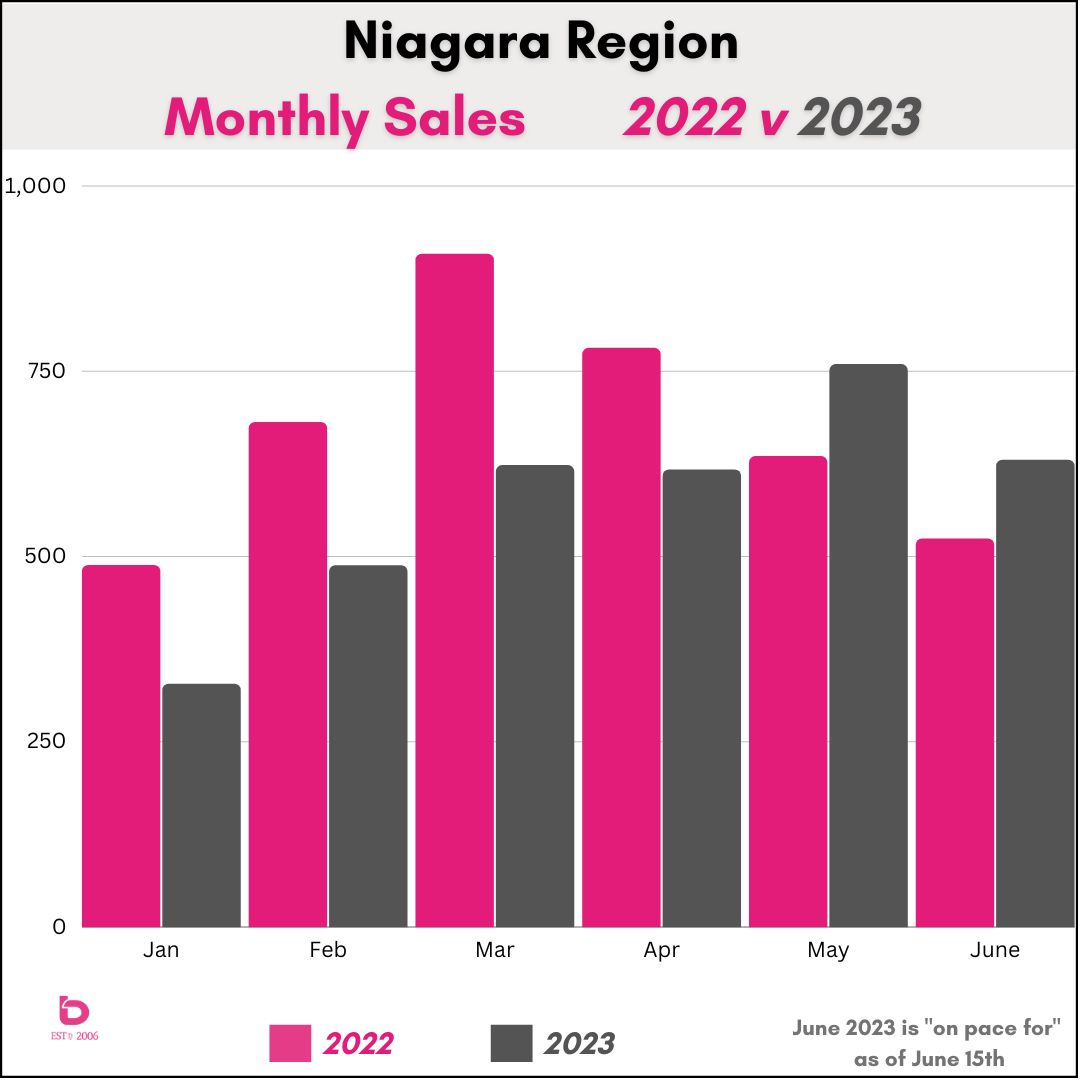
So, yes, May 2023 did beat May 2022.
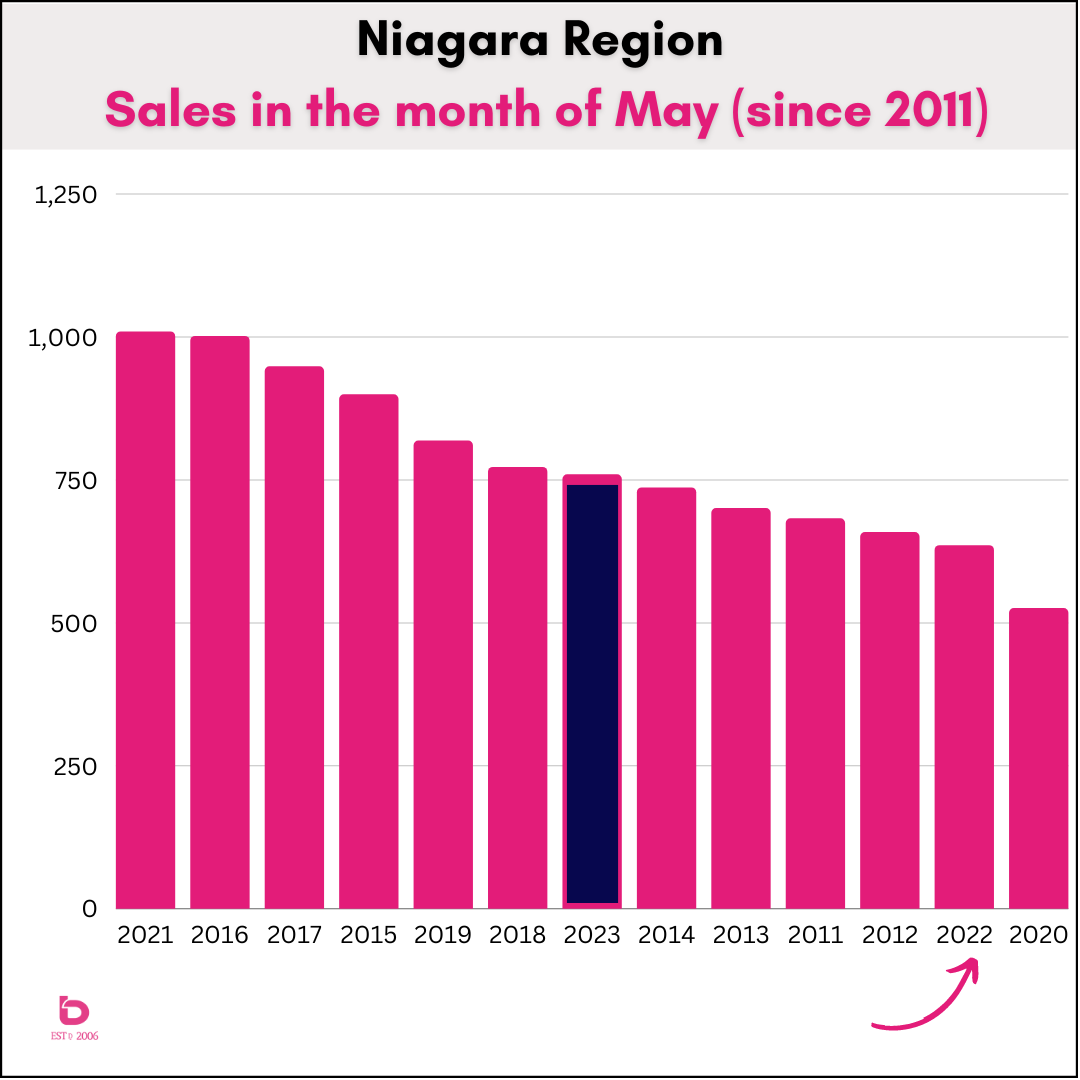
However, May 2022 was also the worst May in at least a decade (excluding the COVID ravaged May 2020 market). This graph shows the number of sales in the month of May going back to 2011. Even though May 2023 was an improvement, it was still 6% below the 10-year average. Still, given the roller coaster of the last 18 months, we'll take it!
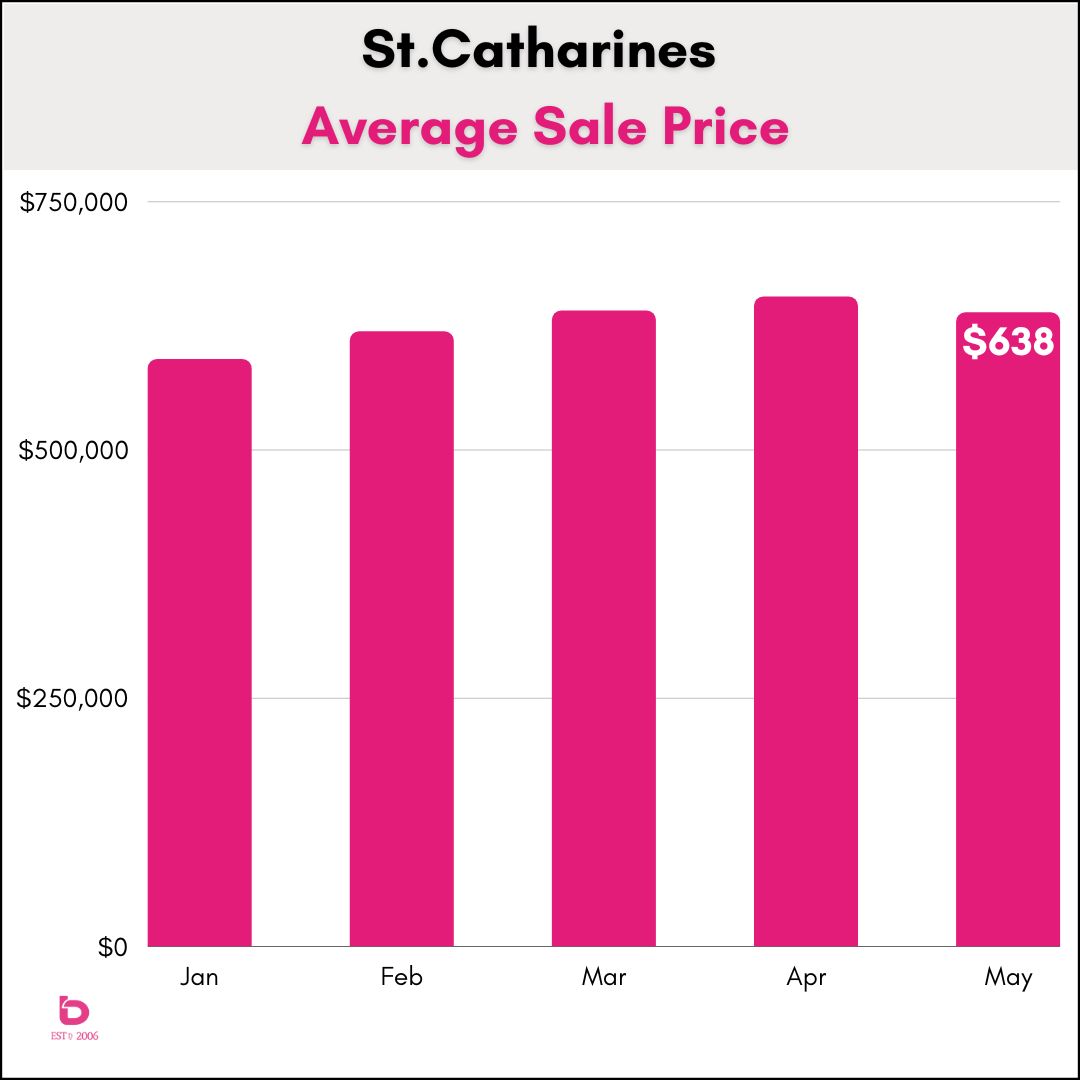
What about St.Catharines?
St.Catharines has the highest annual sales amongst all other cities in Niagara, so it's helpful to keep tabs on the Garden City.
While following a similar trend to the Region, sales in May 2023 were essentially level with May 2022.
Looking forward, June 2023 is going to look particularly strong in comparison to last year however June 2022 was an absolutely terrible month with sales running 42% below the 10-year average. And it was the worst June on record. So, while this June looks strong compared to last year, June 2023 is on pace to come in about 20 - 24% below the 10-year average.
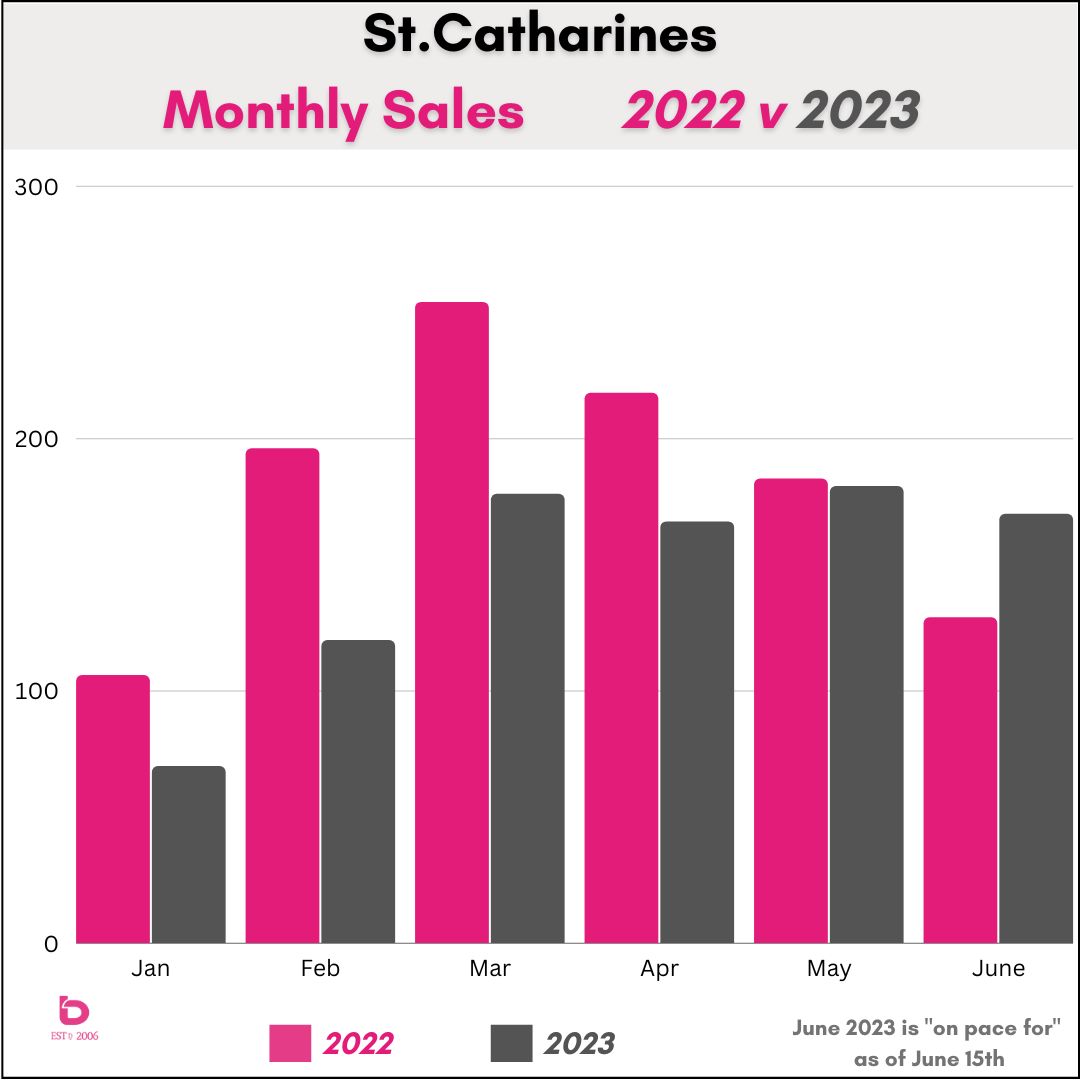
Yes, the June 2023 numbers are "on pace for" as of today (June 15th) but they will come in reasonably close to these.
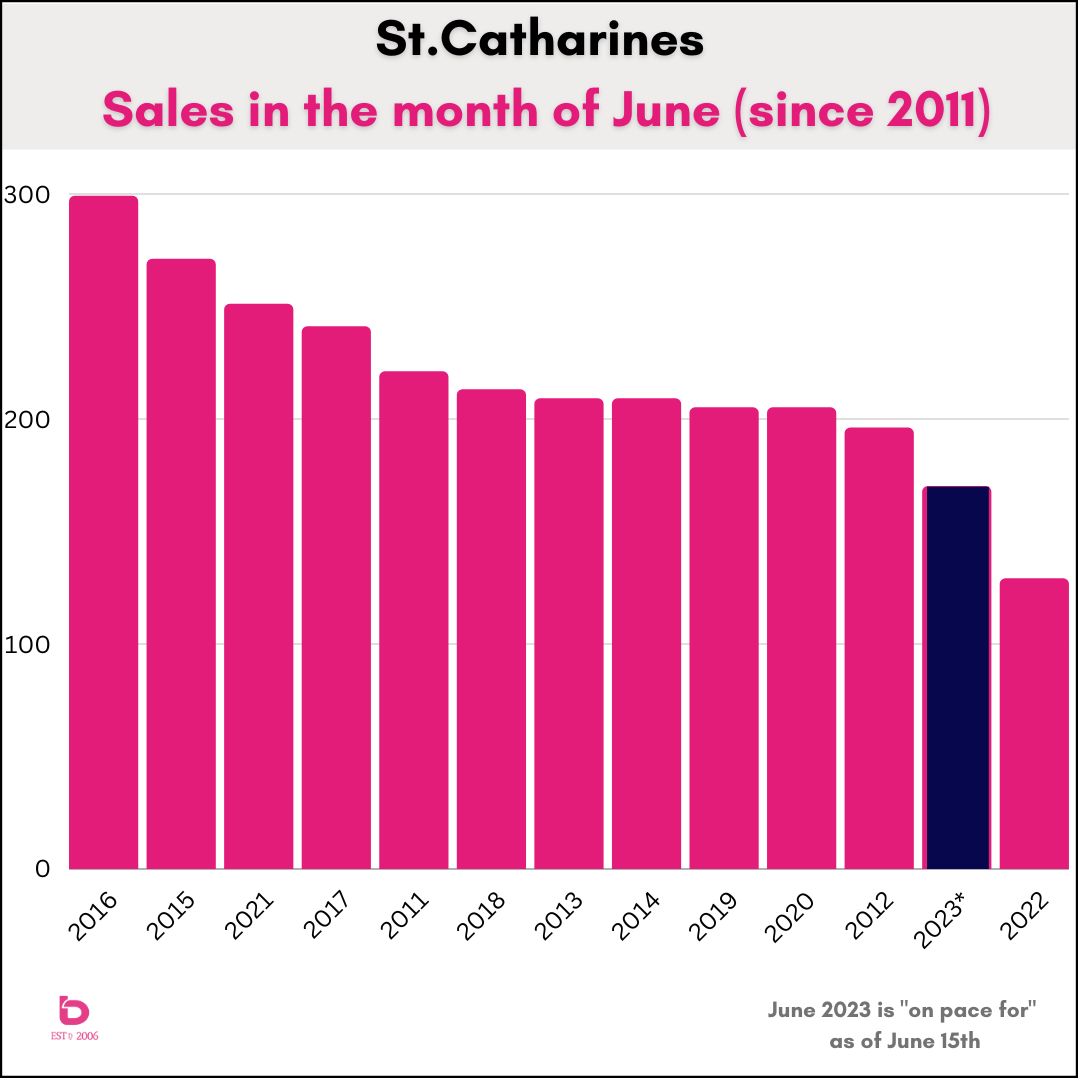
Similar to Niagara, here is a key point to remember:
June 2023 will post the 2nd lowest sales for the month of June going back at least a decade, with June 2022 being the lowest (by a landslide). So sure, June of this year will beat 2022 but as always, stats are like warm potato salad. They're worthy of further thought before consuming.
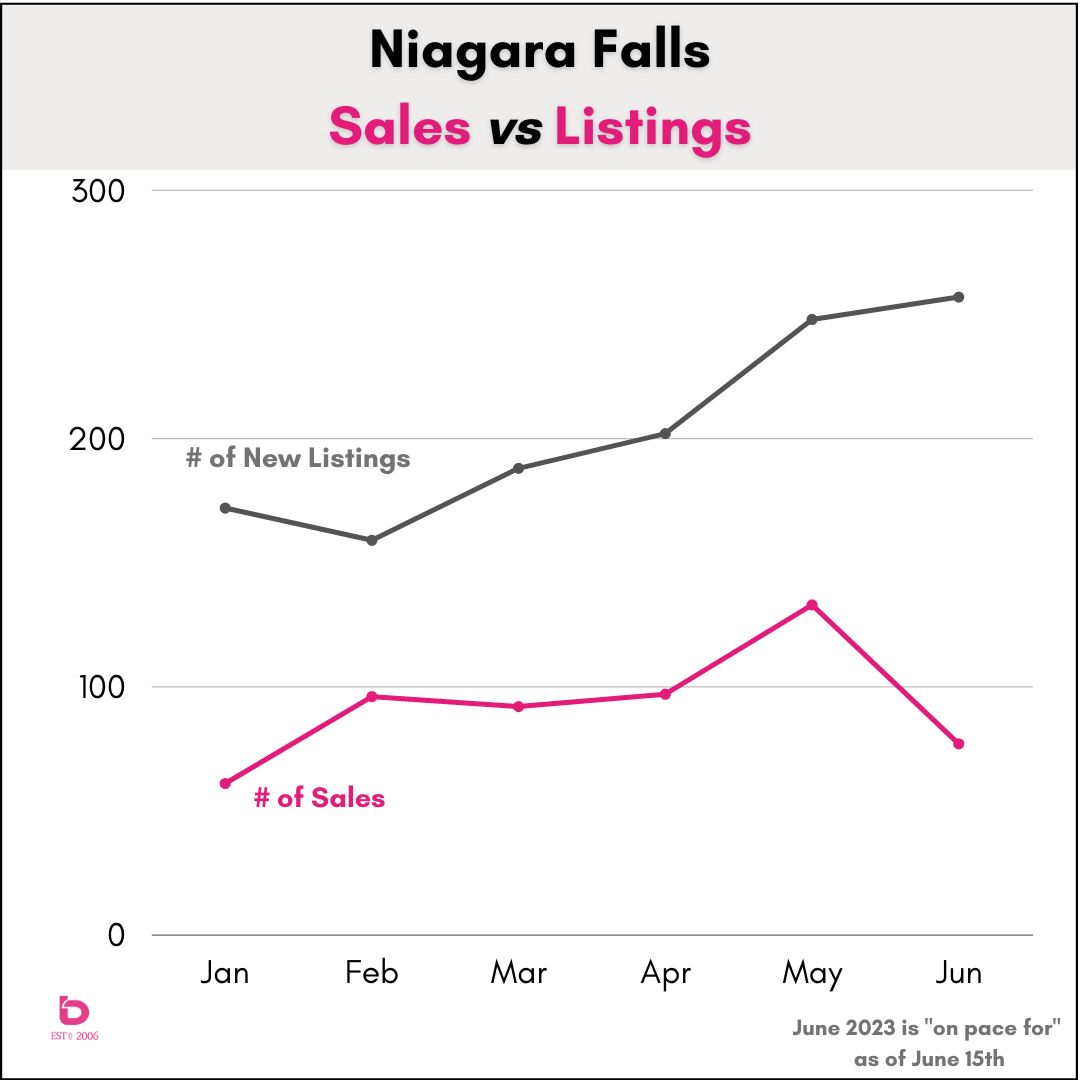
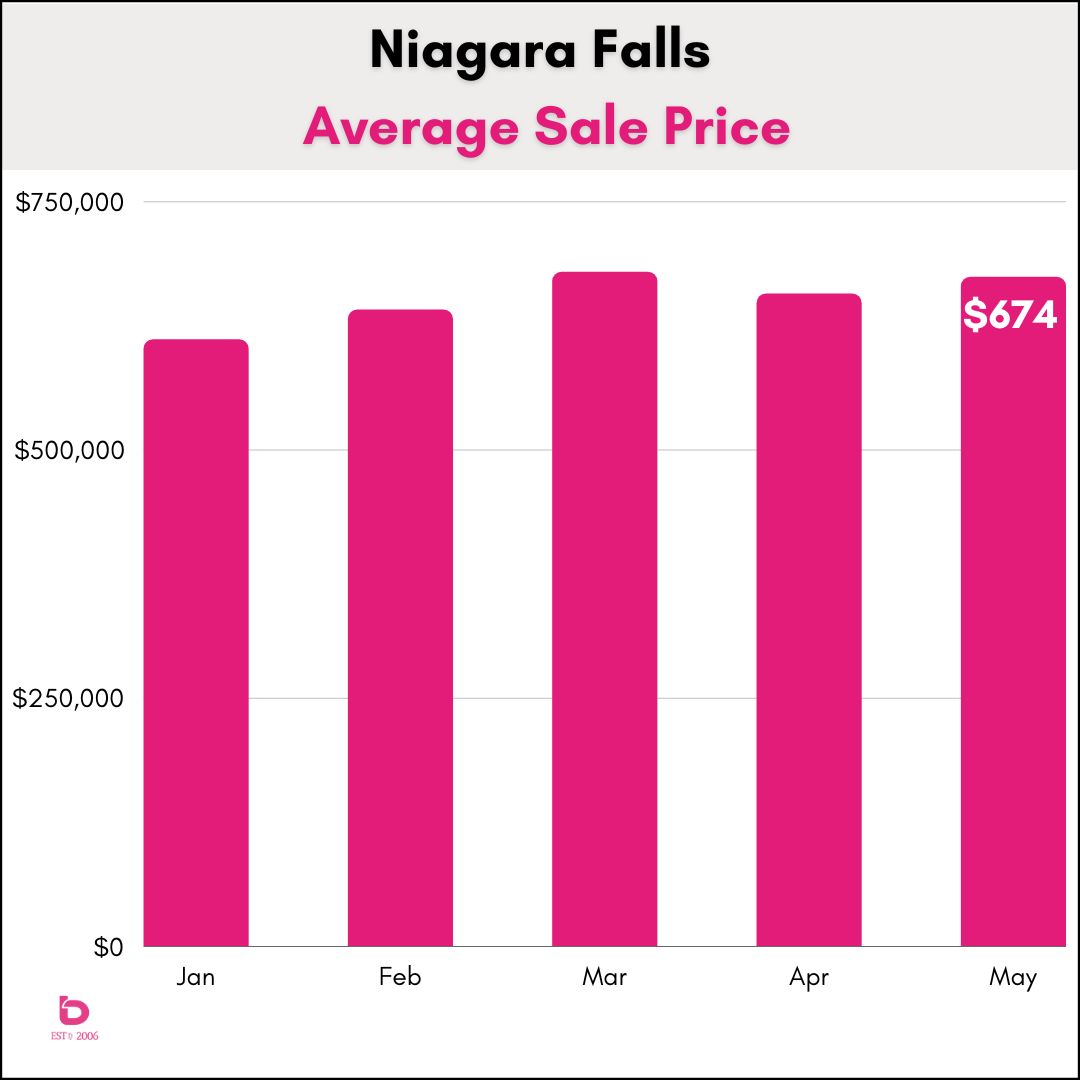
How about Niagara Falls?
Niagara Falls can be challenging to figure out. It's a 7-sided rubiks cube due to some unique variables. In particular, the demand side is inconsistent due to the changing appetite of the out-of-town investor. So, while Niagara Falls is the second city in Niagara in terms of monthly sales volume, you will typically find more volatility than you may expect.
Let's look at the supply and demand side of things.
This graph clearly displays a changing market as inventory builds (ascending gray line) while demand pulls back (descending pink line). There was clearly a push in May 2023 which had the highest monthly number of sales (133) since March 2022 (156 sales).
Meanwhile, June 2023 is currently on pace for the worst sales numbers for the month of June in at least a decade. If current trends continue, June will run 40% below the 10-year average which is an alarming and strange trend given the production in May. That month-to-month volatility shines a light on the fickle nature of demand in the city.
And yes, that relationship between supply and demand will directly impact sale prices. Let's have a look at that...
What are homes selling for these days?
How many homes are for sale and how many people want to buy them. That is all there is to it. With that said, there are several caveats to consider with monthly average sale prices.
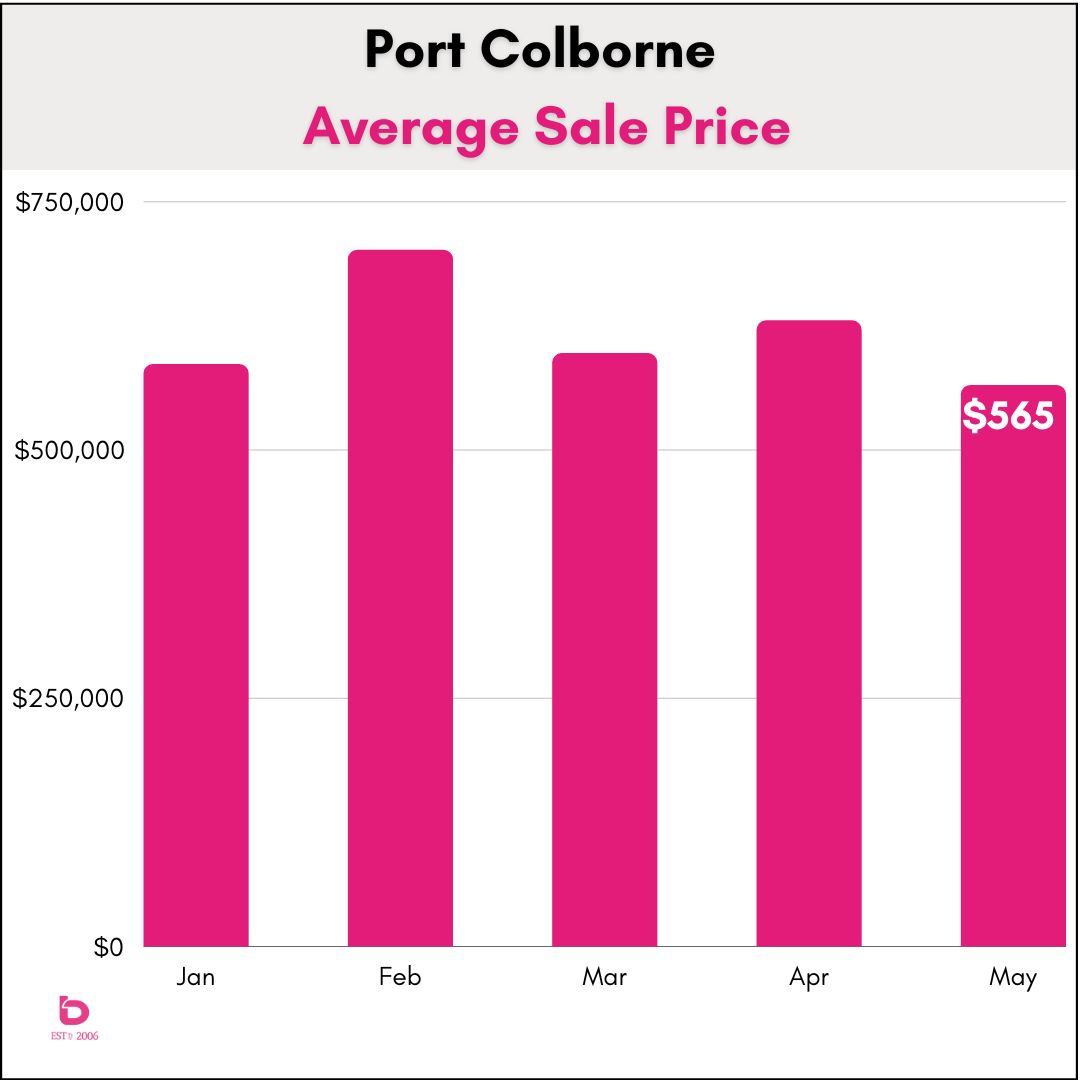
- The smaller the market, the greater the volatility. In a town like Niagara-on-the-Lake for example, there are only 10 or 20 sales in a given month. A sale of $5,000,000 can pull the data up while several lower end sales can then drag things down.
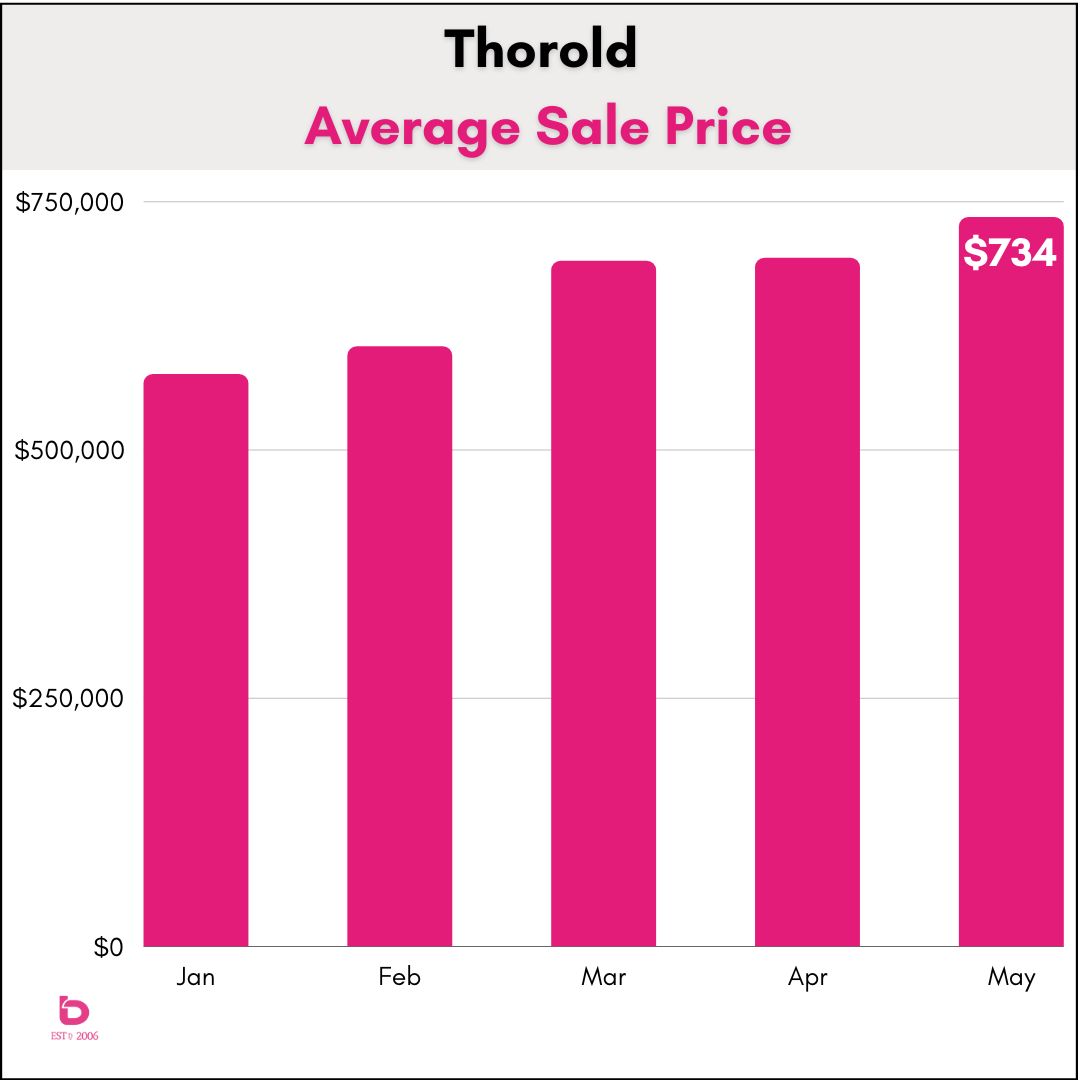
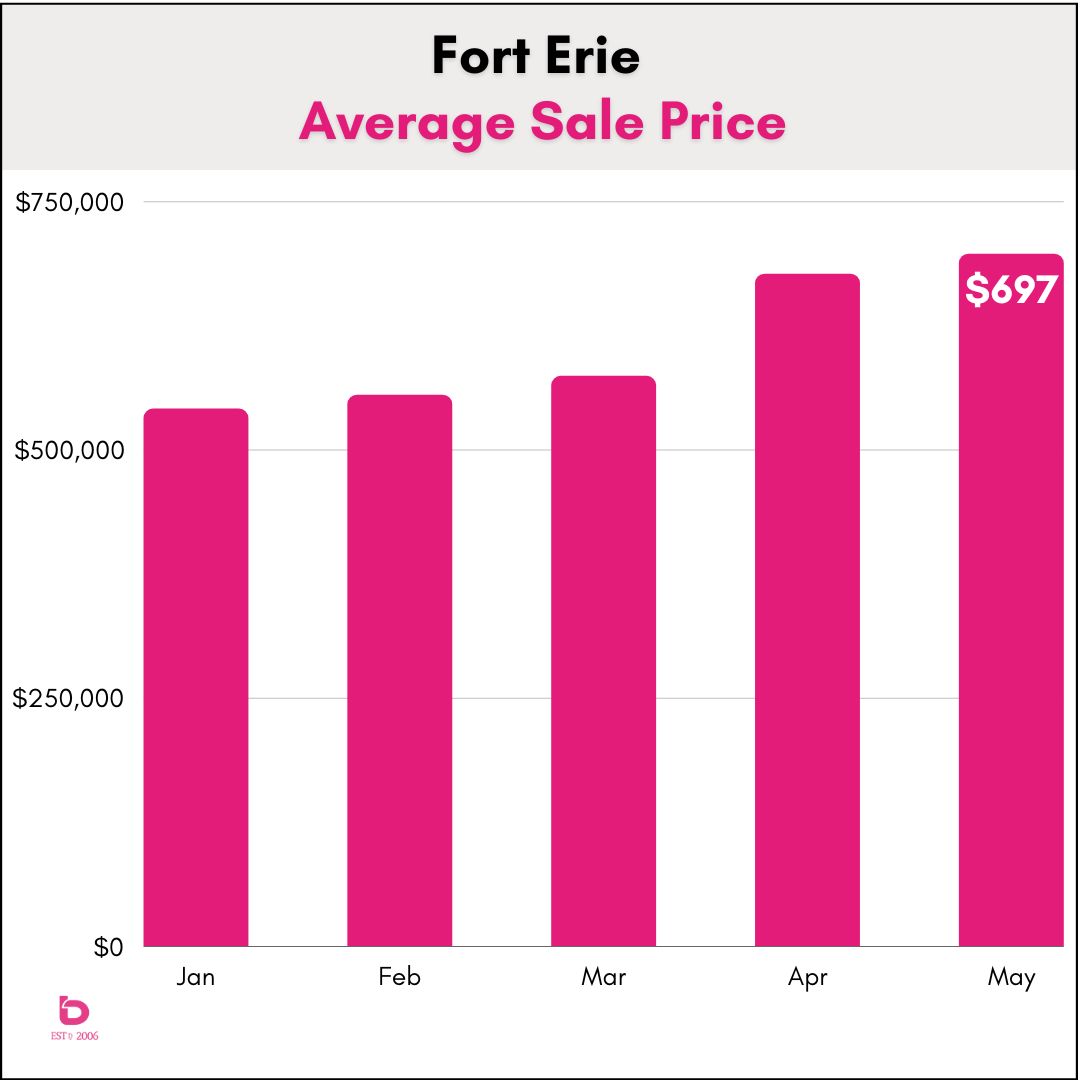
- Geographical considerations. Look at Fort Erie where you can have rural, waterfront and small cottages all mix together. Or Thorold which suddenly has a huge amount of new construction feeding the data. Again, without the benefit of signifcant volume, prices can easily be skewed.
- See 1 and 2.
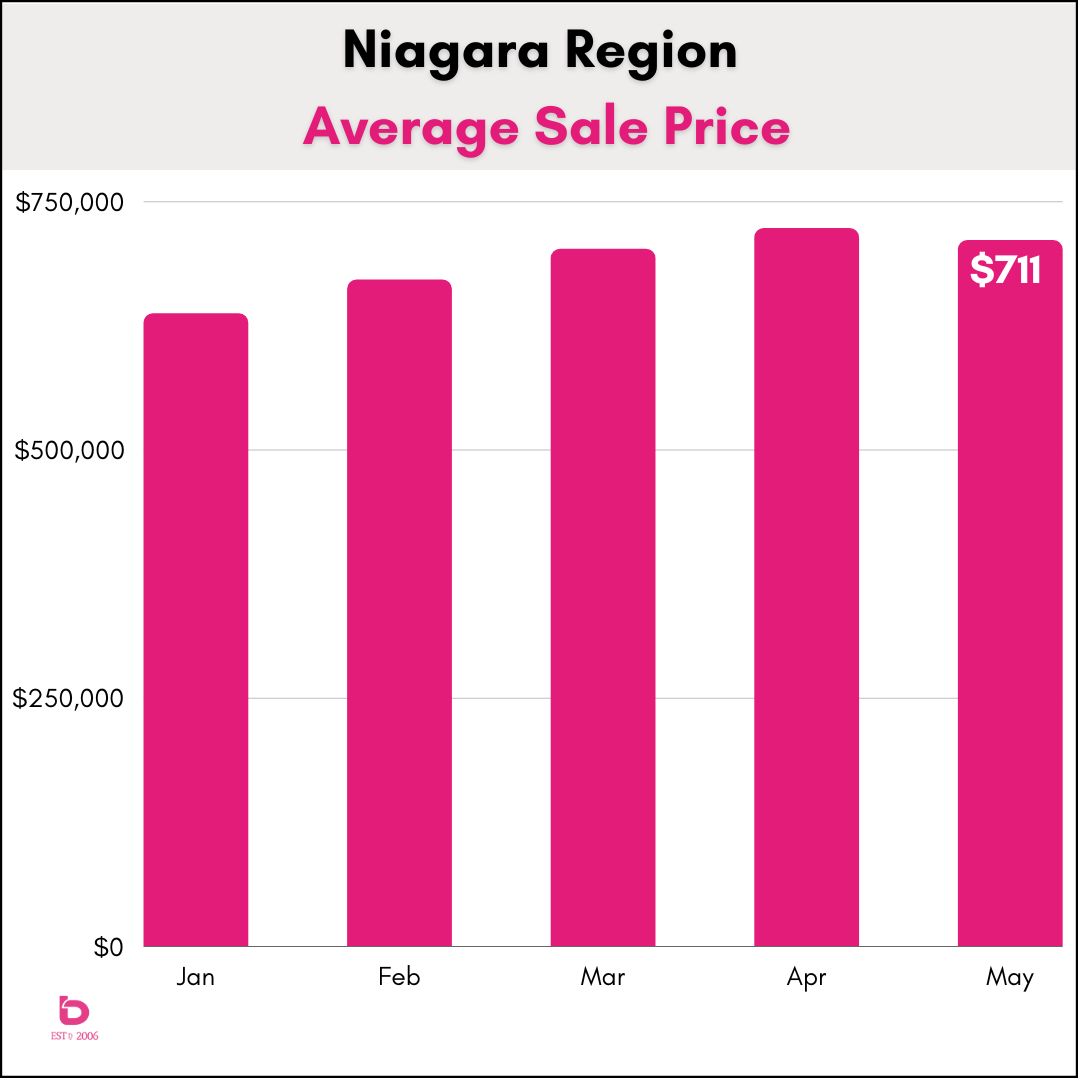
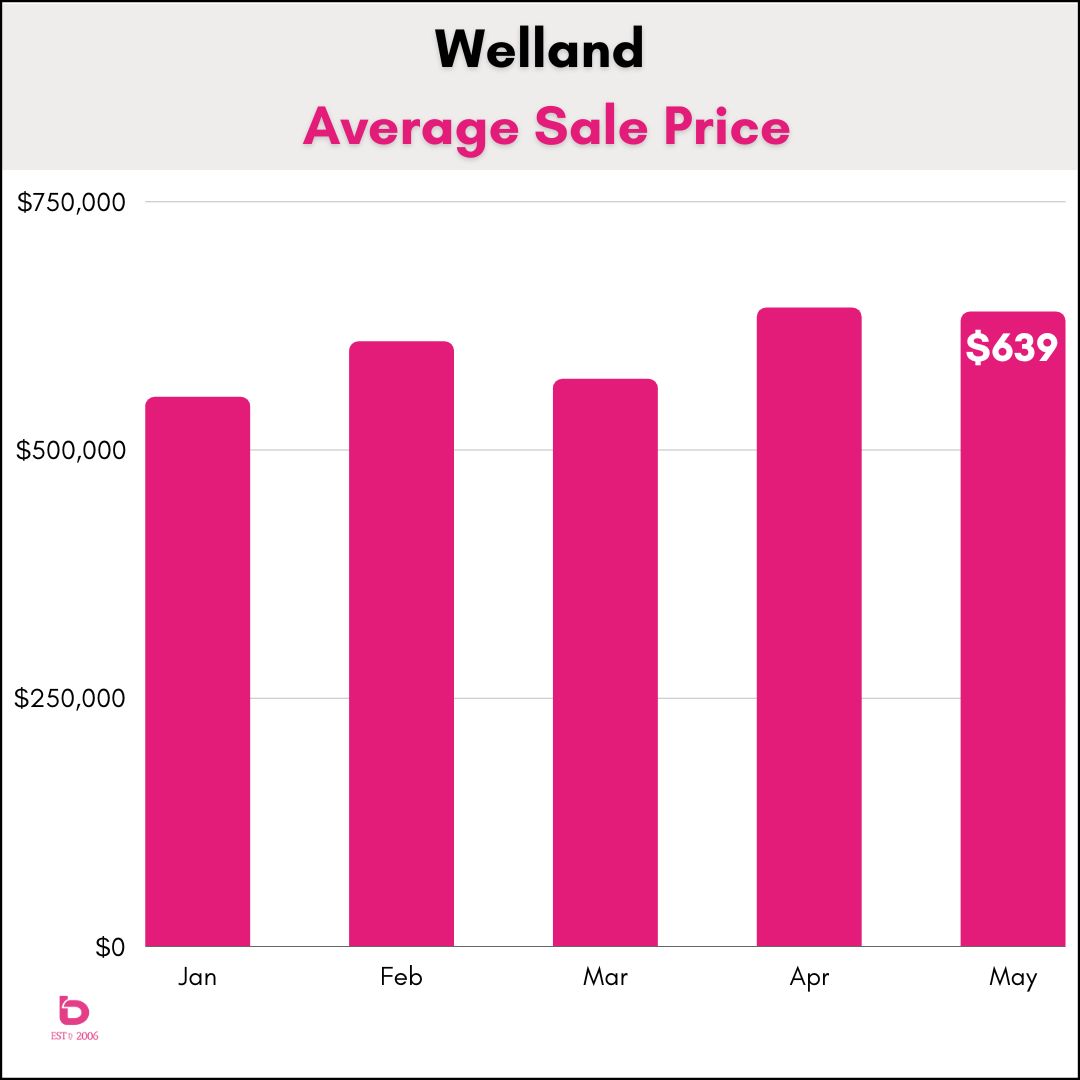
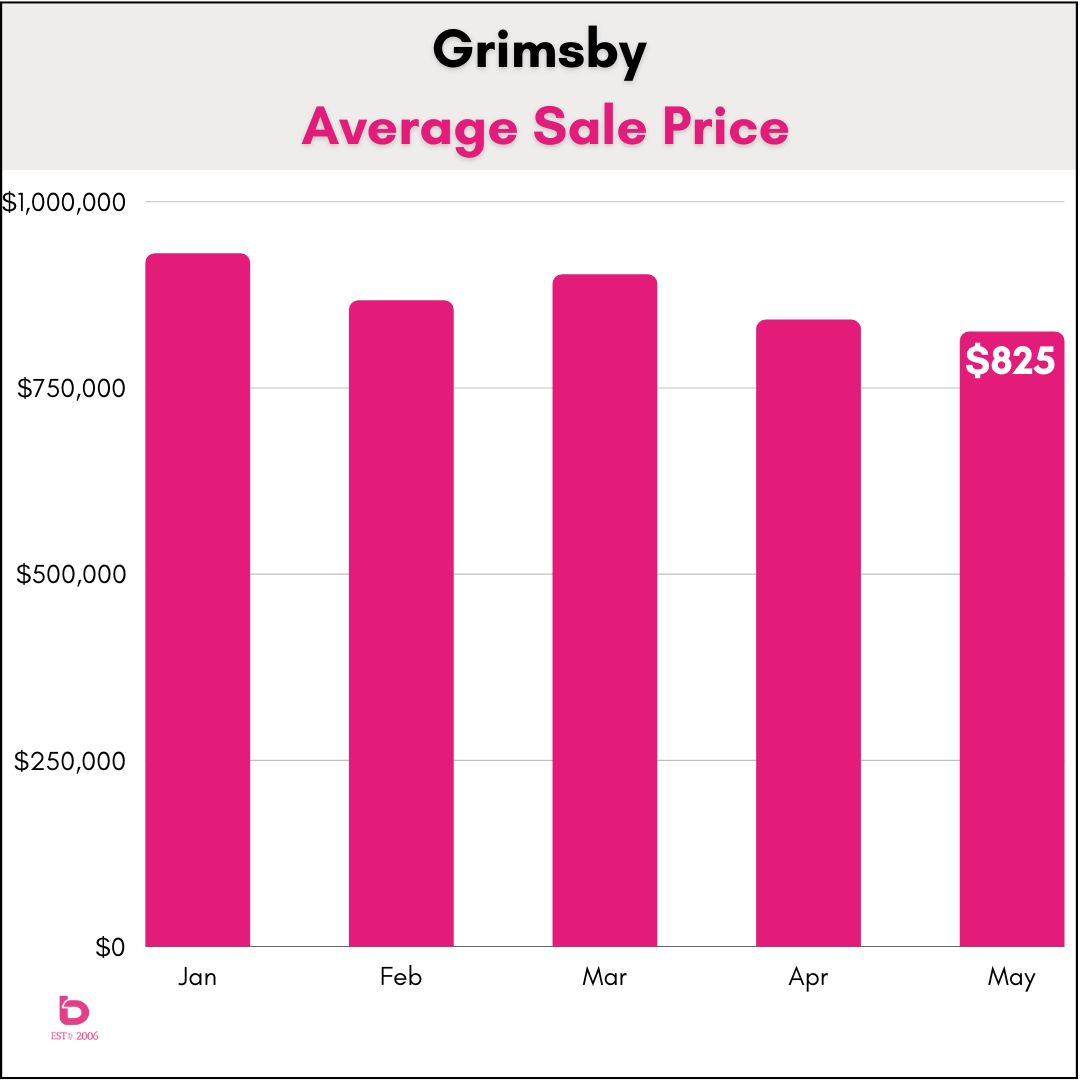
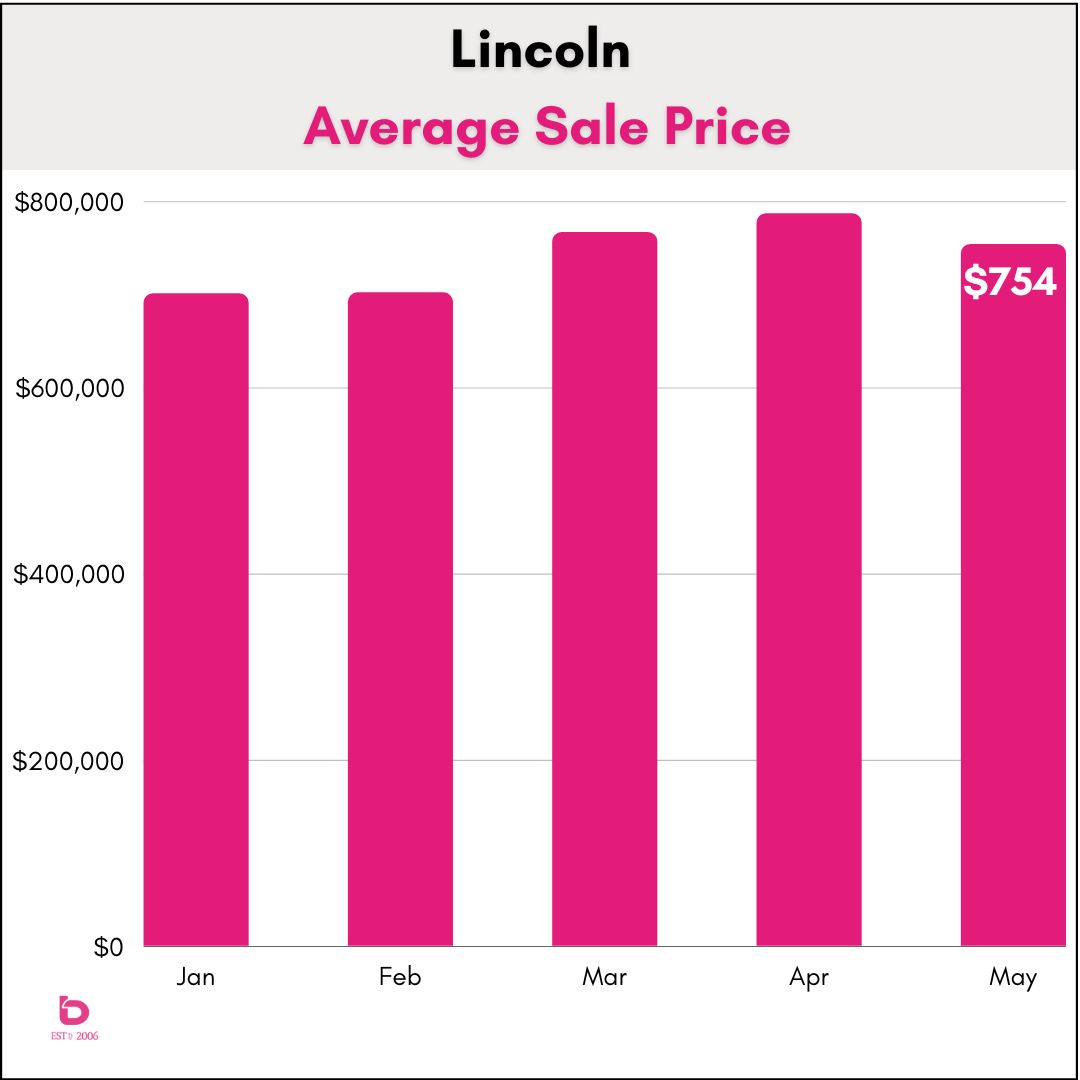
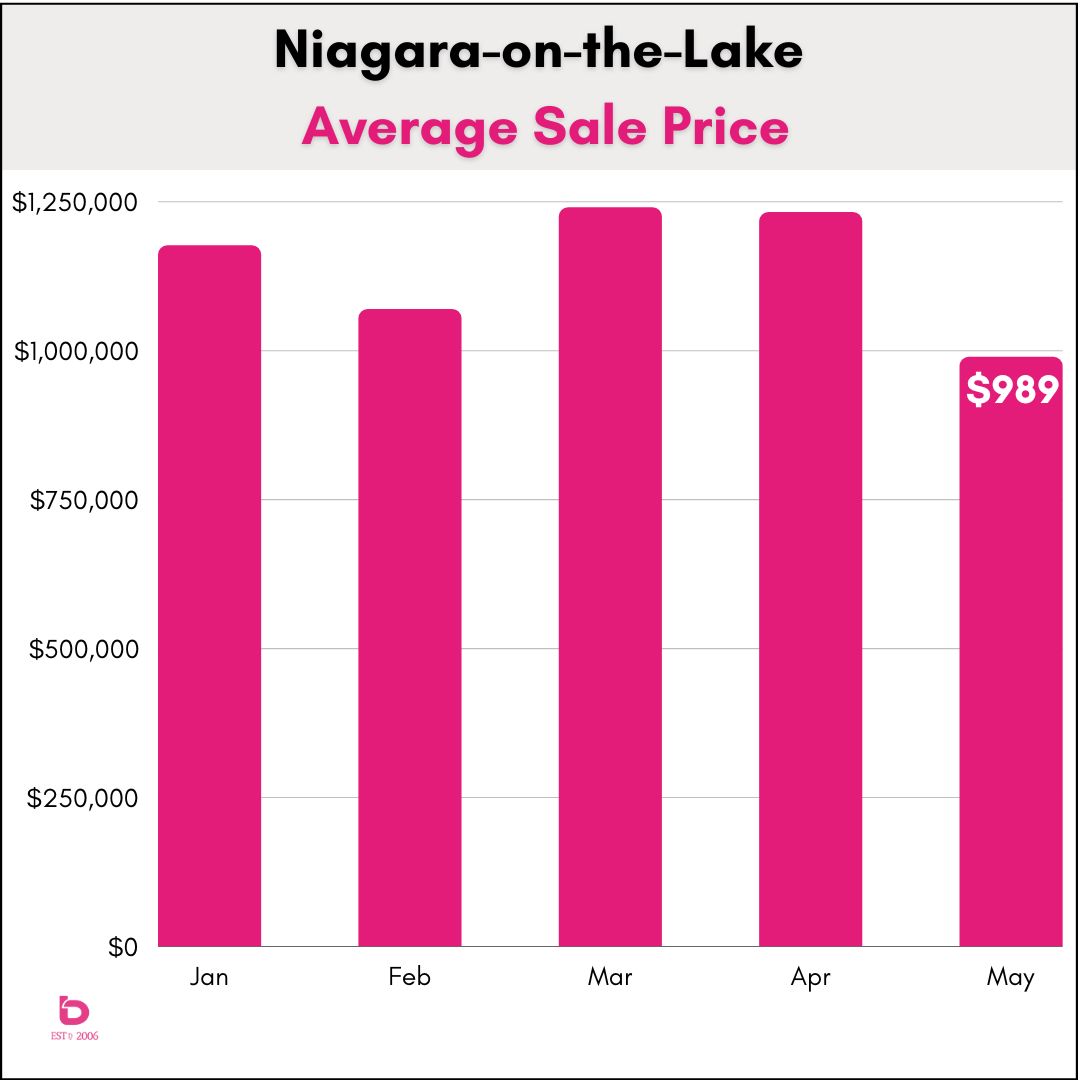
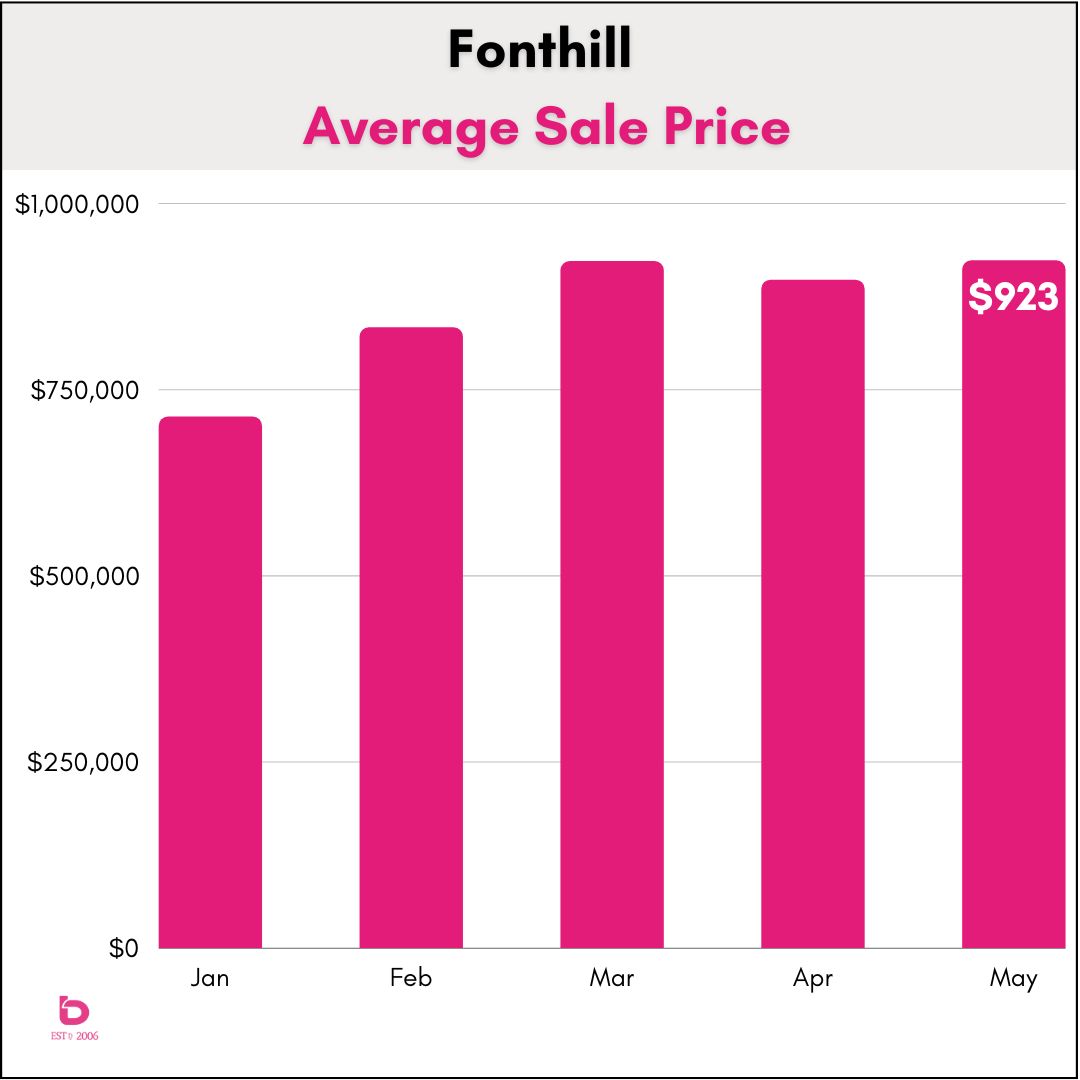
With that said, here is the 2023 YTD average sale price data for all of Niagara.
You'll see that pricing, in general, has not figured itself out yet. In general, the balance of supply and demand was tighter in March-April which resulted in higher prices. Here in June we won't be surprised to see the trend of slight easing in May continue.
What happens next?
We do not expect to see this summer shooting the lights out. If anything, it will likely lumber along as sales continue to hang in there but still run below historical norms.
There are two key factors to watch, among all the other key factors.
- Ambitious asking prices. Be careful with your asking price. For example, the current average asking price in St.Catharines is $837,000. Meanwhile, the average sale price over the past 30 days was $656,000. That's a gap of $181,000 between reality (selling price) and dreams (asking price).
- Buyer willingness. Are the buyers out there and if so, are they willing to take leaps. From there, pay attention to the various price brackets. For example, homes in the $500 - 600,000 range are still performing well as buyers look to more affordable options. Meanwhile, the $800 - 1M range needs to make sure their strategy is sound as that segment can be quite soft. Then the million + market is another story where yes, there is demand, but you need to be spot on with pricing and the overall presentation of the home.
Questions? Theories? Please let us know. We'd love to hear from you!
As always, thank-you for visiting.