

NIAGARA v CANADA – April 2025
Each month, the Canadian Real Estate Association (CREA) releases its monthly report for the Canadian real estate market. While the national market doesn’t always relate to your particular home, it does give an indicator of where the market is in general.
Which begs the question: How does the April 2025 data for Canada relate to the Niagara real estate market data? Fret not, we have that info for you.
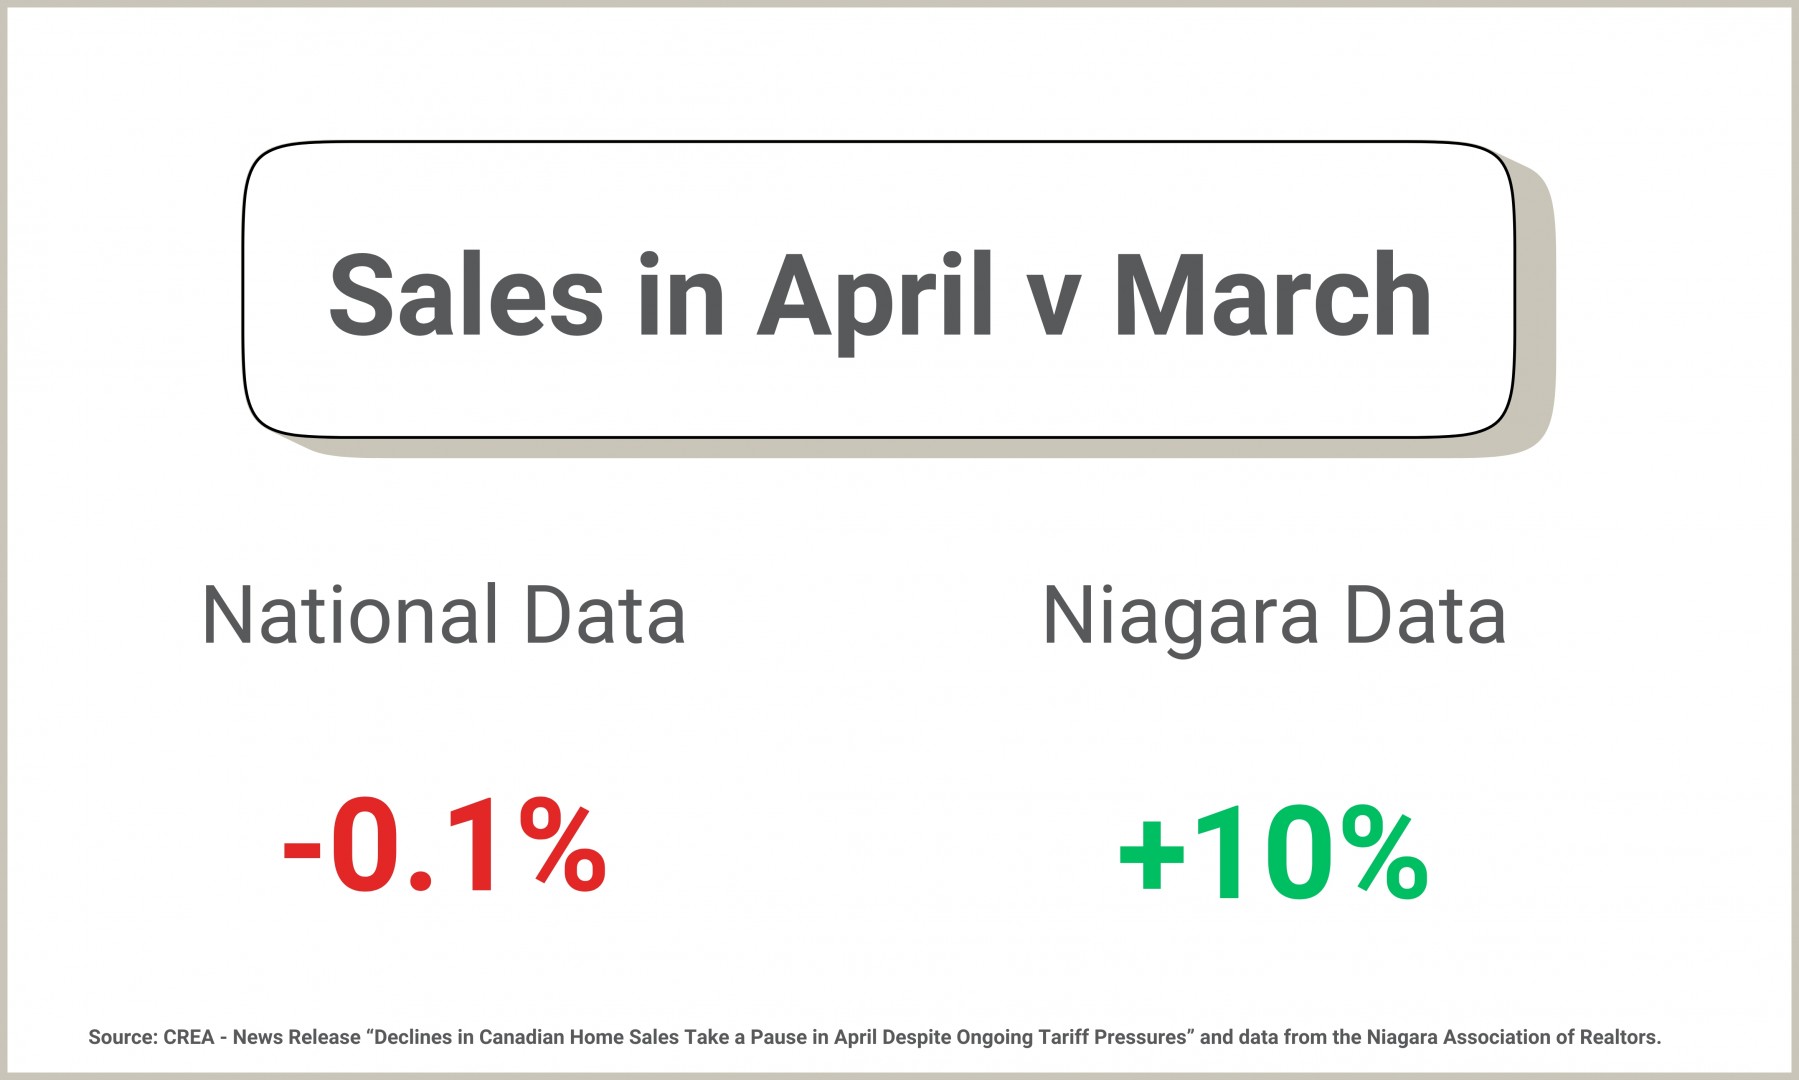
Home Sales – Month Over Month
The total number of homes sold will typically increase from March to April, and that is what happened here in Niagara in 2025. In fact, since 2011, sales have increased in 9 out of 15 times from March to April. Year-to-date in 2025, monthly sales have increased each month which is a positive in light of the fact that overall volume has been so weak.
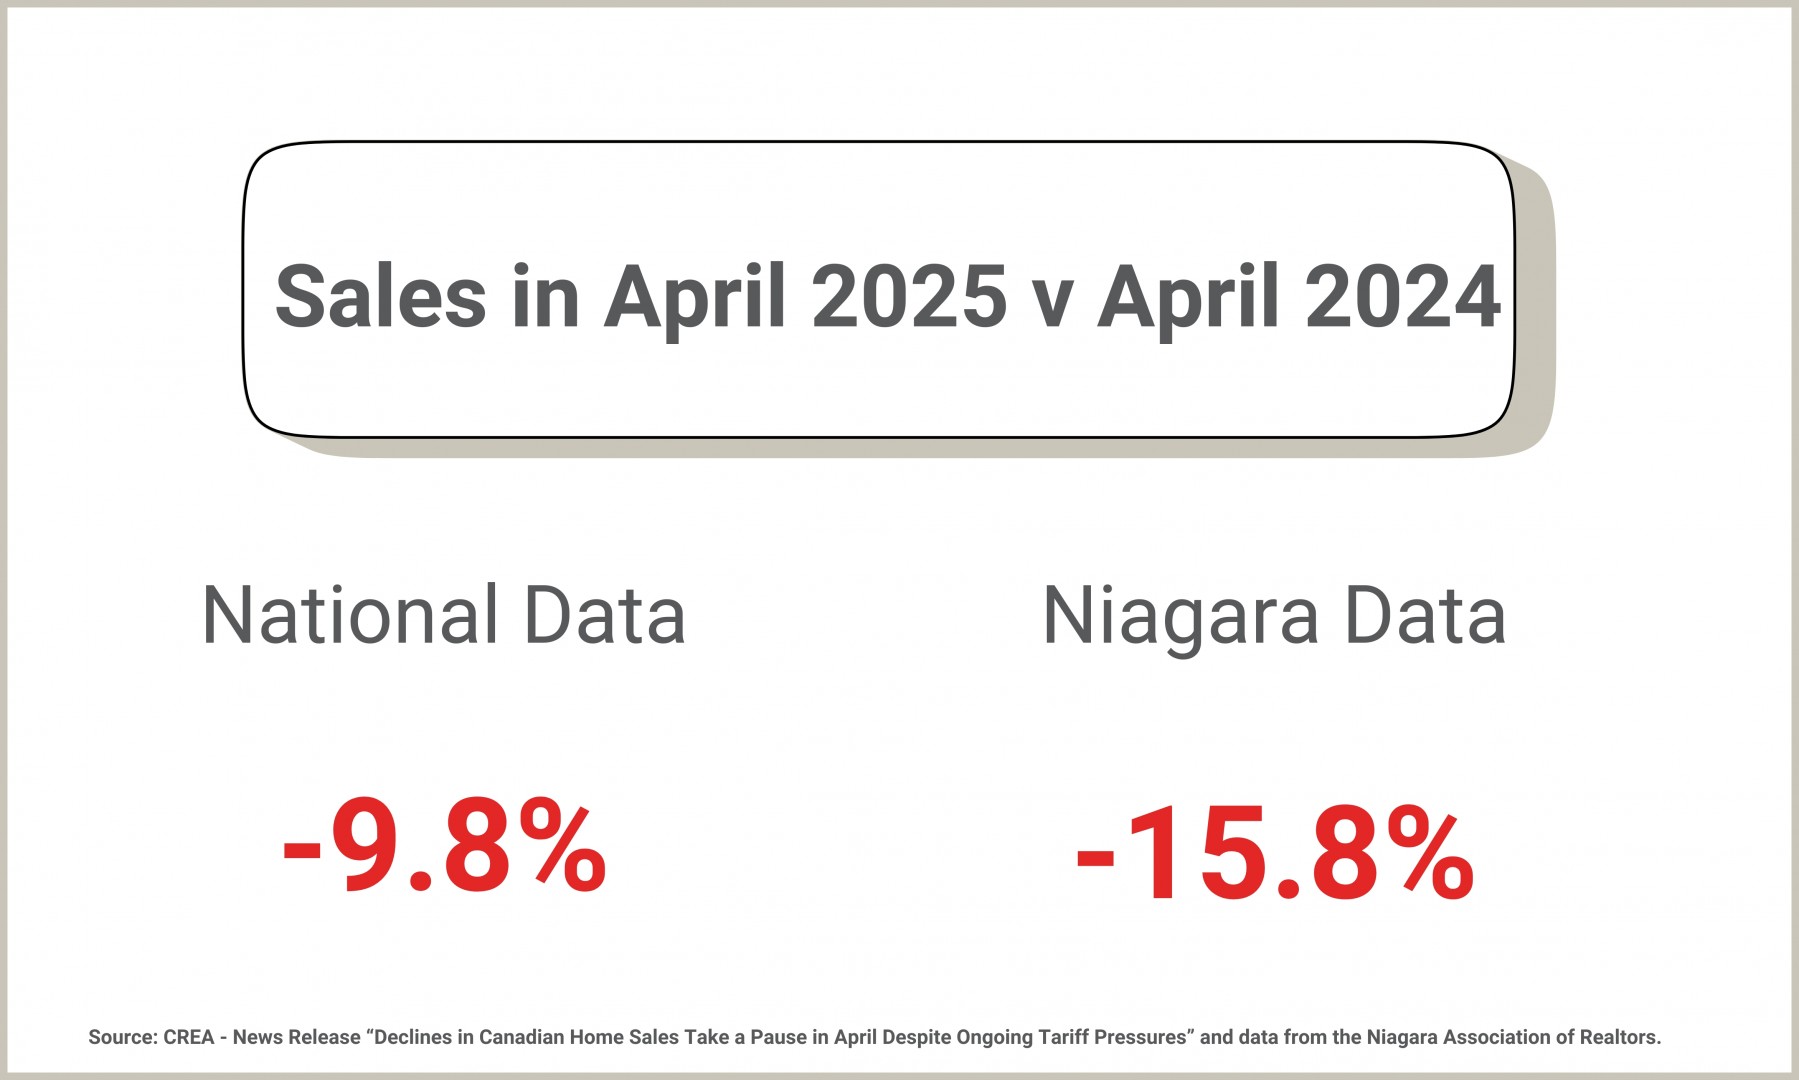
Home Sales – Year Over Year
We have had several years of very strange spring markets, and that trend has certainly continued here in 2025. In general, sales in 2024 started out reasonably strong, with January, February, and March coming in at -8%, -1% and -15% respectively, below the 10-year average.
April 2024 had 651 sales, which, in general, was fairly strong in comparison. Here in 2025, the market has been directly impacted by the orchestrated uncertainty that has been created by our friends to the south. As a result, the spring market has been stunted, with sales in February (-31%), March (-33%), and April (-26%) all coming in well below normal market conditions.
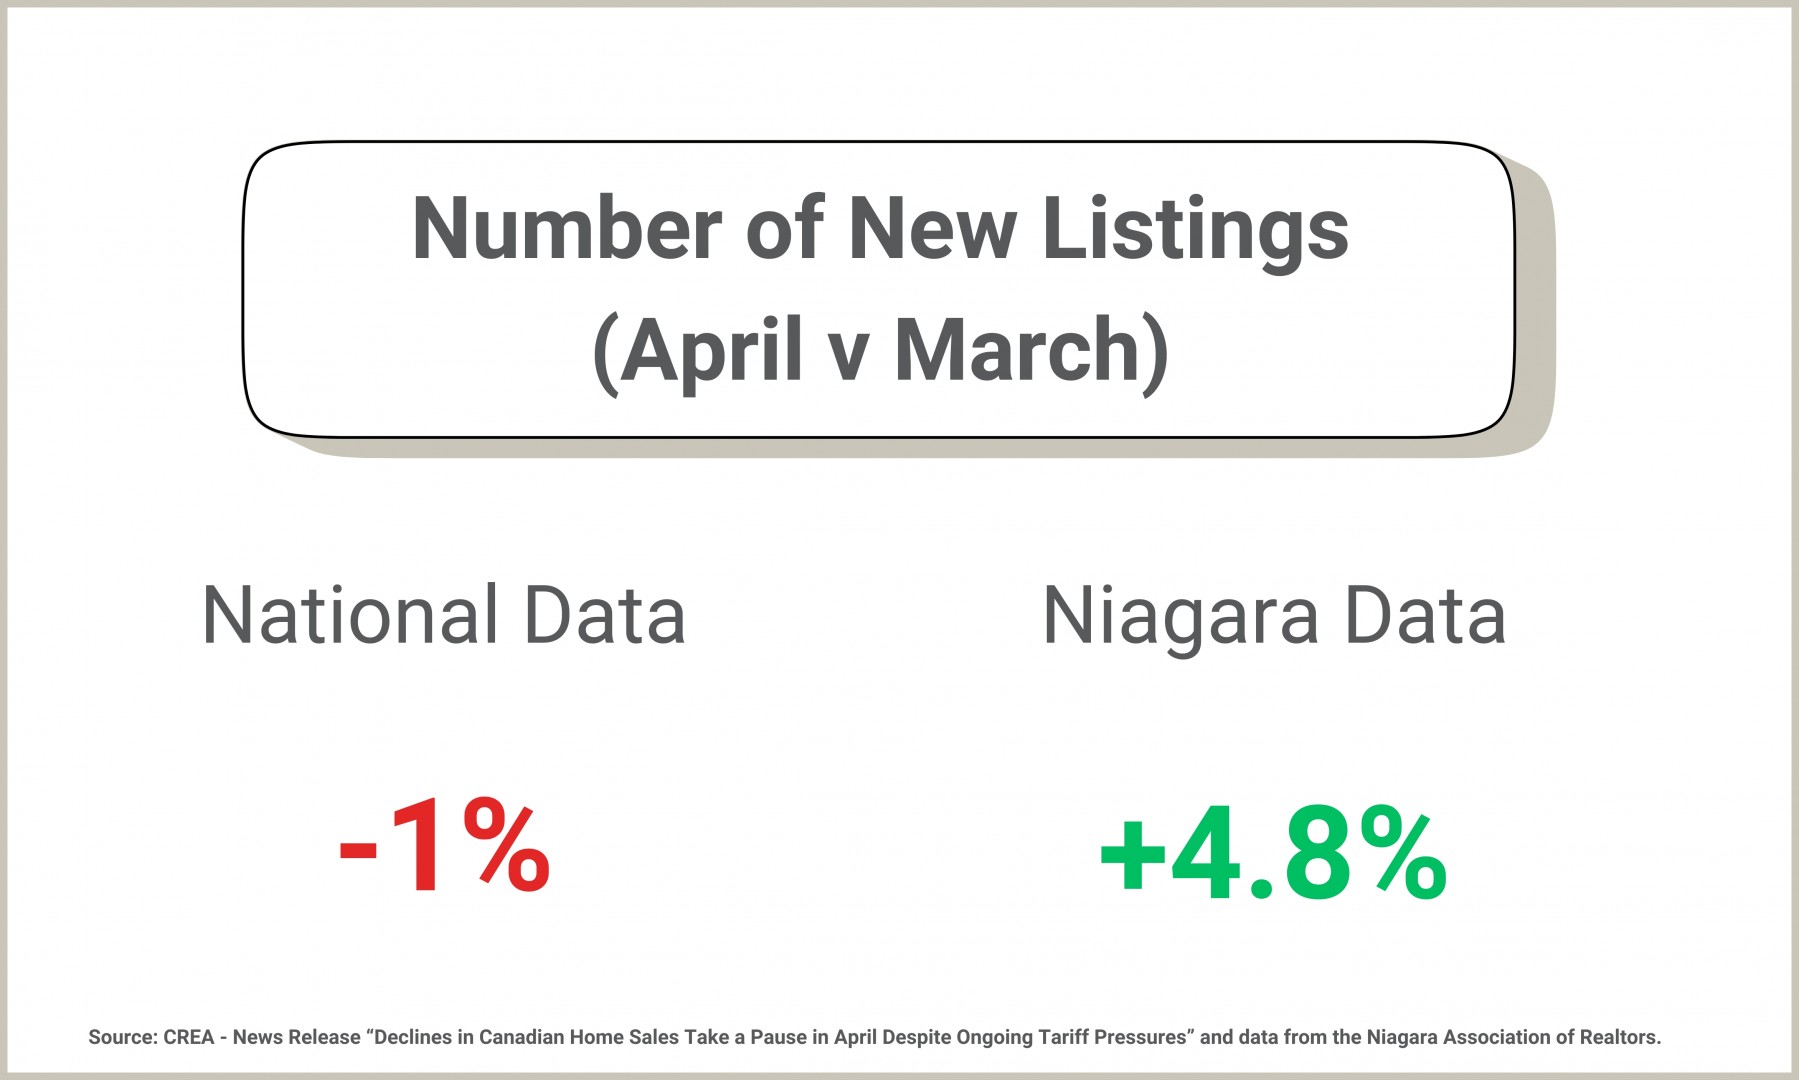
New Listing Inventory – Beware
Have you noticed more ‘For Sale’ signs out there these days? The fact is that we have record-high inventory this year, which is notable given that 2024 set new records that 2025 is currently topping.
The one challenge with “new listing” data is the prevalence of cancelled and re-listed properties. For example, the seller reduces their asking price from $799,900 to $769,900. Rather than amend the listing, the agent cancels it and re-lists it as “new”. That definitely skews the data, but it can also be used as a gauge of overall market health.
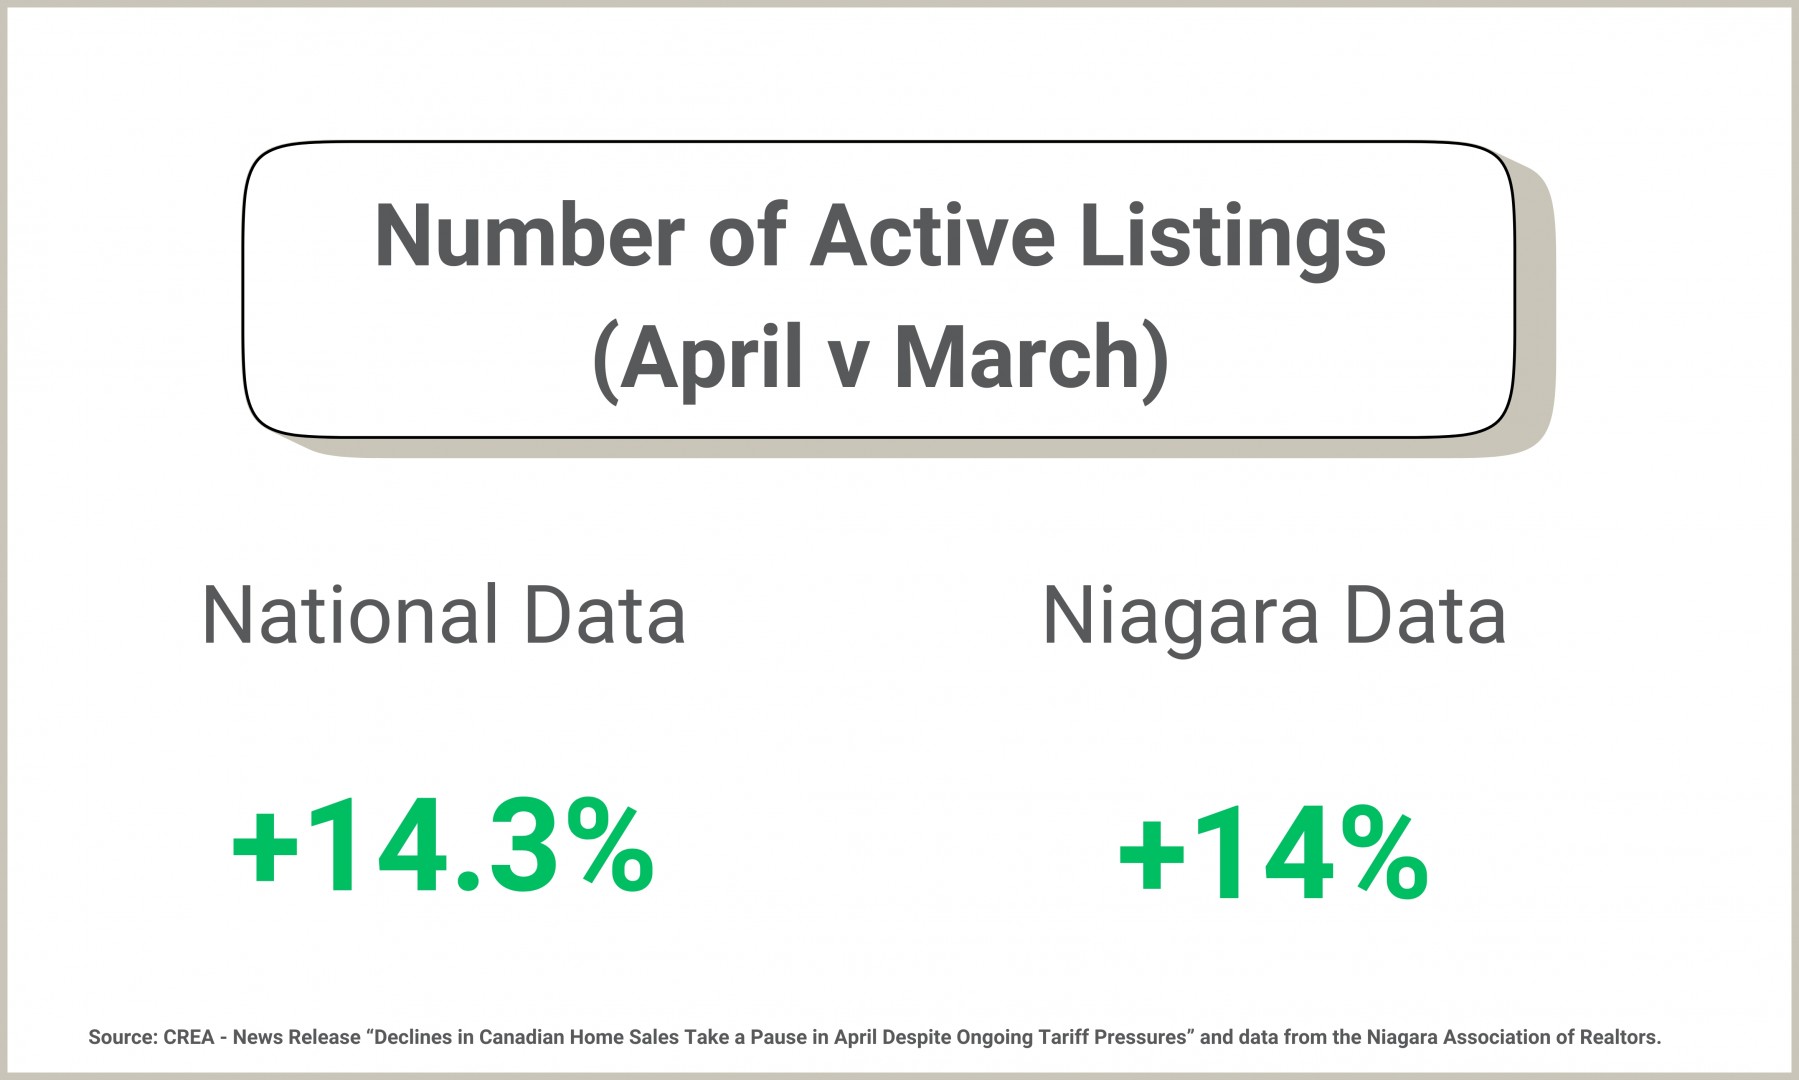
Number of Active Listings – Record Highs
With sales down this year compared to 2024, it is not surprising to see that we have more active listings this year. Both the national and regional numbers came in very close to each other, which shows that the overall market conditions are quite similar. Currently there are slightly more than 3,200 active listings in Niagara, which is considerably higher than the 10-year average of approximately 1,900 listings.
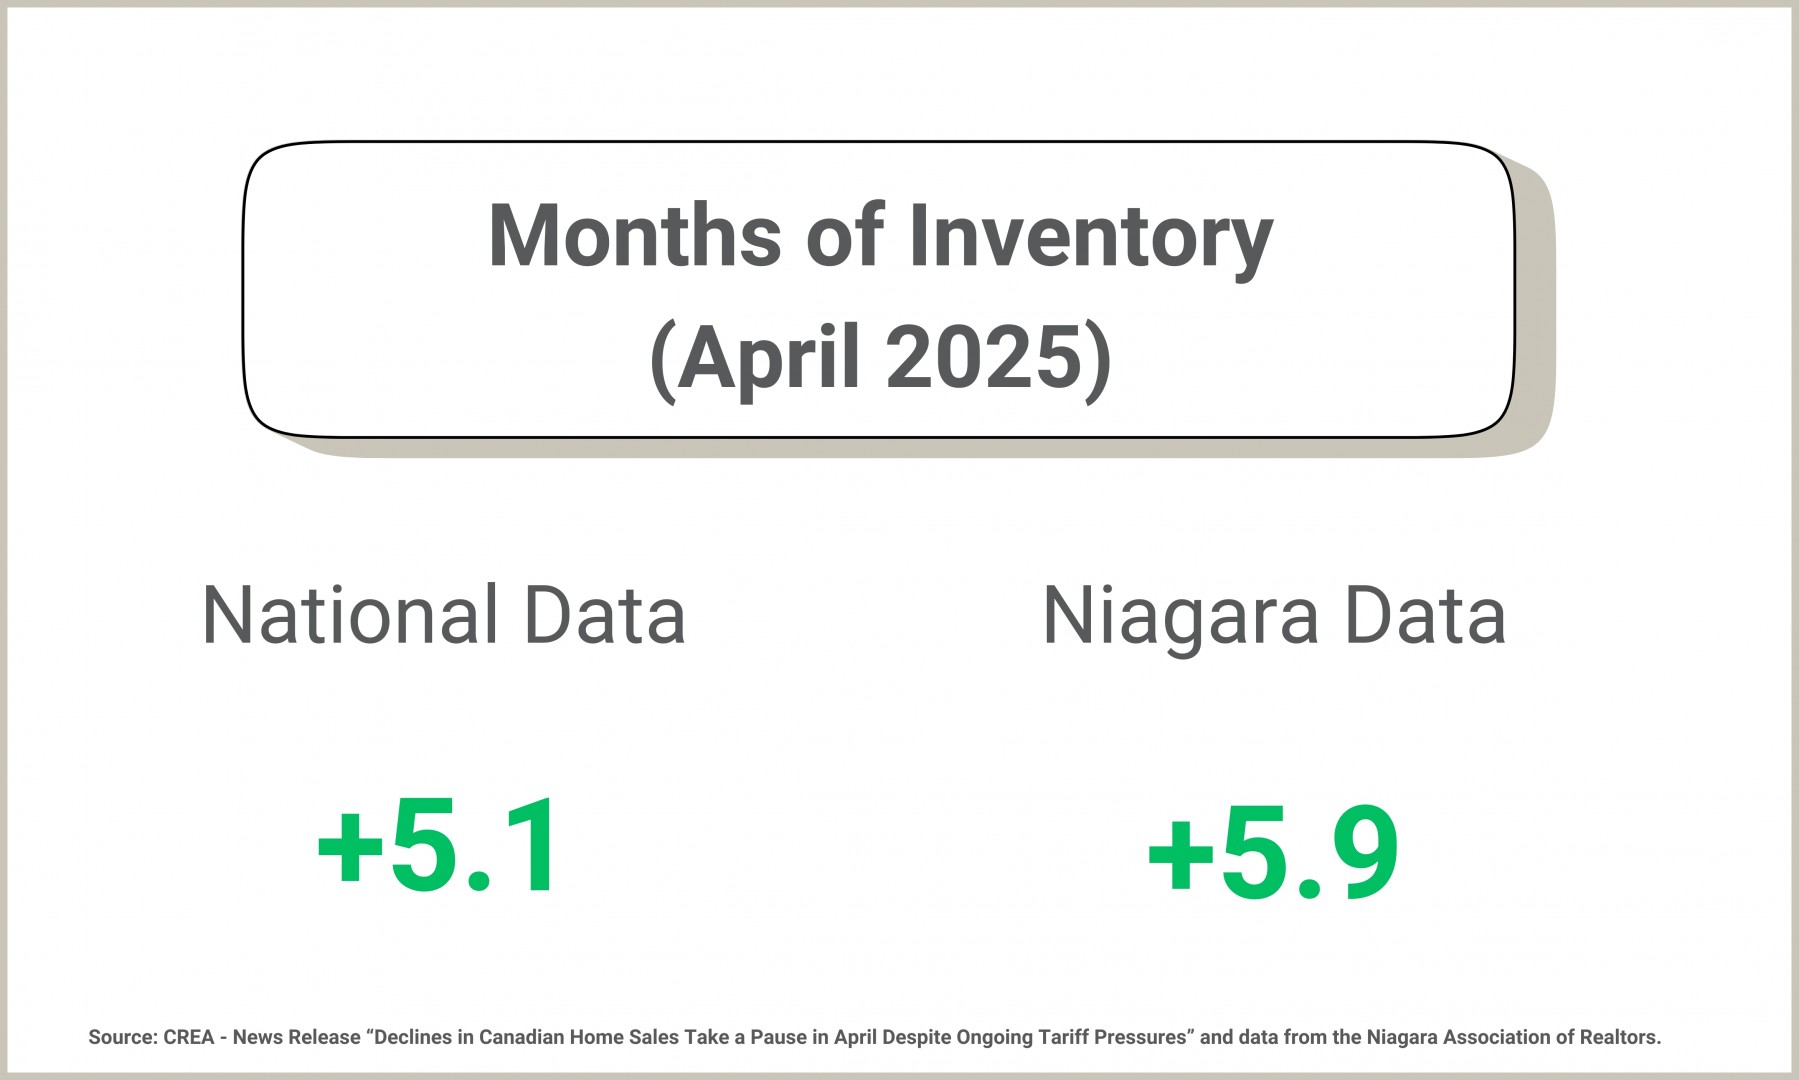
Months of Inventory – A Buyer’s Market
Months of Inventory is a quick way to assess the overall state of the market. In a nutshell, the number represents how hungry the buyers are, or aren't, to consume the available inventory.
While 2021 had a very low number (seller’s market), we are currently seeing MOI in the 5 and above range for most of Niagara. The April number of 5.9 means that for the month, 1 in 5.9 homes sold—or put another way, 4.9 out of 5.9 did not.
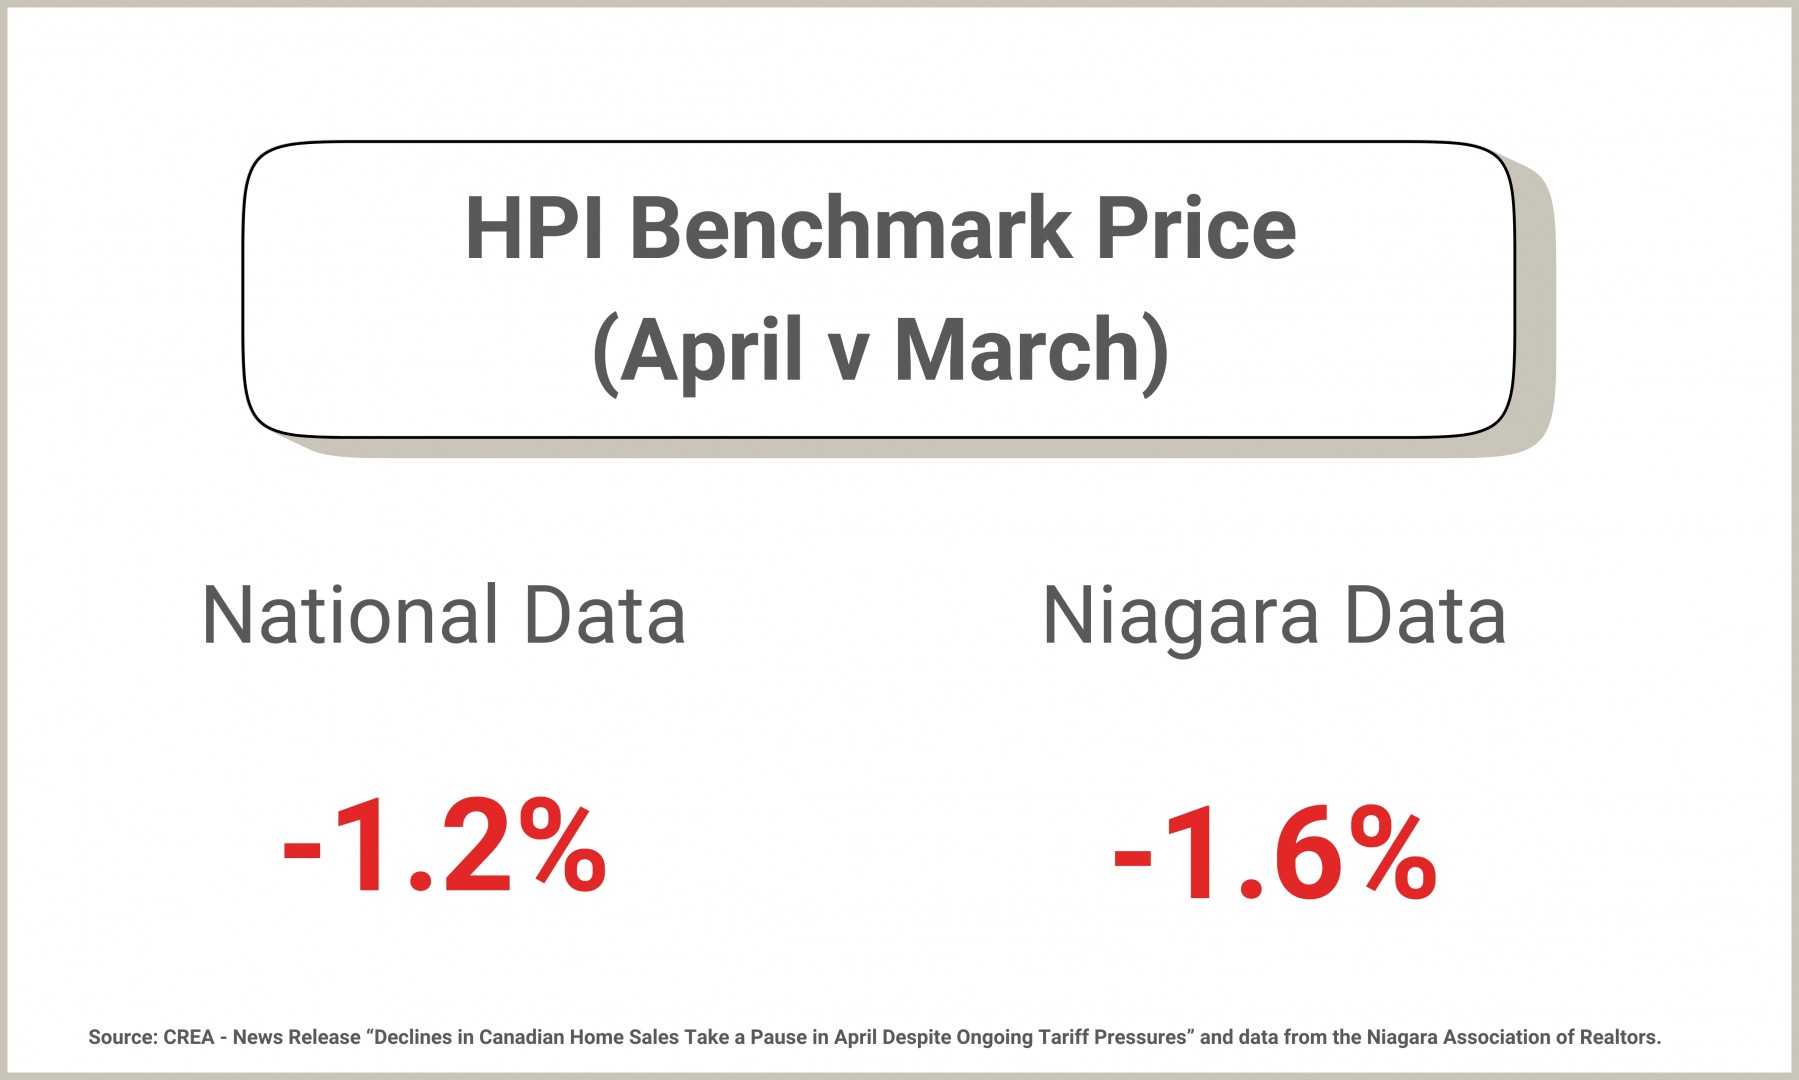
HPI Benchmark Price – Month Over Month
The Benchmark Price represents the “typical” house for a particular geographic region. In the case of Niagara, that typical home is a 1,266 sq.ft., 3-bedroom, 2-bathroom, detached home with a full basement and a garage. Looking at this data alongside the average and the median will help show the underlying trends.
The Benchmark Price for Niagara in April came in at $617,000, while the average was $702,000.
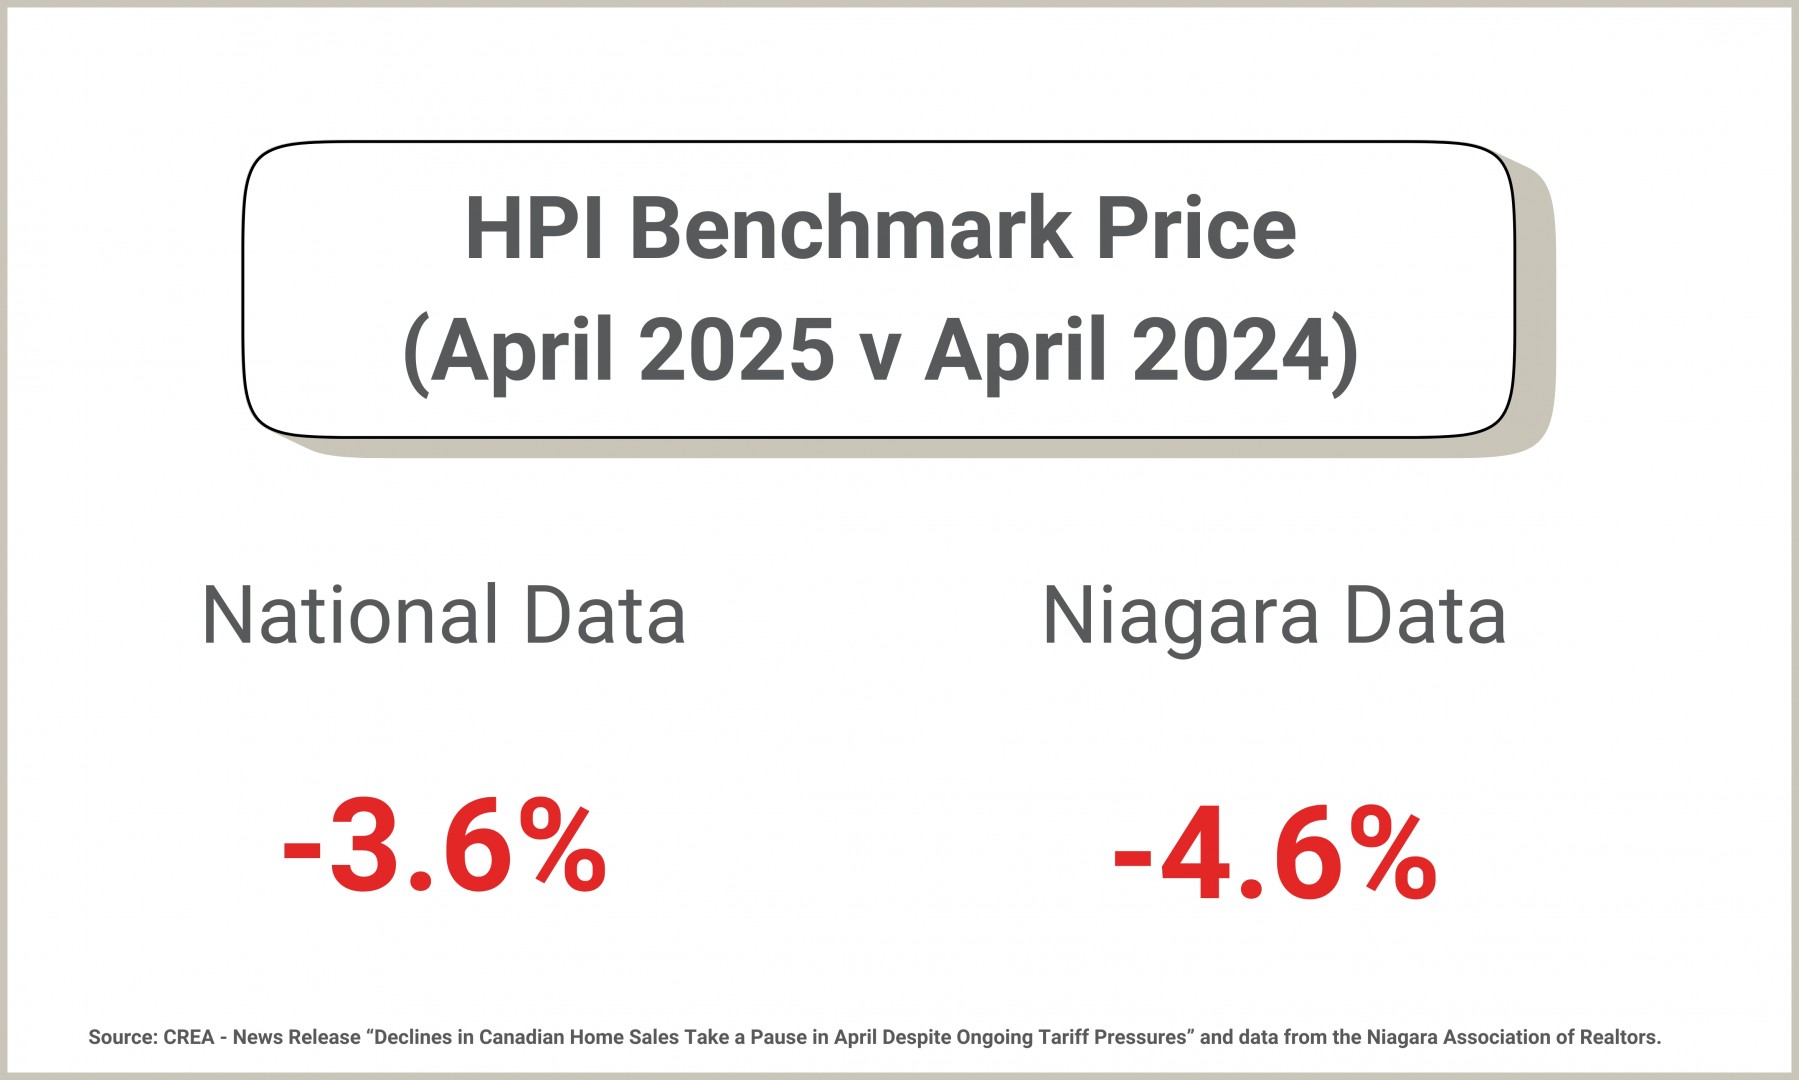
HPI Benchmark Price – Year Over Year
The abundance of supply, along with reluctant demand, has certainly put downward pressure on prices. April 2025 came in relatively flat in both the national and regional numbers.
For Niagara, April 2024 was $647,000, which was the range that it remained for much of the year. Here in 2025, April continued a month over month declining trend, after the year started at $637,000.
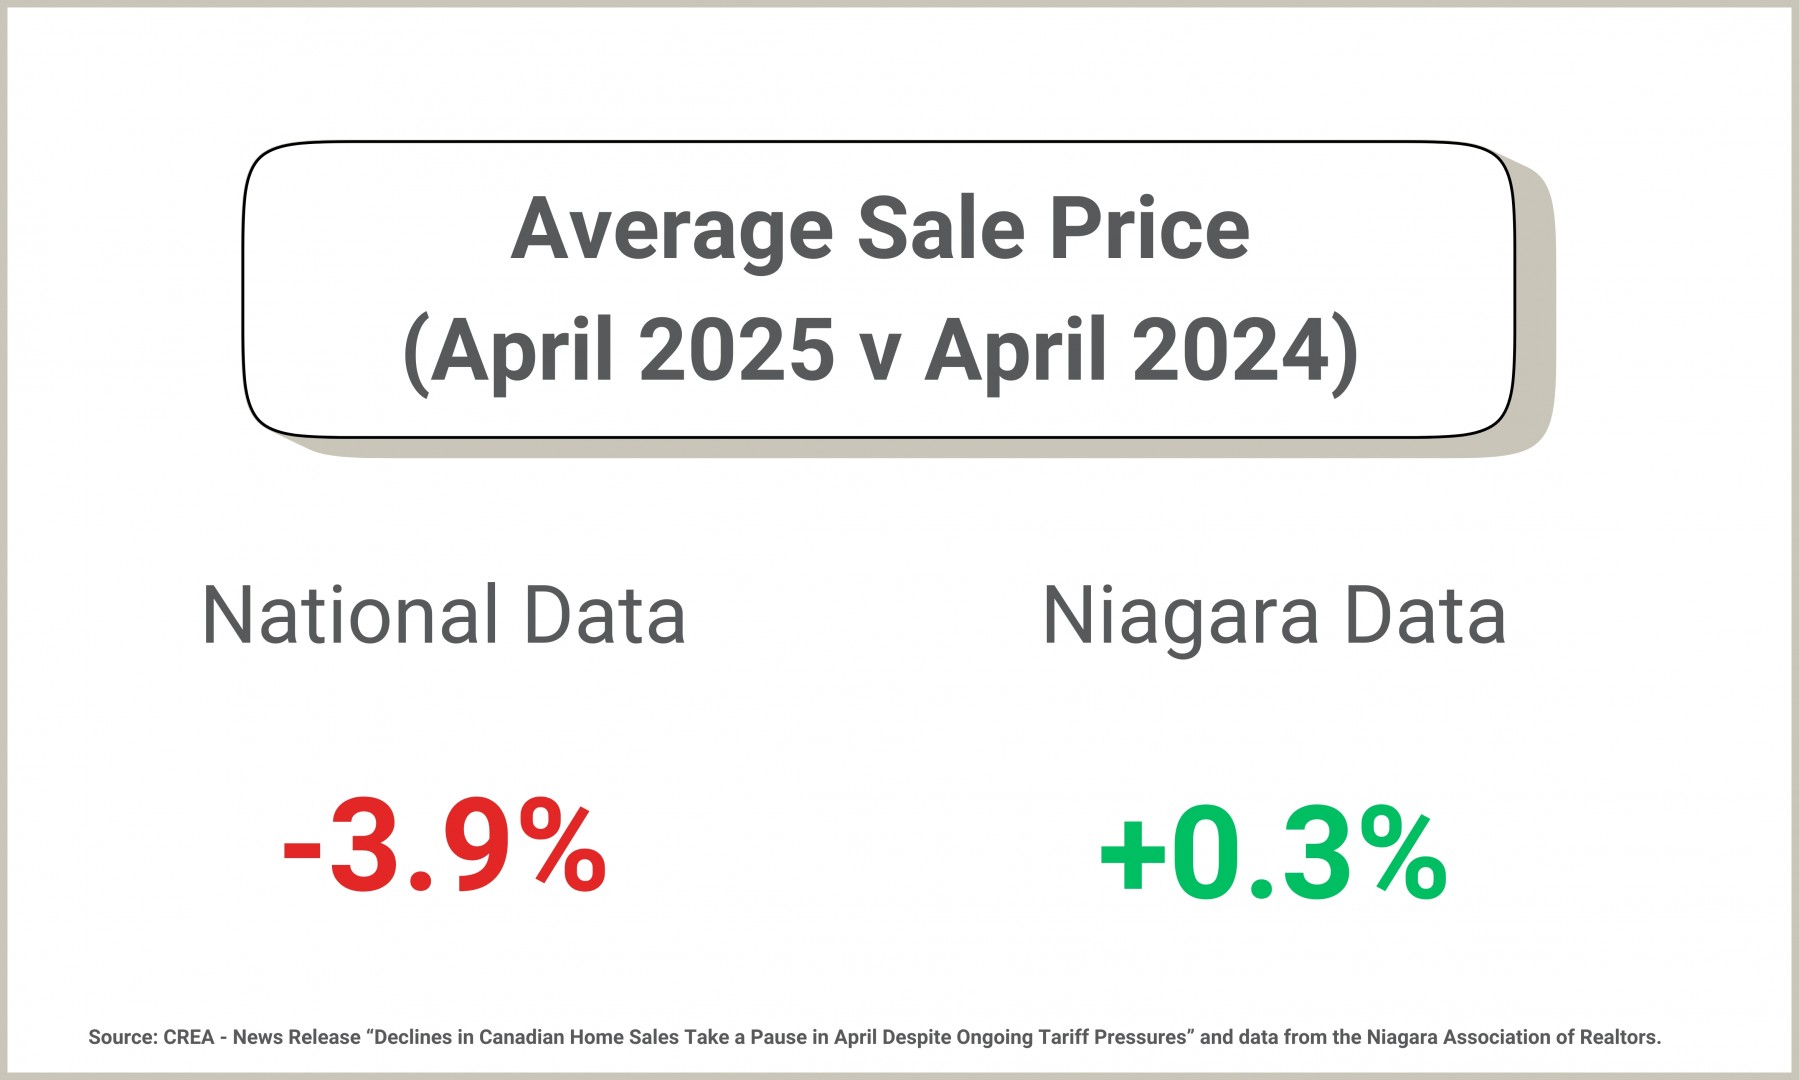
Average Sale Price – year over year
Again, as an example of why HPI is an important tool to use alongside the average, Niagara’s average sale price came in at $702,000—no less than $85,000 higher than the HPI. The reason the average was so high was due to seven sales over the $2 million mark, and no less than 67 sales over $1 million.
Meanwhile, the national average came in at $680,000, nearly 4% lower than April 2024.
Overall, the market has been stuck in a holding pattern with elevated supply, timid demand, and inconsistent pricing that is causing some confusion in the marketplace.
Stay tuned and check back again later. If you are in search of any particular market info, please feel free to contact us anytime.
Thank-you for visiting. :)