

Is the market staging a comeback?
Taking a quick look at the numbers and trends, even the most amateur of statisticians (that's me) could argue it is.
For this update, let's have a look at 3 core pieces of the data:
- the number of homes sold
- the number of homes listed for sale
- average sale price trends
There are a few ways to look at those numbers. One thing we find helpful is to look at sales versus new listings (demand v supply) as well as sales versus the 10-year average. Or in other words. if the 10-year average is considered a look at what is normal (in a way), then how did this year, or particular time frame, compare to that.
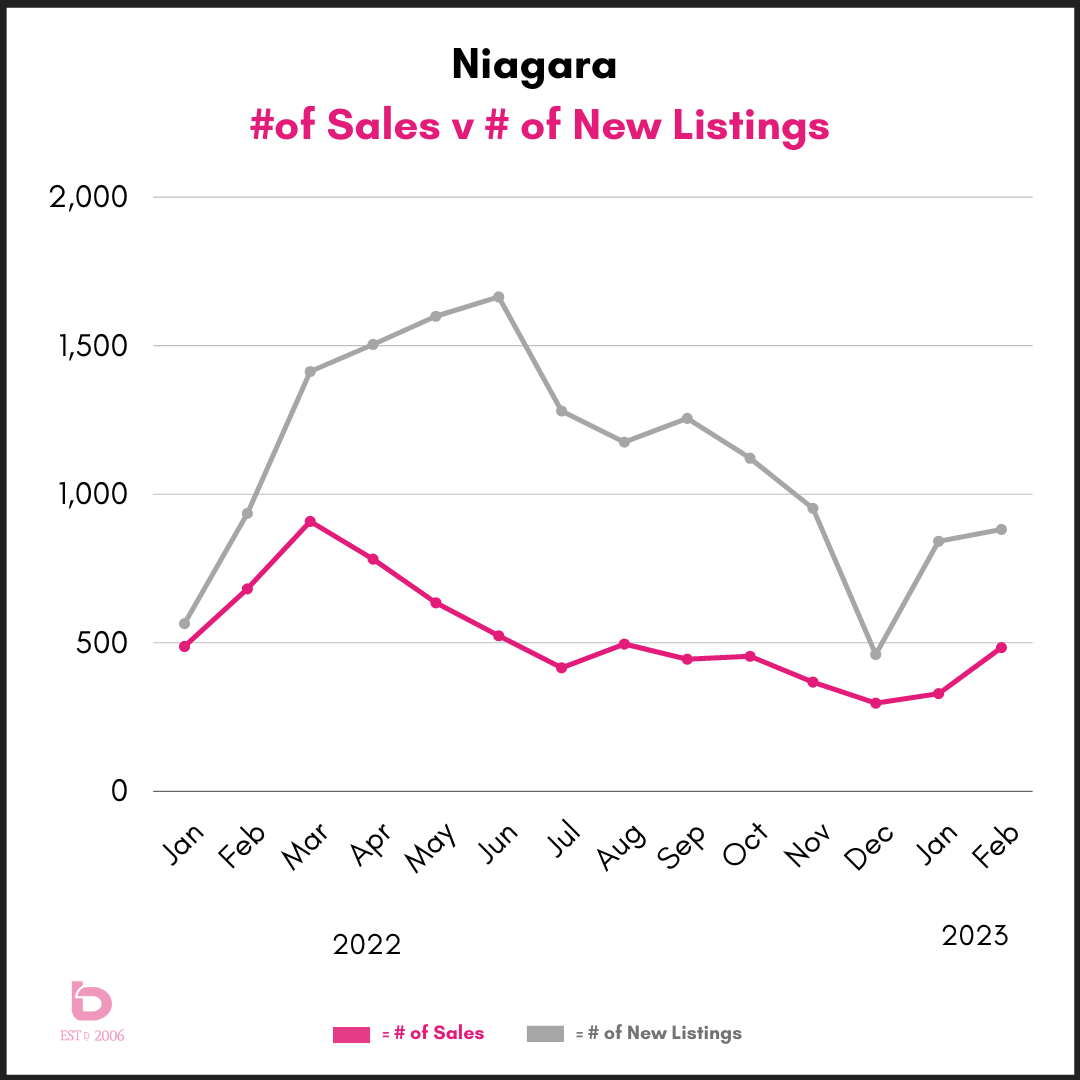
SUPPLY v DEMAND
This graph looks back to early 2022 for the number of sales (in pink) compared to the number of new listings (in grey). You can see how tight early 2022 was which resulted in a massive sale price spike. Then the shift hit the fan through the summer as listings piled on at the same time that buyers retreated for their cottage chairs.
2 notable things have happened so far in 2023:
- the number of new listings have not jumped to unhealthy levels which has helped maintain a reasonable supply & demand balance
- the number of homes sold (and buyer confidence) has improved
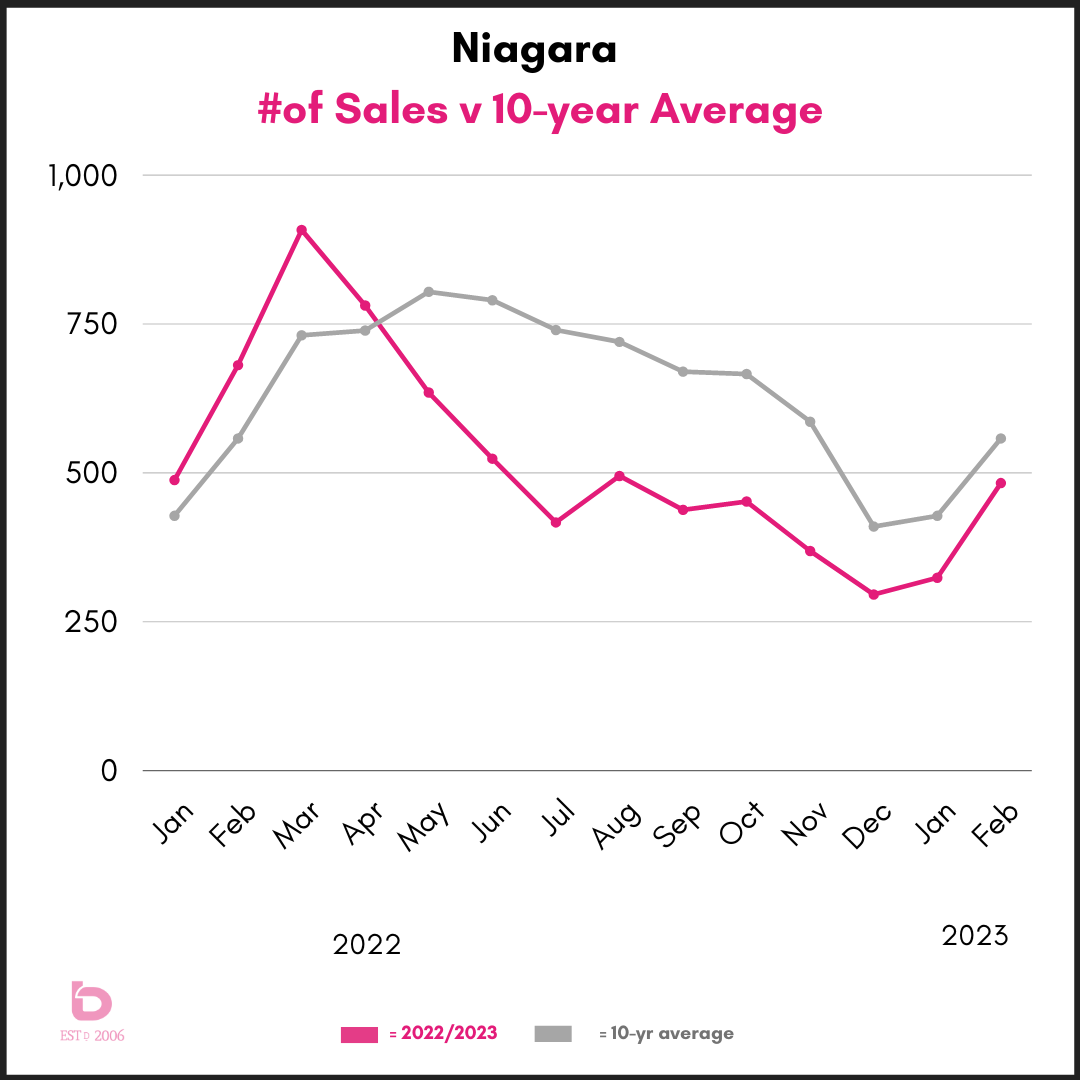
DEMAND v THE 10-YEAR AVERAGE
"How are home sales these days?"
Look no further.
This graph shows you how demand has performed in comparison to the 10-year average going back to January 2022. Again, as expected, early 2022 was a monster market, as demand outpaced almost everything. As we settled into the lethargic summer market, sales were running 28 - 44% below the 10-year average.
As mentioned, above, the monthly trends have shown notable improvement in buyer demand.
In fact, February was only 13% below the 10-year average, making it the best month (in comparison) since May 2022.
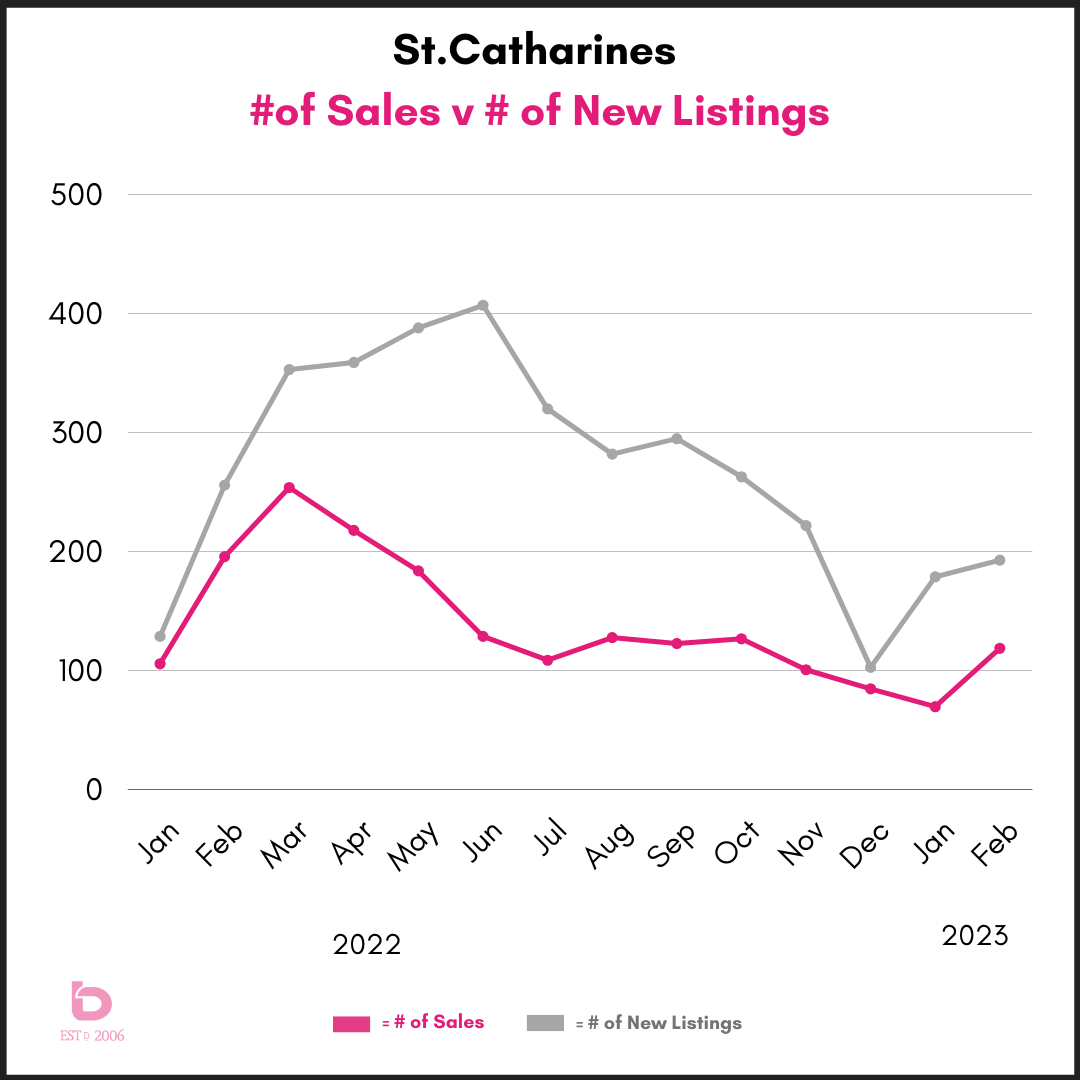
LET'S LOOK AT ST.CATHARINES
Look familiar? The same trends for supply (in grey) & demand (in pink) were found across the Region, so here is St.Catharines as another example. .
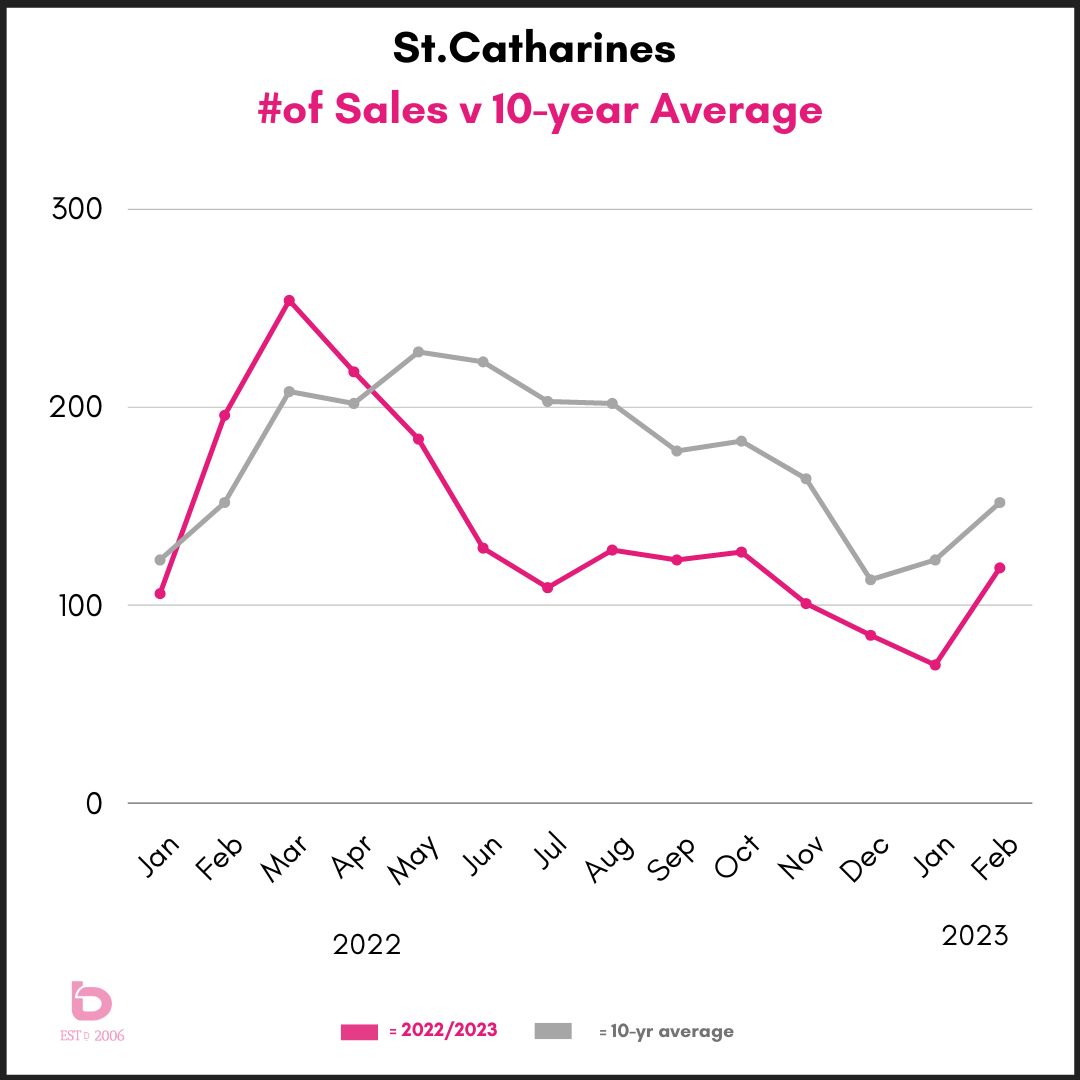
How about demand versus the 10-year average?
Similar to Niagara, the number of homes sold in February 2023 was the best monthly performance since May 2022. After 8 consecutive months of sales being 25 - 45% below the 10-year average, February 2023, at 22% below, was a relative victory.
HOW ABOUT HOME PRICES?
If you have tried to buy tickets for a big concert or a playoff sporting event, you're well aware of demand outpacing supply. The result in that scenario is an $800 ticket to see Beyonce.
As demand (buyer confidence) has improved here in early March 2023, we have seen average sale prices track along in sync. In general, pricing trends have resembled a gentle V.
This graph shows sale prices for the Niagara Region, St.Catharines, Niagara Falls and Welland:
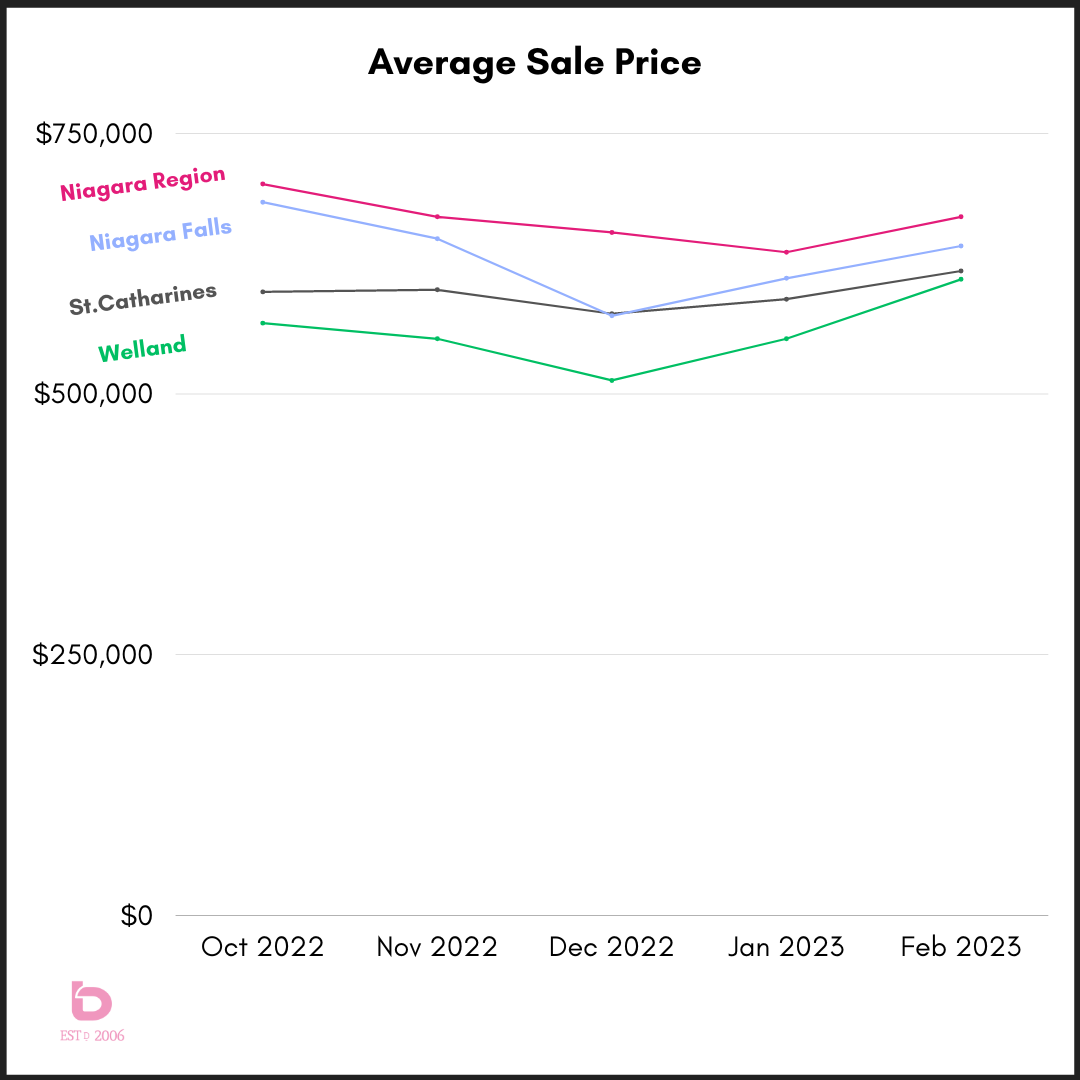
In general, December 2022 appears to be the low for price trends. Current values are similar to where we were back in August - October of last year so of course, not at the historic highs of early 2022, but still trending in the right direction.
We hope you've found this helpful. Of course, we will keep you updated and in the loop on the latest and greatest market info.
CLICK HERE TO BOOK A CHAT OR EMAIL US