

What’s happening with home prices?
It turns out my high school economics teacher was correct. Sale prices will track directly in relation to the relationship between supply and demand.
Whether it’s Air Jordans, Taylor Swift tickets or a vintage Ferrari, if something is in limited supply with a line-up of people looking to buy them, then the prices will go up. Look no further than the Niagara real estate market in early 2022 for a prime example of that.
On the opposite side of the coin, there aren’t exactly legions of people on the horizon looking to buy my used Chuck Taylors.
Turn the channel to the Niagara real estate market and you’ll see more examples.
Niagara Region
Number of New Listings in 2023
While the actual number of new listings have been increasing month to month, there are two things to know.
- They should be. From January to April, a decline in new listings from one month to the next is rare.
- They’re actually decreasing in comparison to the monthly norms (10-year average).
Number of Sales in 2023
Similar to new listings, the number of sales have been increasing on a month to month basis however with one big difference when compared to new inventory.
January 2023 was a terrible month for sales in Niagara. With only 328 homes sold, that was 23% below the 10-year average and the worst on record in the last decade.
The good news is that while February, March and April were all below average, they have been improving.
This graph shows it well. The green line represents the 10-year average. The grey line is the number of new listings while the pink line is the number of sales.
For example:
10% above the green line = 10% above average
20% below the green line = 20% below average
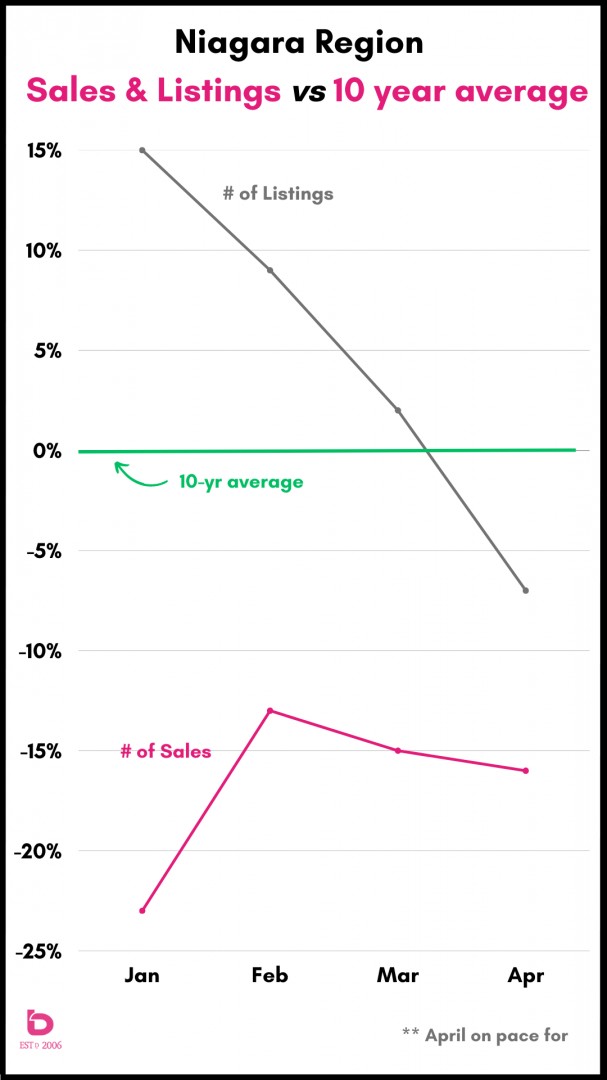
Going back to the Air Jordans and Chuck Taylor scenario, the Niagara Region has two things happening.
New listing inventory is declining on a monthly basis in relation to the 10-year averages.
The number of homes sold increased into February and then has been in a holding pattern over the last 90 days.
The result?
Prices have been easing up about 3 – 4% per month from $637,000 in January to $727,000 here on April 24th.
St.Catharines
St.Catharines has the dubious distinction of being in the negative for both new listings and sales so far in 2023.
How negative?
This graph shows new listings and sales in relation to the 10-year average. While new listings have slowed their pace (from 8% below average in January to 25% below average in April), the number of sales has improved from a dreadful 45% below average in January to a much-improved 13% below average in April.
Have a look:
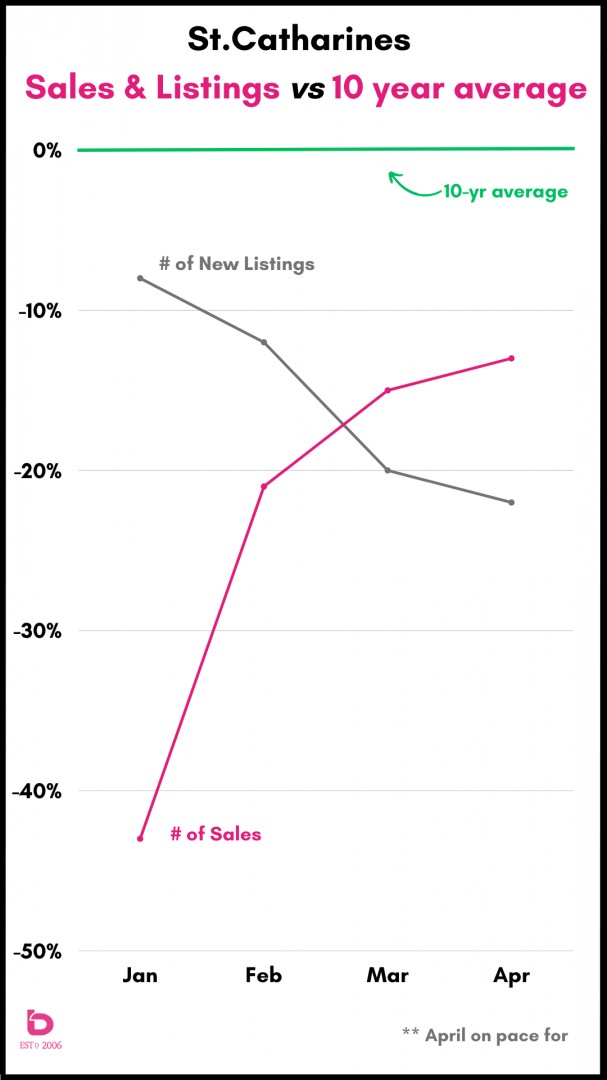
Notice the declining pace of inventory (grey line) being surpassed by the increasing pace of sales (pink line).
The result?
You guessed it. The average sale price n St.Catharines has climbed back up from $591,000 in January to the $660,000 range here in April (as of April 24th). That is where the market was back in June 2022.
Niagara Falls
With so much of the demand in Niagara Falls being investor driven, volatility is not a unique market condition here. It is fair to say that demand has been more Chuck Taylors level as opposed to Air Jordans.
Have a look here. While new listing inventory has been dragging the last 90 days, sales have been increasingly underwhelming.
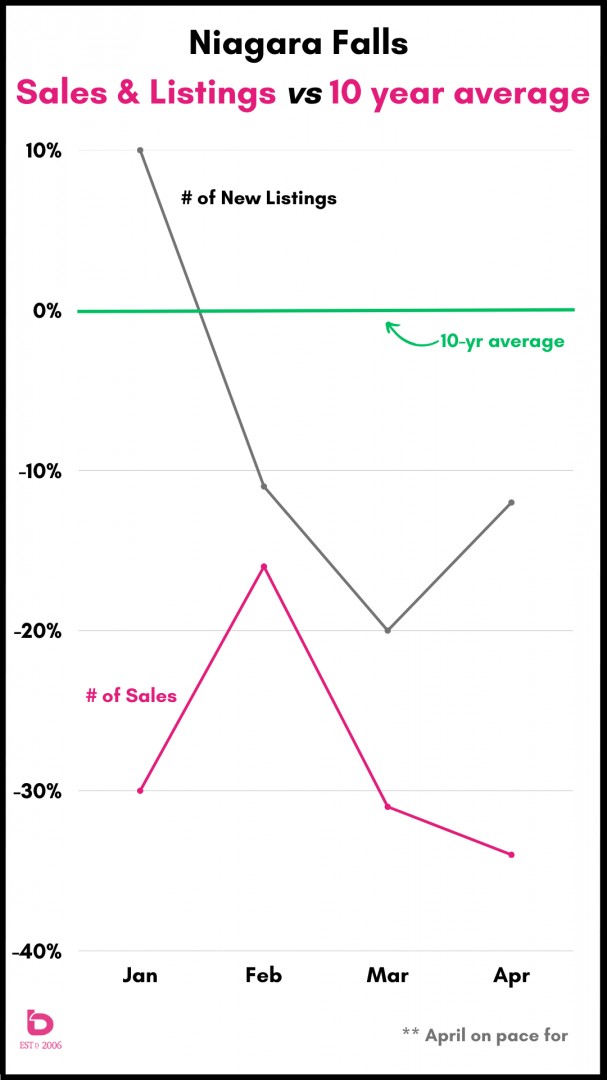
The result?
After monthly average sale price increases in Q1, April has taken a step back from March which shouldn't be overly surprising given that sales were off 31% in March with April being on pace to be off by 34%.
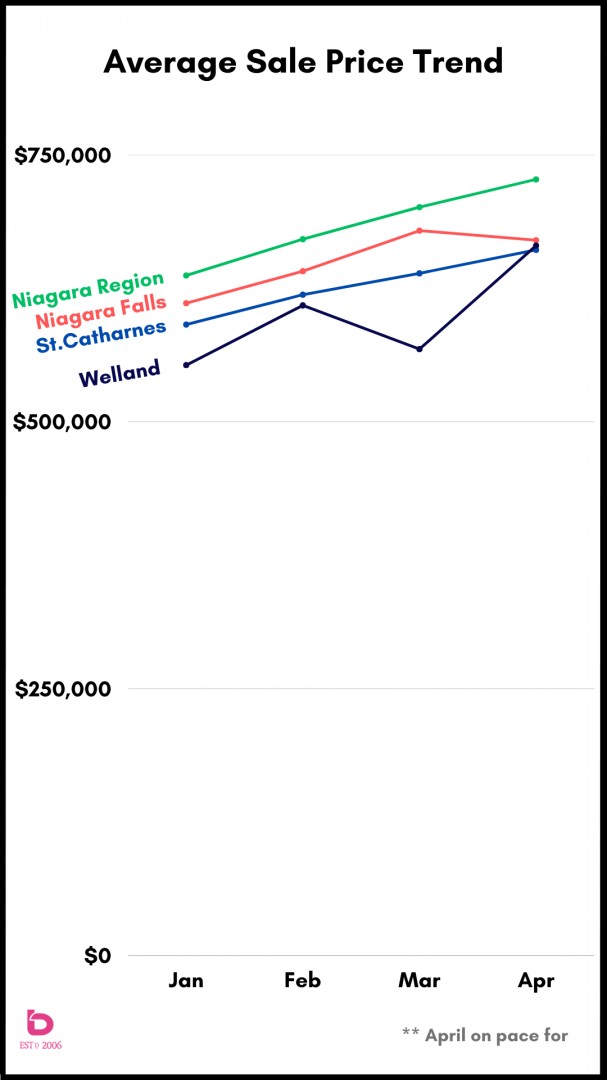
Sale Price Trends
This simple graph shows the monthly average sale prices for January through April for the Niagara Region, St.Catharines, Niagara Falls and Welland.
What happens next?
It will all depend on the supply of listings and the number of people who want to buy them. Given that April is typically the most important month of the spring market, we may be looking at a lukewarm summer in terms of overall market activity. That doesn't mean declining prices though. Even if demand runs in negative territory, if the supply of listings runs at a similar pace, prices will sustain themselves or as we have seen, continue to edge up.
A final thought.
The market is very inconsistent. From one area to another or from one type of home to another, there are varying levels of demand. As a result, this report (or any other) shouldn't be used as a definitive look at your home. If you'd like a report specific to your home or an investment property, please do not hesitate to contact us. We're here and happy to chat.
Thank-you for reading. :)