

WHAT IS HAPPENING IN NIAGARA?
Real estate is a spectator sport for many of you. Some are on Realtor.ca on a nightly basis even though you have no intention of moving. Others like to track what is happening purely from an investment and value perspective. As a result, we are asked this question a lot...
"So....how's the market doing?"
We're asked at parties (remember those!?), when out on a walk, at the grocery store or in the chair at the dentist. Real estate has always been a popular subject to chat about but these days it is on a whole other level.
So, let's have a closer look at the numbers and what is going on out there. It's worth noting that one of the biggest factors that contributes to the market (and data) is the general psychology of the marketplace. Those subtle changes in the wind can knock a market on a different course with the new direction only showing it's true characteristics a month or two later.
For this bLOG, we're looking at St.Catharines specifically. Why? Because St.Catharines is responsible for the largest volume (# of sales) of any city in Niagara so it's a good litmus test of what is going on out there.
First, a key point to know. If you have been following any of our videos or bLOGs in the past few months, you'll know that March and April produced record # of sales for Niagara. And not just for those specific months but for any month.
Think about that... April 2021, a pandemic lockdown month, produced the single month record for the number of homes sold. Pretty incredible stuff. So, is the market correcting? Well, you could argue it's merely adjusting back to what could be construed as normal.
PRICING
This first graph shows you the weekly sales going back to March 1st. On a week-to-week basis, you can see that the average sale price has been higher than the average asking price. The consistency is pretty incredible. As many think things are changing, some of the data shows otherwise. And that is up to and including the week that just ended 2 days ago as of writing this (June 8, 2021).
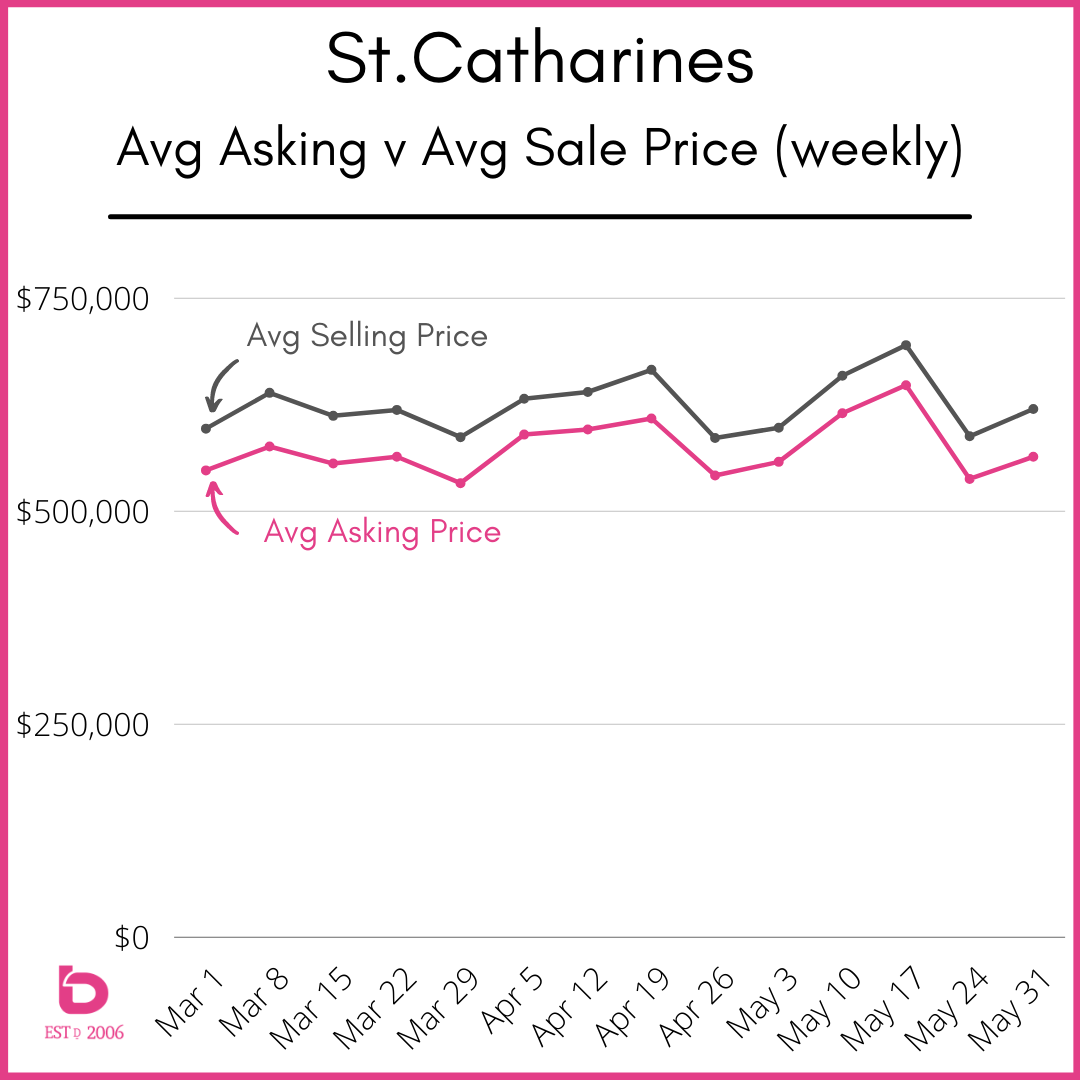
The Year-to-Date, the numbers are similar:
Average Asking Price is $575,500
Average Selling Price is $621,309
SELLING PRICE and # OF SALES
This second graph shows you how consistent that sale price to list price ratio has been.
How consistent?
On a weekly basis since March 1st, the average sale price has been between 107.2% to 110.9% of asking.
You will see in the graph too how strong April was in terms of the number of sales with 3 weeks posting more than 70 sales. That has only happened in 5 weeks so far this year with the other weeks being Mar 15-21 (82 sales) and May 10 - May 16 (74 sales).
Have a look here:
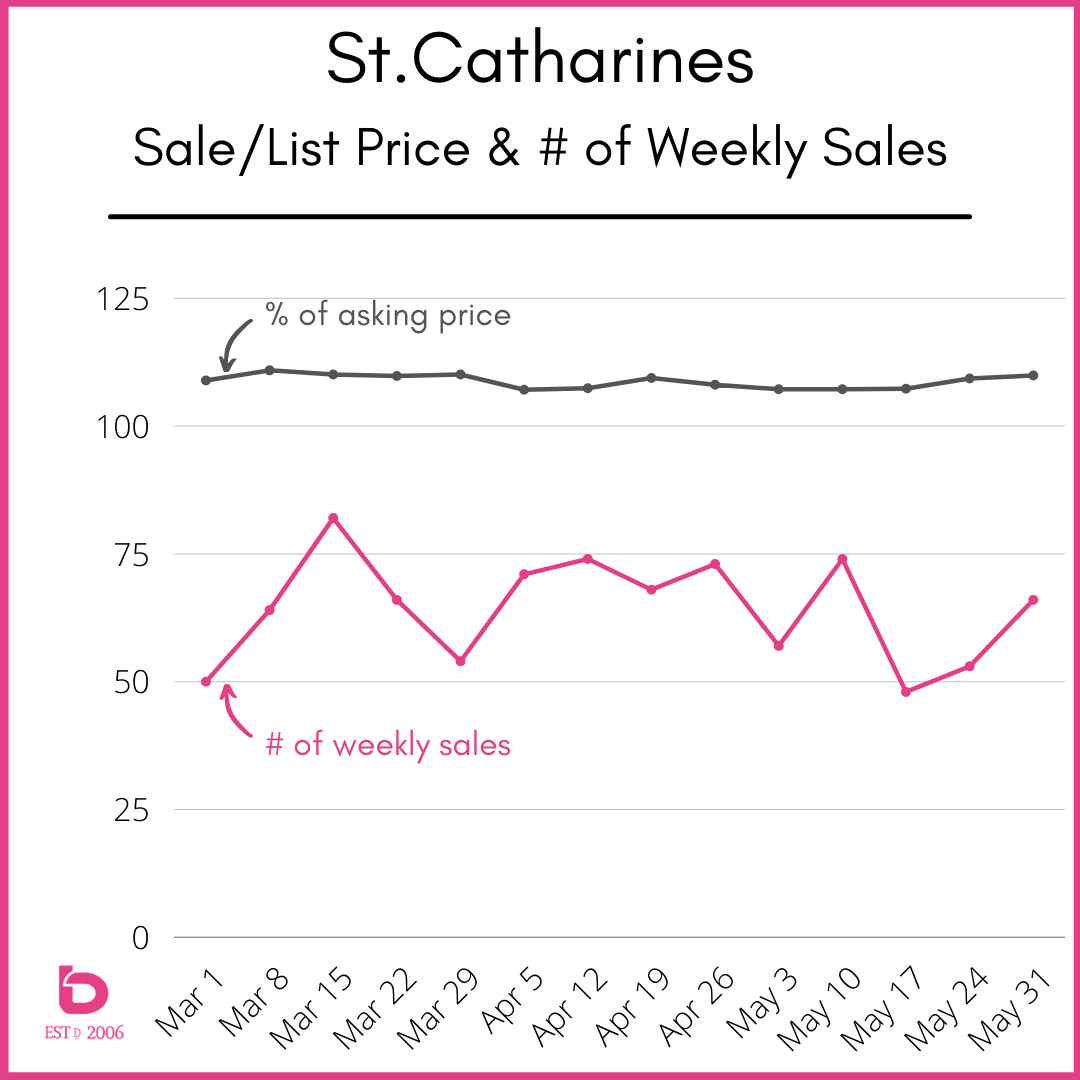
To put the strength of the last few months into context, if St.Catharines averaged 50 sales per month, that would be enough to set an all-time record in the annual number of sales. You can see in the above graph that only 1 week has posted less than 50 sales since March 1st and that was the 3rd week of May. So, pretty serious numbers in the grand scheme of things.
THE LAST DECADE
Context is important, especially when we've seen such outlier years like we have had in the last few years. One way to compare anything is to look at how the past behaved.
This next graph is looking at each month so far in 2021 and how it performed in comparison to the previous 10-year average for the same month.
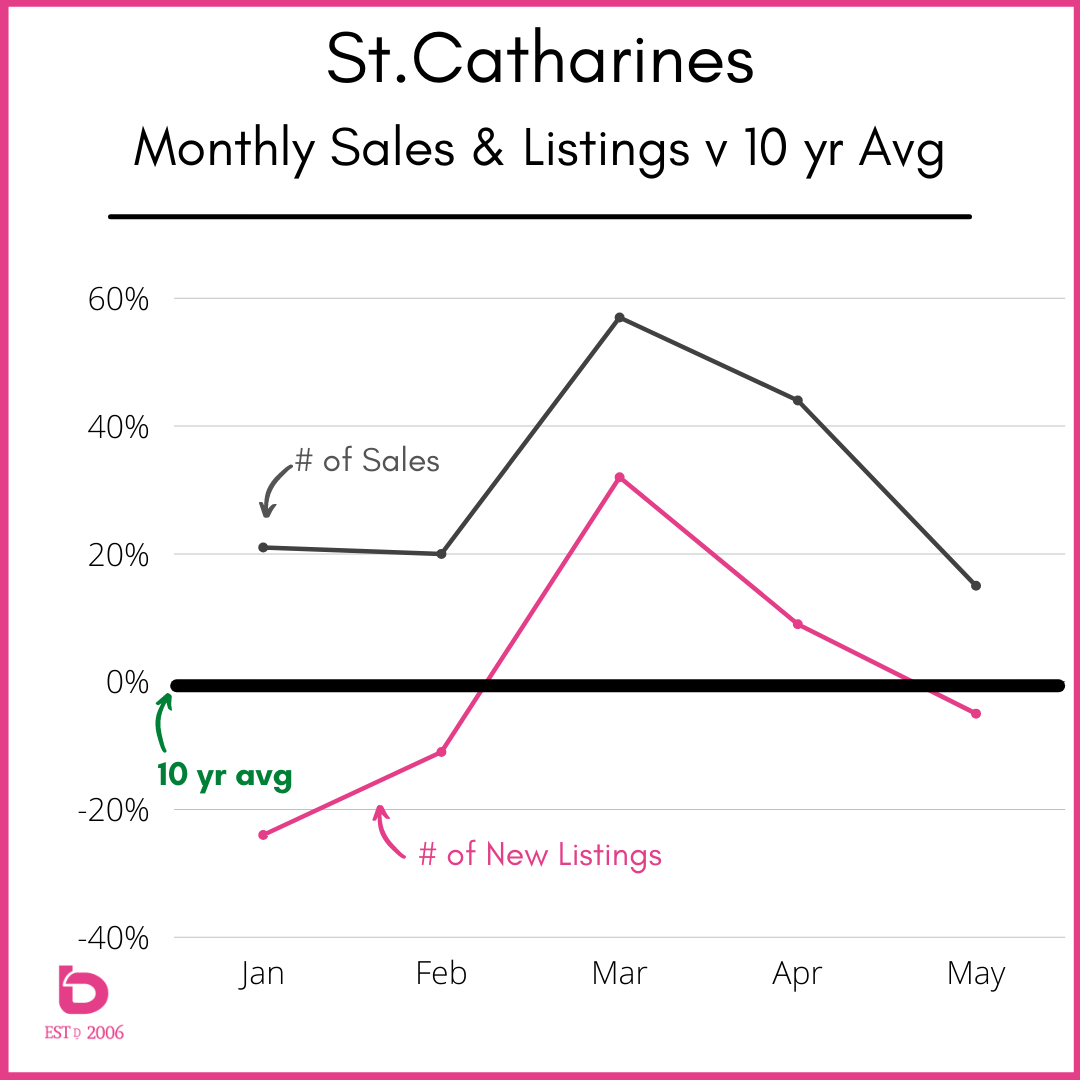
The thick black line represents the last 10 year average. So for example, in comparison to the 10-year average for the month of January (going back to 2011), January 2021 was:
Number of New Listings were 24% BELOW the average.
Number of Sales were 21% ABOVE the average.
So even though the number of new listings in March improved to 32% above the 10-year average, the number of sales were 57% above. No matter what battle the number of new listings showed (inventory or supply), the number of sales outpaced it (demand).
The result? The average sale price from November to January bumped up about 10% into the $620-630,000 range where it has been sitting ever since.
Looking at May, you can see a return to "sort of normal numbers" as the number of new listings have dipped back into negative territory while the number of sales are closer to normal at only 15% above the 10-year average.
WHERE DO WE GO FROM HERE?
All the data shows that we are simply returning to more normal volume. We'll continue to track the monthly and weekly data. Here are a few resources for you to check out:
Keep track of the numbers on our Market Insight Tracker
TOP 3 things to know about Niagara Real Estate: