

YIKES. WHAT A SUMMER!
Kind of like the "yikes" we said back in the spring market, but for completely different reasons. The quickest way to explain the difference is like this:
Imagine a fictitious neighbourhood.
Spring Market: 3 active listings with 16 sales in the last 30 days.
Summer Market: 16 active listings with 3 sales in the last 30 days.
For those visual learners, kind of like this...

I suppose the bLOG could end with that but if you’d like to have a further glimpse into some of the numbers, read on…
NUMBER OF HOMES LISTED FOR SALE
First, for any August 2022 numbers, they are "on pace for" as of August 23, 2022.
The supply of new listings, along with how many people want to buy them, are the factors that drive any market.
Let's first look at the general trends for the NIagara Region and the various municipalities:
From January through June, every month to the next had an INCREASE in the number of homes listed for sale. That doesn't normally happen.
That build up collided head on with plummeting demand.
…let's keep going…
For the Niagara Region, April, May and June had the highest number of new listings ALL-TIME for those specific months. At least for the last 20 years.
This graph shows the monthly number of new listings for 2022 (in pink) along with the 10-yr average (in grey):
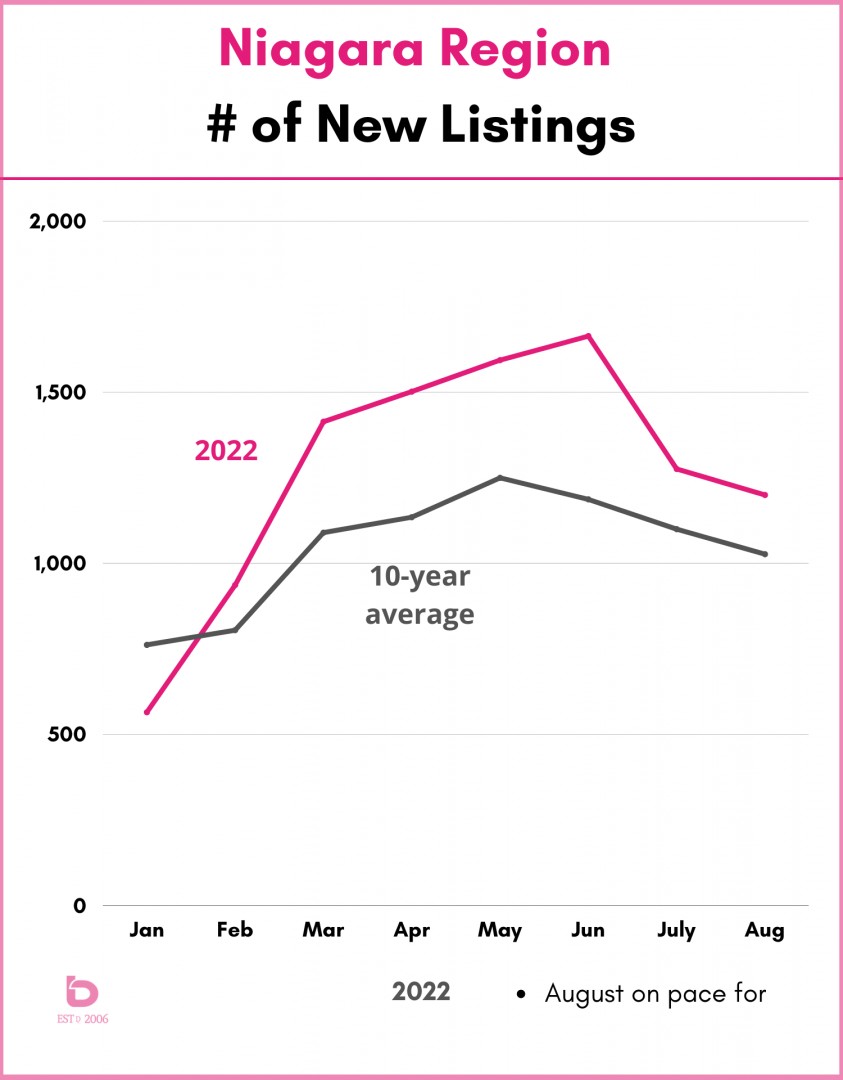
Unless there is a significant amount of demand out there, that build up of supply is going to cause some issues.
NUMBER OF HOMES SOLD
Demand, also known as how many people want to buy "x", is the other market driver.
Let’s get right to Exhibit A. The demand graph (number of monthly sales) for Niagara for 2022 resembles a black diamond ski hill.
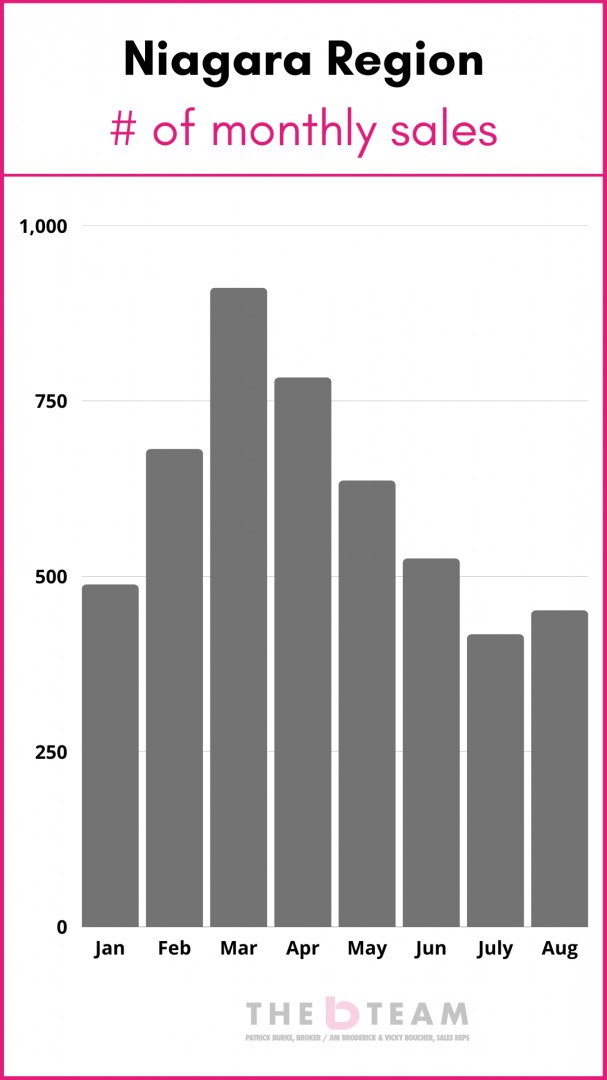
That very clearly shows how drastically the winds of the market changed. We went from running 25-30% above market norms in the spring to sitting 30-50% below market norms in the summer.
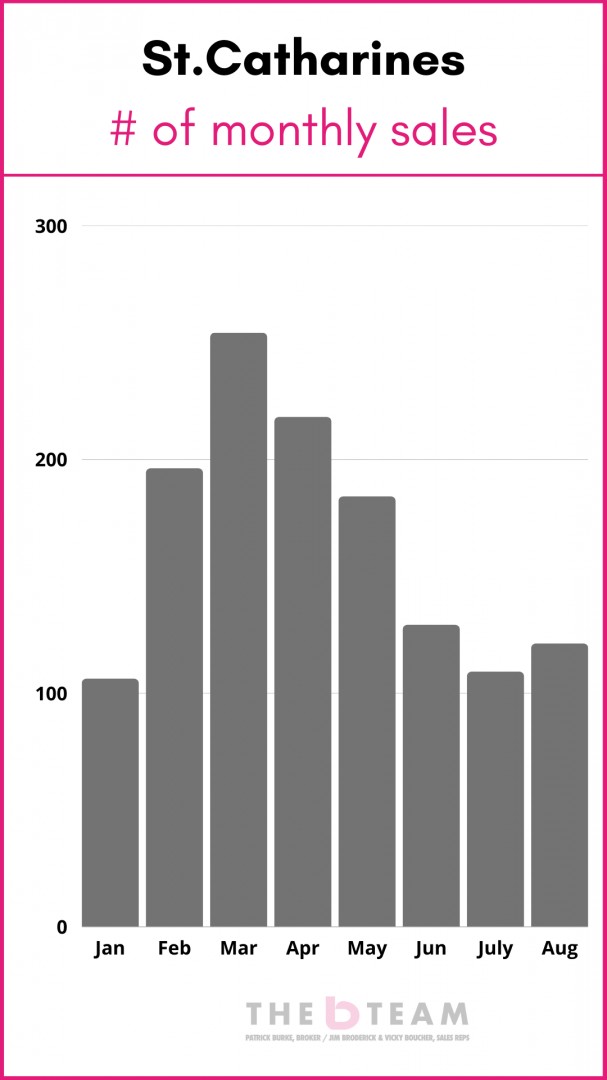
The same story continues across Niagara. For example, here is St.Catharines:
In no uncertain terms, the summer market data has been underwhelming. A few examples…
July 2022 produced historically bad sales numbers. Excluding December & January (2 slow months in any market), July 2022 had the 2nd lowest number of monthly sales, only behind the COVID KO’d market of April 2020.
You read that correctly. July 2022 was 2nd worst, only behind a market that was completely frozen due to the onset of a pandemic. In rough numbers, the number of homes sold in July 2022 were nearly 50% below the 10-year average.
August? While a small improvement over July, August 2022 is on pace to settle in 38% below average (as of today, August 23rd).
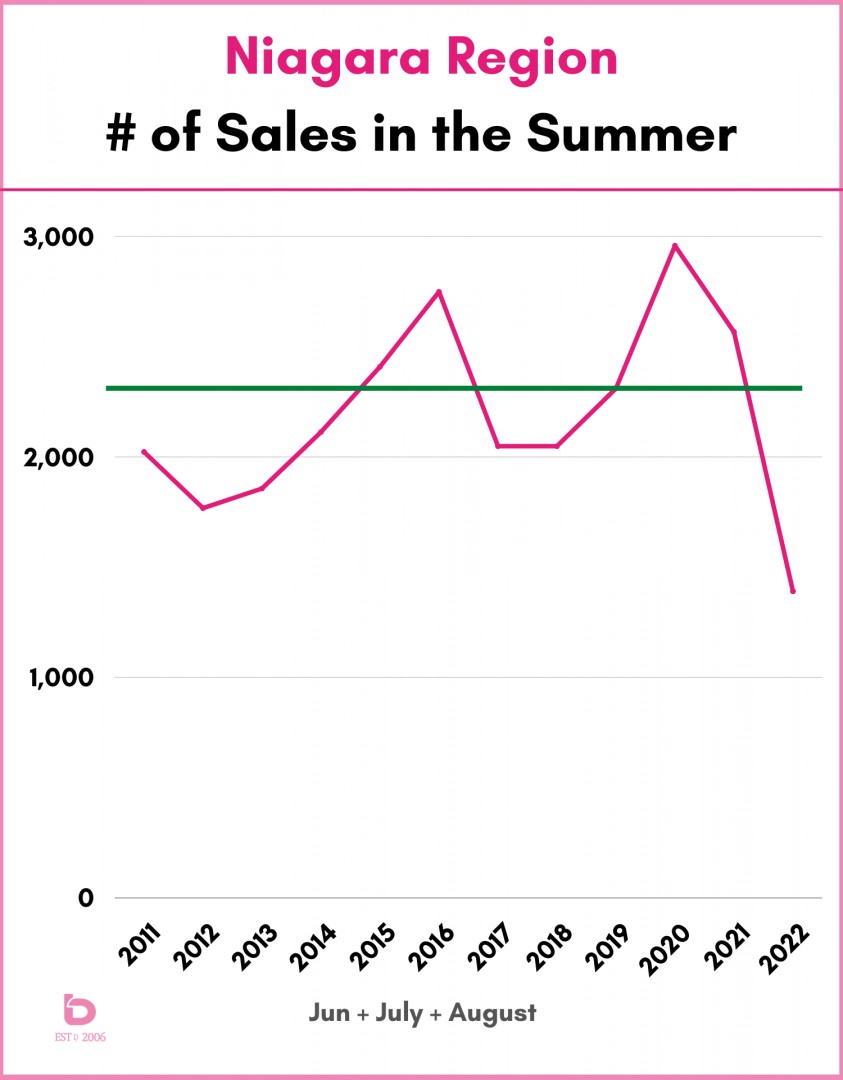
June? Same deal…
This graph shows you exactly how weak this summer has been. This is the number of sales for June through August, going back to 2011. And the green line is the 10 year average which the summer of 2022 is 38% below...
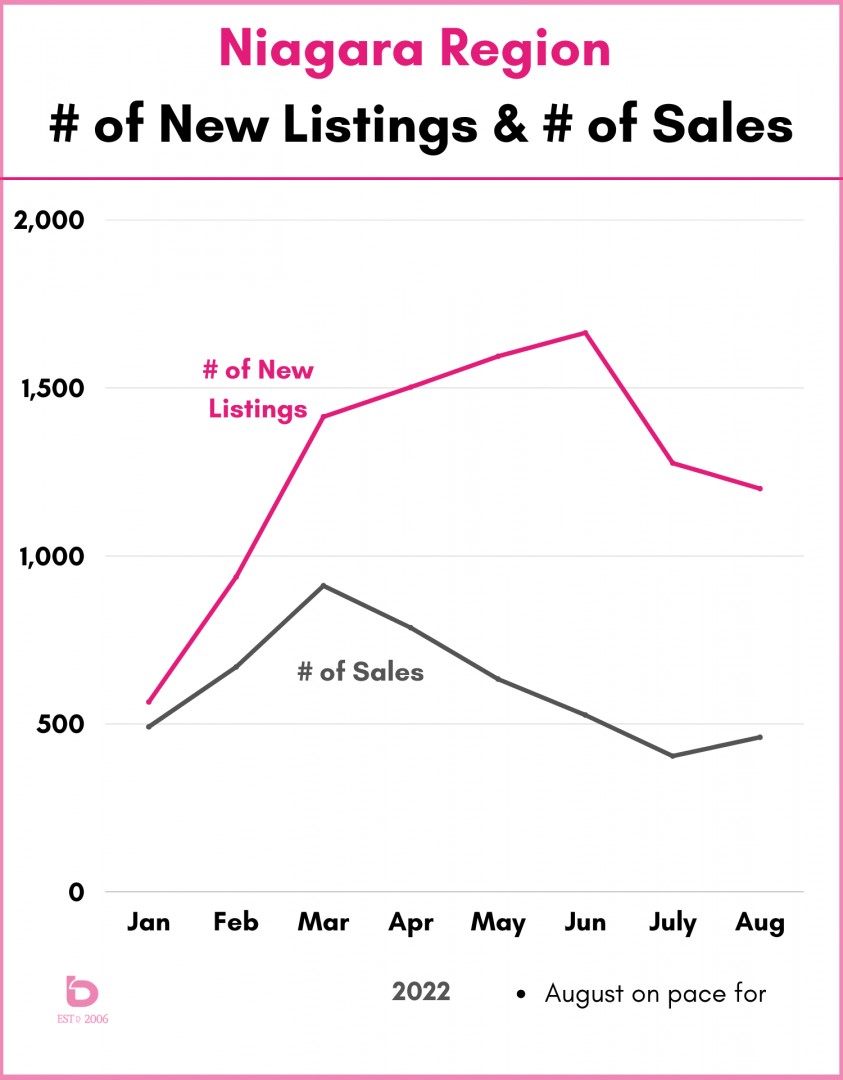
LOOKING AT SALES + INVENTORY
This graph shows how massive the change was as we moved from April through the summer. What to look for…
January – March:
Notice how tight the supply of new listings was compared to the number of sales. Buyers did not have a lot of choice which drove the market to record pricing heights.
April – Summer:
That gap in supply and demand (pink and grey) represents a buyer’s market. Or better put, a lot of homes on the market with significantly less buyers looking to purchase them which resulted in receding average prices.
LOOKING AT SALE PRICES...
Plenty of widgets for sale and less people wanting to buy them will lead to decreasing prices. The sales volume graph you just saw is a case in point to that.
A few tidbits.
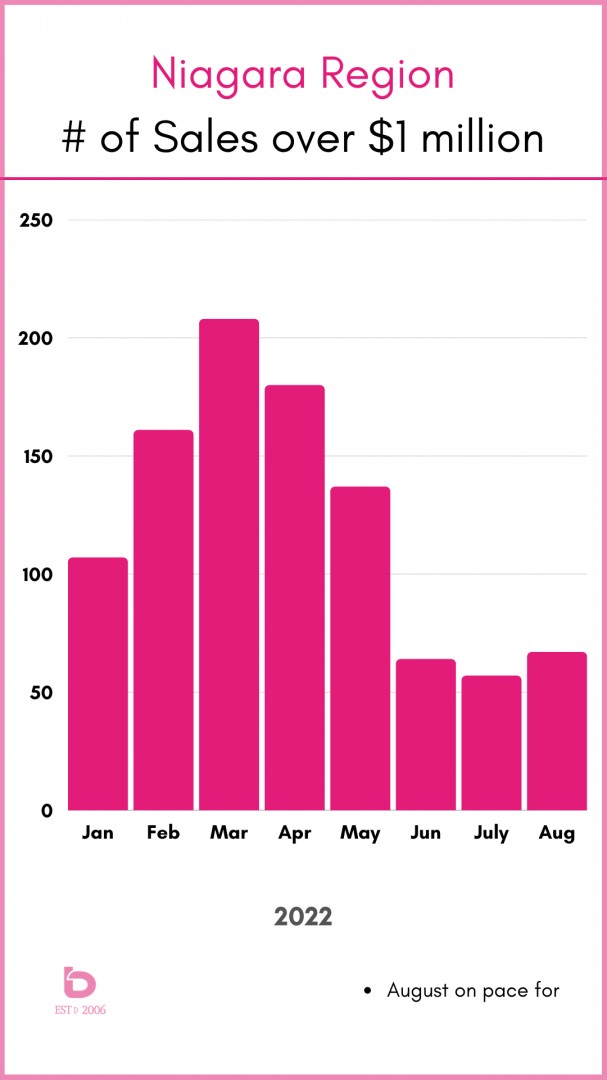
One of the most remarkable shifts in Niagara over the last 5 years has been the number of properties selling for over $1 million. The appetite for the ‘higher-end’ of the market absolutely exploded and along with it, the overall averages.
In general, over the last 5 years, the percentage of sales over $1 million essentially doubled each year to the point that in 2022, they represent about 20% of all sales.
That said, we've seen the same remarkable ups & downs in this end of the market too. This graph shows the monthly number of sales over $1 million so far in 2022:
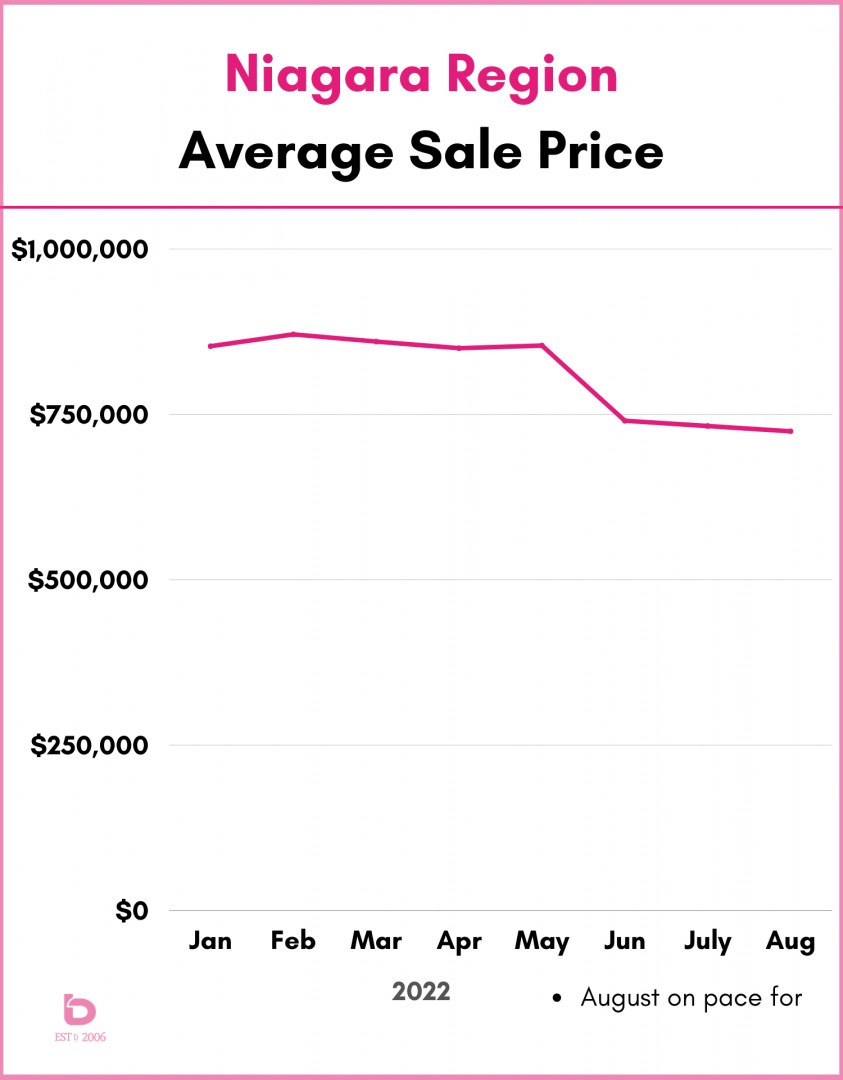
Looking at the entire market, the market peak across all of Niagara (and beyond) was back in February & March.
For Niagara, the peak was in the high $800,000s which was followed by a precipitous drop of $103,000 from May to June.
Note: there has been a slight moderation of prices from June through August with the average sitting in the $730 – 740,000 range.
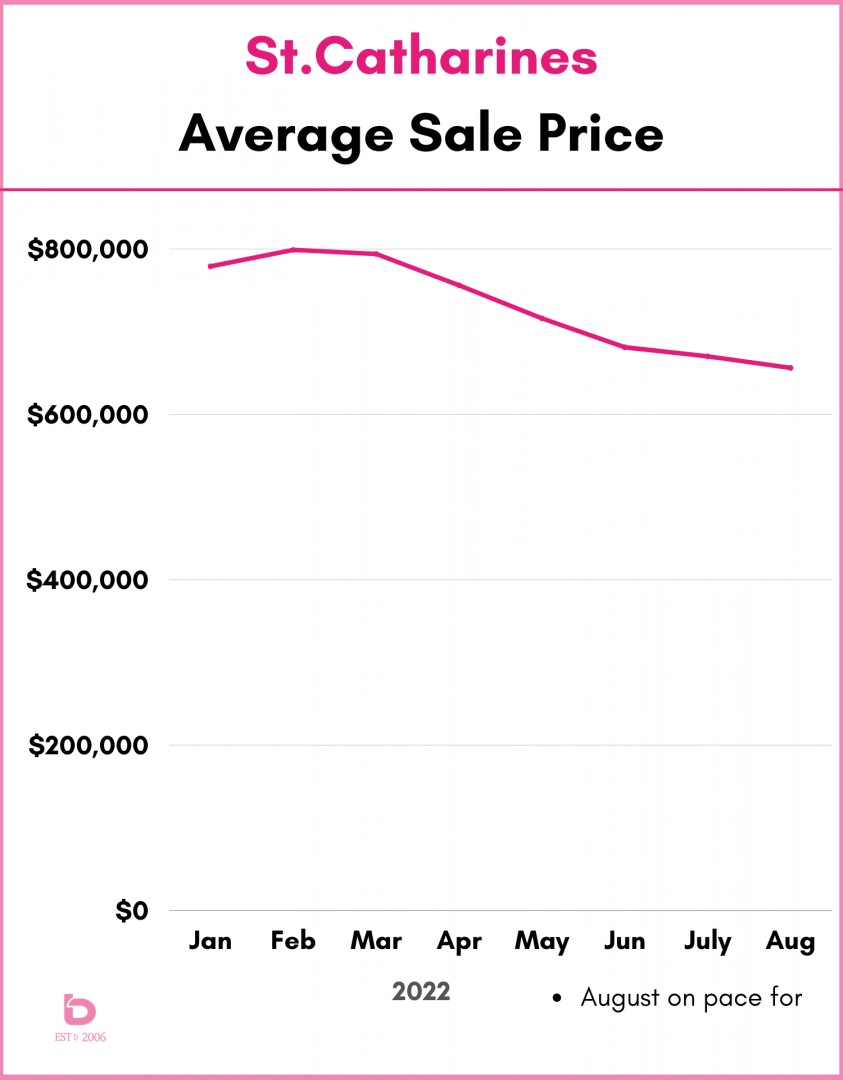
ST.CATHARINES
Essentially the same deal but without the one major drop, rather a monthly decline of about $40,000 from March to April to May to June.
Again, there has been a slight levelling off from June through August, with the average sitting in the $660 – 680,000 range. Note: that is exactly where we were in the last 5 months of 2021.
IN CONCLUSION...
We've experienced one of the most drastic and rapid market shifts in recent times. Even looking back at the spring 2020 market, 2017 market or 2008 market, this 2022 shift from incredible highs to unexpected lows was drastic to say the least.
What we're lacking now is predictability. No one really knows what is coming next.
Will the Bank of Canada raise interest rates by 1/2 a point in September? 3/4? Another 1% increase? How this impacts the confidence of the buyers and sellers in the marketplace remains to be seen but rest assured, this story isn't over yet.
Make sure you keep checking in here for further info. More news to follow...
CONTACT US & BOOK A CALL TO CHAT FURTHER