
The Market in a Nutshell.
First, let’s talk about what changed.
It was a case of real estate climate change. The feeling in the room changed as buyers demand pulled back while listing supply surged. A few bullet points on that.
Buyer demand pull back:
- investors were a huge piece of the market in early 2022. They have started to disappear due to increased costs including rising interest rates and the cost to purchase. Simply, the numbers don’t make as much sense anymore.
- interest rates and overall economic news have buyers “waiting for the bottom”. In some segments of the market, buyers are asking "why buy those shoes today for $150 when I can get them for $135 next week?" That’s the theory anyways. And it's important to note, the market is segmented. Some areas of the market, largely price related, are behaving differently than others.
New listing inventory surge:
- sellers getting their homes on the market because they don’t want to “miss the boat”.
- March, April & May are historically the strongest months for inventory. So, a push in April through May is not surprising in any given year.
What exactly transpired in May 2022?
Let’s look at the number of new listings (supply) compared to the number of sales (demand):
|
May |
# of New Listings compared to # of Sales |
|
May 2021 |
1.3 new listings per sale |
|
10 yr average |
1.6 new listings per sale |
What is that supposed to mean? In a month with 1,000 sales, that’s a difference of 300 surplus (or “unsold”) new listings. So, how did May 2022 do?
|
May |
# of New Listings compared to # of Sales |
|
May 2022 |
2.5 new listings per sale |
So, in a month with 1,000 sales, that’s a difference of 1,500 surplus new listings. That is a distinct change from the last few years.
Case in point: May 2022 was the first month since May 2020 where the number of homes sold was less than the 10 years average for the month of May.
So, yes, in general terms, the teetor-totter has tottered to the favour of the buyer. What happens when the market dynamics shift so quickly? Much like the speed of change that we saw from late 2021 into early 2022, the big pieces change.
Average Sale Prices.
Days-on-Market.
Let’s look at the big one. Prices.
These graphs are straightforward. I promise. ![]()
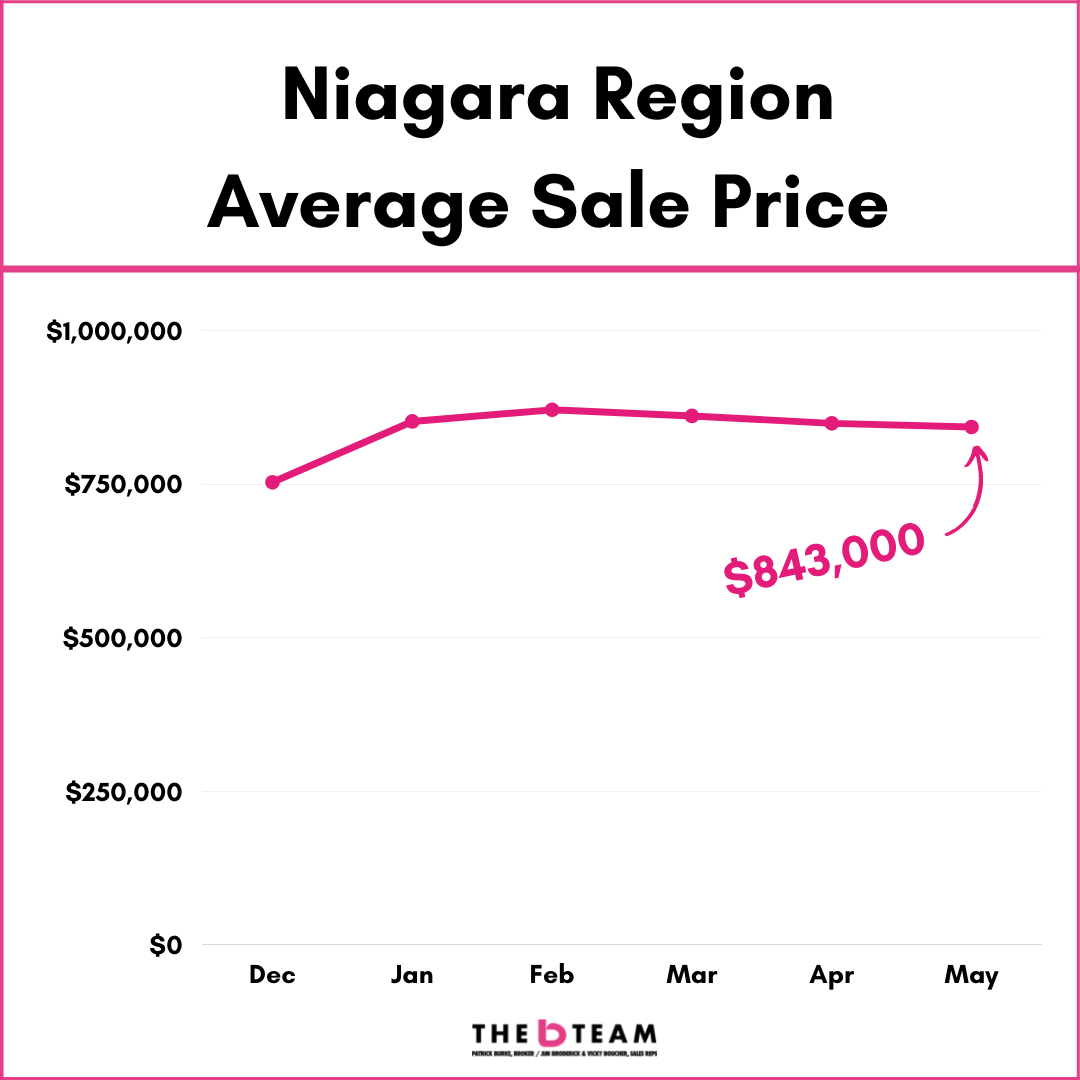
They show the average sale price for residential real estate in the Niagara Region with data from the Niagara Association of Realtors.
The timeline is from December 2021 through to May 2022. I included December to show you the jump in prices that happened into January.
DIVIDING UP THE NIAGARA REGION
Niagara Region - all municipalities
Niagara Region with and without The Big 5. Those 5 cities are:
- Niagara-on-the-Lake
- Fonthill
- Grimsby
- Lincoln
- West Lincoln
St.Catharines
Niagara Falls
Welland
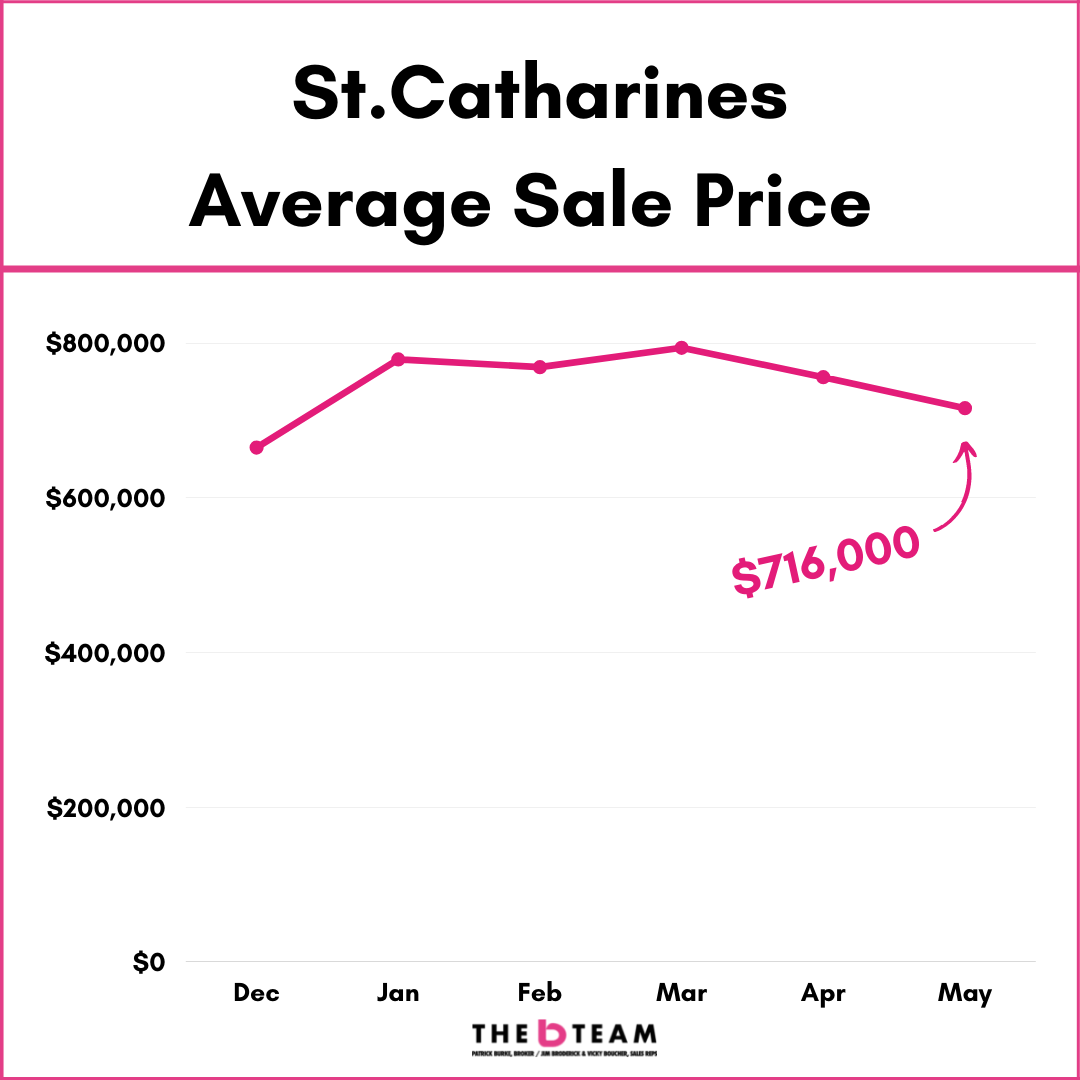
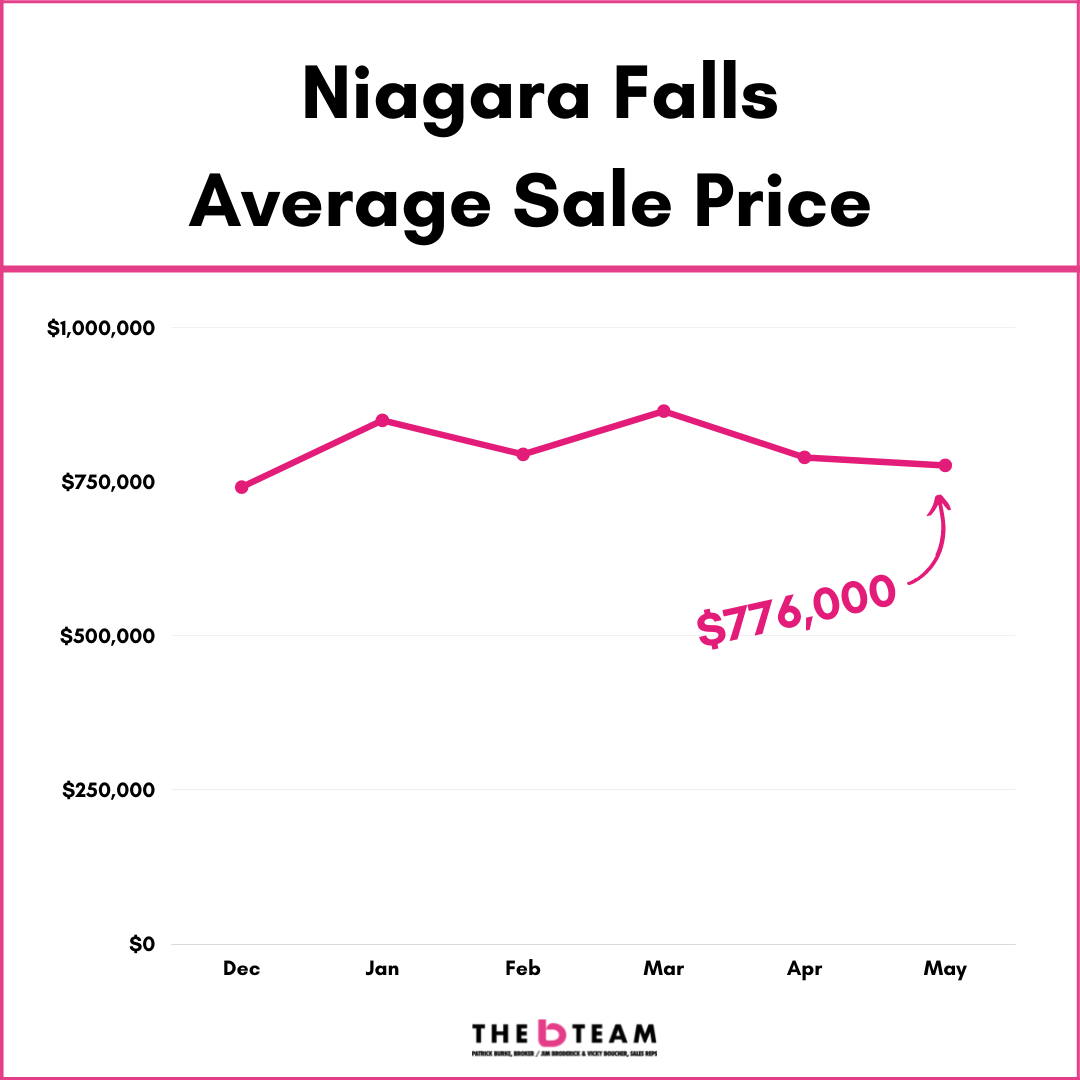
Why St.Catharines, Niagara Falls & Welland specifically? Those 3 cities produce the largest number of annual sales (in that order with St.Catharines in 1st place) so there is less volatility. For example, Thorold’s monthly price graph looks like an EKG report due to low monthly sales volume (typically 20 - 35 per month).
Let’s have a look. In general, you're going to see a trend of prices pulling back from their monthly highs in February or March. More on that later.
SALE PRICES IN THE NIAGARA REGION
SALE PRICES IN ST.CATHARINES
SALE PRICES IN NIAGARA FALLS
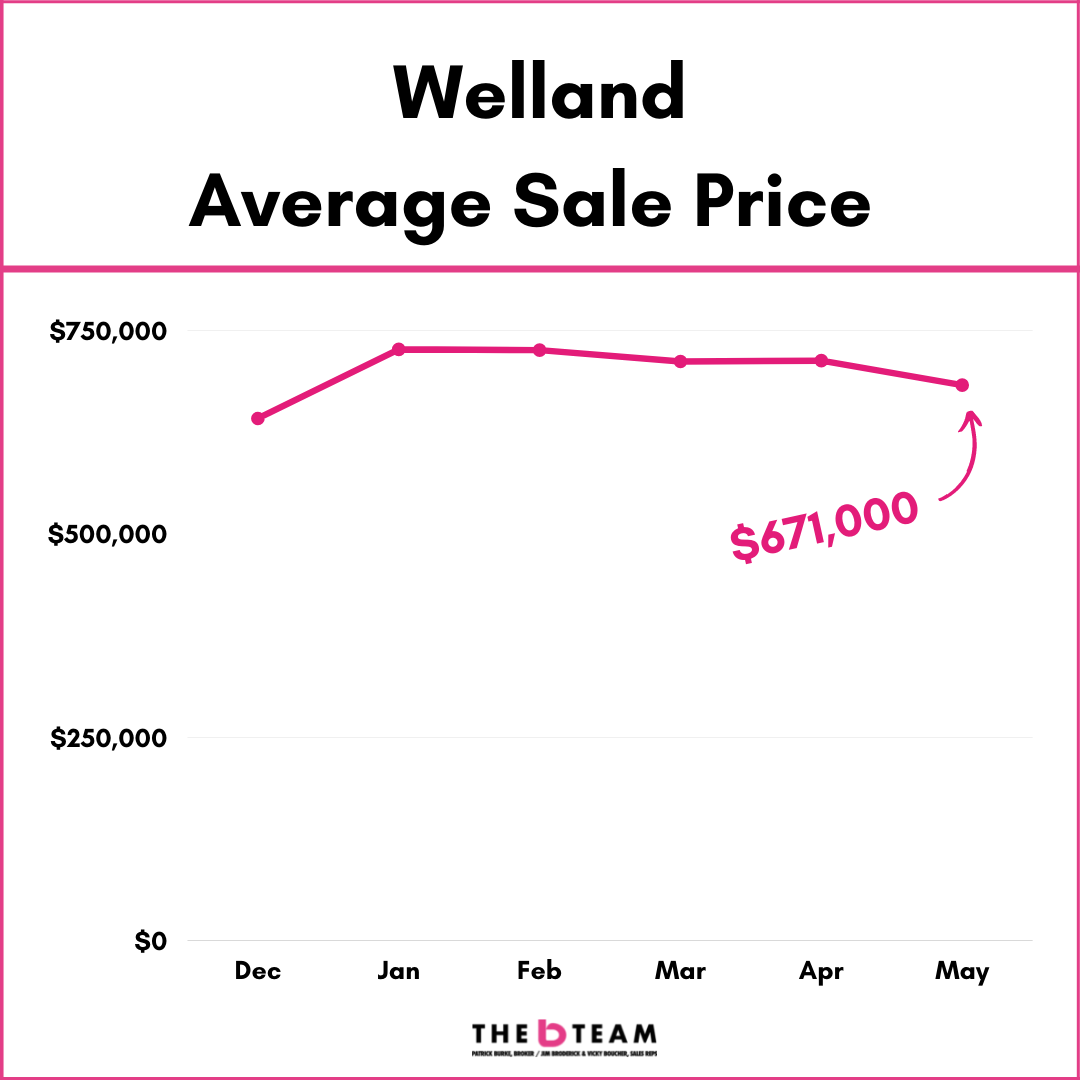
SALE PRICES IN WELLAND
So, one quick dive into the numbers...
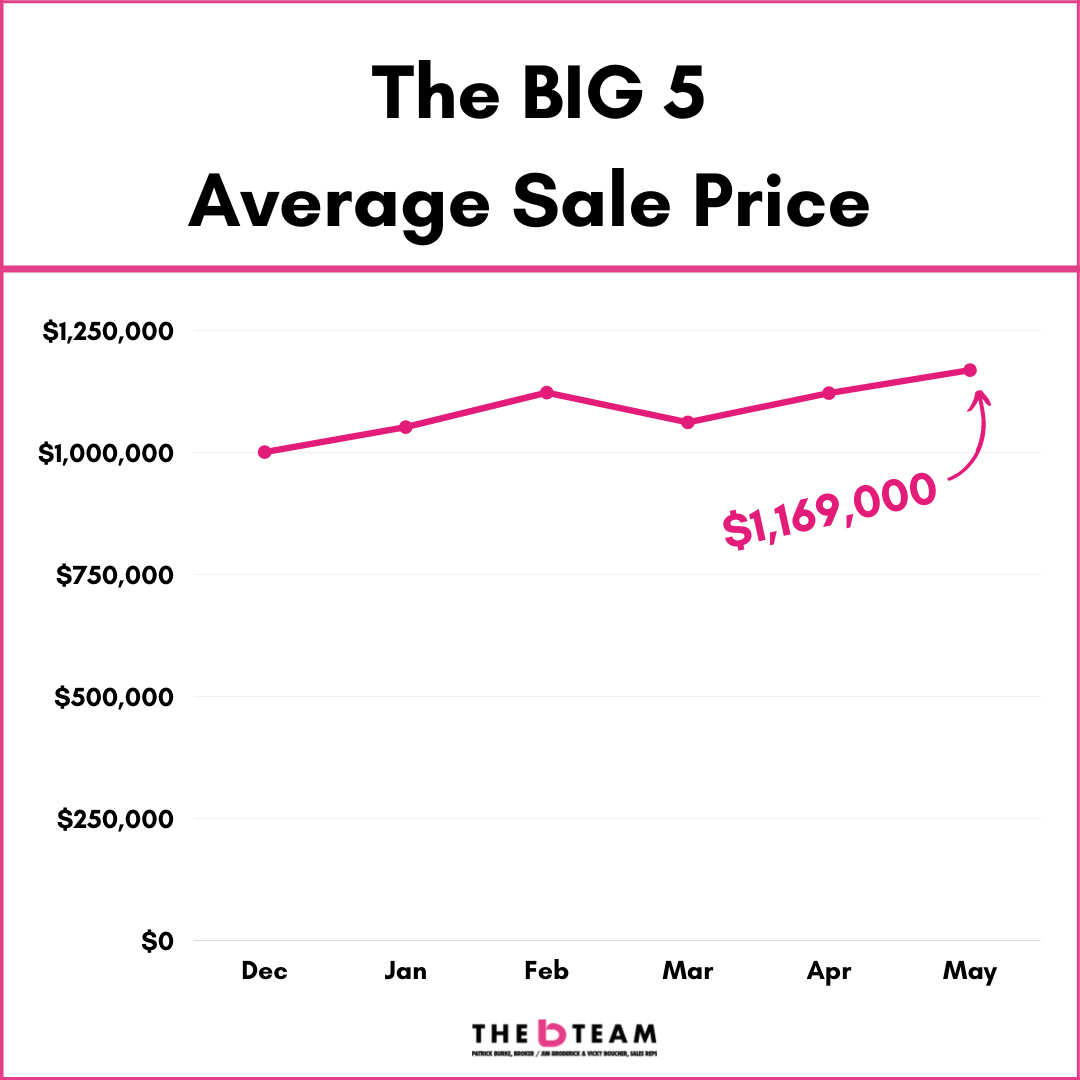
The Big 5 are behaving differently than the rest of Niagara. Mainly, The Big 5 have had their pricing peaks in May 2022 rather than February or March like the remaining cities.
How does that translate into the numbers? These 2 graphs show the average price for Niagara with and without The Big 5 in the numbers.
Here is the pricing trends for The Big 5 (Niagara-on-the-Lake, Grimsby, Lincoln, Fonthill, West Lincoln):
And here is the Niagara Region numbers with The Big 5 OUT of the data:
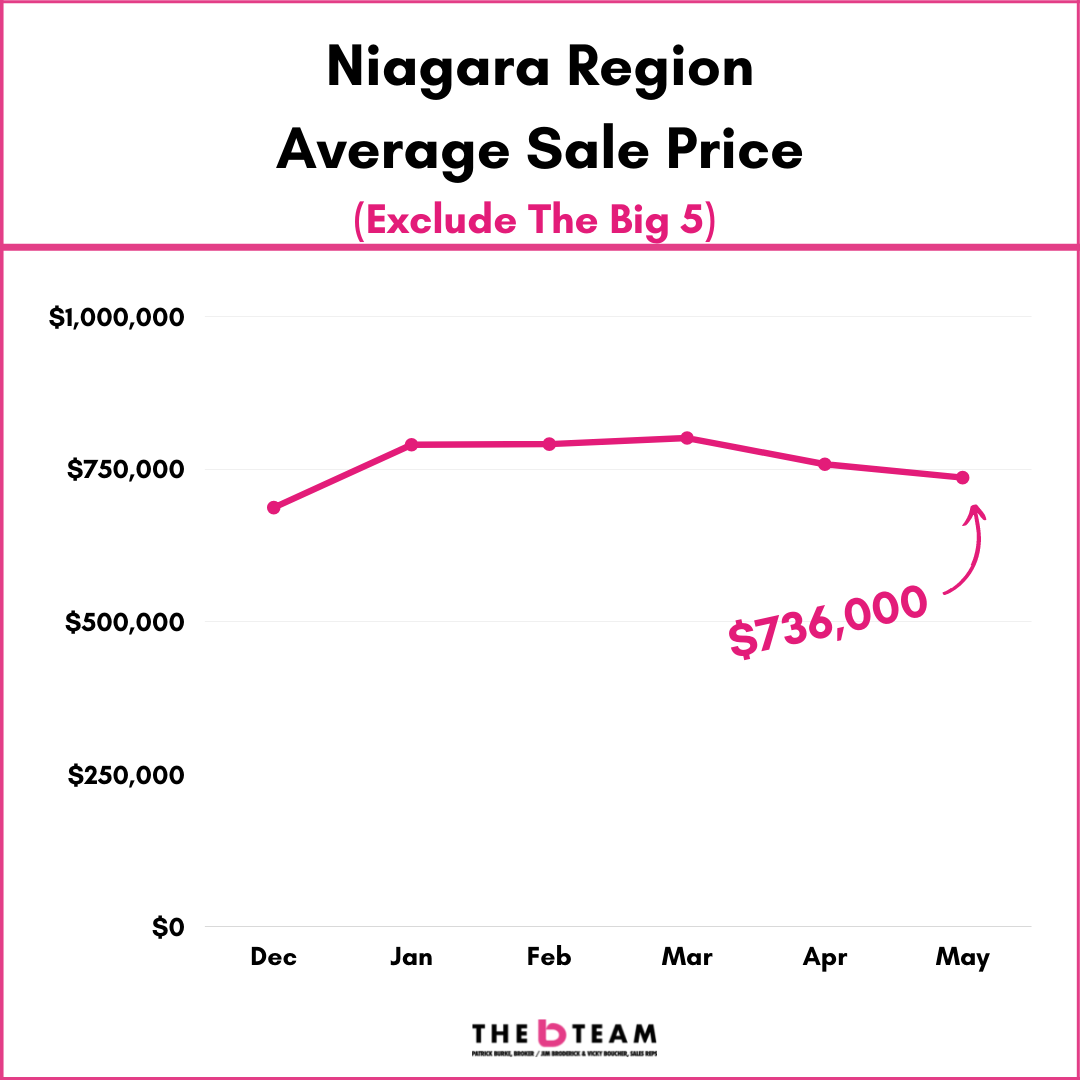
As you can see, a bit of a different story. That said, the general movement for the "non Big 5" cities is the same, with pricing peaks happening back in February & March.
ONE LAST THING WITH HOME PRICES:
Let's have a look at 2022 Year-to-Date averages compared to the annual average for 2021:
| City | 2022 YTD avg sale price |
Compared to 2021 Annual |
|
Niagara Region |
$855,000 | + 21% |
|
St.Catharines |
$766,000 | + 19% |
| Niagara Falls |
$812,000 |
+ 22% |
|
Welland |
$710,000 |
+ 20% |
|
Fort Erie |
$786,000 |
+ 18% |
|
Grimsby |
$1,061,000 | + 23% |
|
Thorold |
$834,000 |
+ 28% |
|
Niagara-on-the-Lake |
$1,310,000 |
+ 15% |
|
Port Colborne |
$760,000 | + 17% |
|
Lincoln |
$1,005,000 | + 20% |
|
Fonthill |
$1,102,000 | + 20% |
Plenty to unpack there!
Essentially, the market is finding it's footing after an overly excited start to the year. The bottom line is that prices are still up considerably from 2021, a year that saw prices up a jaw-dropping 28% over 2020. The relationship between supply and demand and how the humans involved feel is what is taking place as of right now.
How many homes are listed for sale and how many people are interested in buying them.
WHERE DO WE GO FROM HERE?
Watching when the market finds it's comfort zone will be key. It's reasonable to expect a few things:
- listing inventory should start to ease back into the end of June into July (there are only so many people looking to sell or move)
- the time it takes to sell (Days on Market) will continue to climb. March was in the range of 12. Expect June to be up into the 25 to 30 days.
- prices will settle some more. However, different areas will be more stable and in-demand than others.
- as interest rates increase, buyer demand will pull back some more. There will be less "recreational buyers" out there, with showings being focussed, motivated, "ducks in a row" buyers. If you're a seller, treat showings seriously.
- Patience will be key. Pre-2016, our market was 50 - 75 days on the market on average. It's important to remember that 12 days on market is not normal.
Hopefully this info helps. Have questions on your home or the market or life in general?
You are more than welcome to reach out anytime.