

What's going on with these house prices!?
The price of homes has been the topic of of conversation for ...well, at this point, about 5 years. But especially here in the back half of 2021.
As we've mentioned in numerous videos and bLOGs in the recent past, it is largely a by-product of supply and demand. And in general terms, looking specifically at 2021, the year can be divided into 3 parts:
- January & February were getting the wheels turning as new listing inventory ramped up but was decidedly outpaced by the number of homes sold.
- March through June showed a steady decline in new listing inventory while the number of homes sold set records
- July through current day produced average to weak new listing inventory while sales slowly started to pull back towards normal numbers. Even though sales pulled back, they were still significantly outpacing the supply of new inventory.
The result of ALL of the above is a market that was and has been undersupplied which has resulted in escalating prices.
The compounding effect of the 3rd part of 2021 (July through to now) has been steadily increasing average sale prices. October in particular was an intense month as the number of new listings were down 4% while the number homes sold were up 34% (compared to the decade average for October going back to 2011).
To cut to the chase, here are graphs showing the Average Sale Price trends going back to May 2020 for the Niagara Region as well as all municipalities.
A FEW NOTES:
The pink line is the avearge sale price for all residential for that particular month.
The green line is the year-to-date average so far here in 2021 (as of November 15th)
Note: you will see volatility month-to-month for smaller volume cities (less # of homes sold) such as Niagara-on-the-Lake, Lincoln and Fonthill.
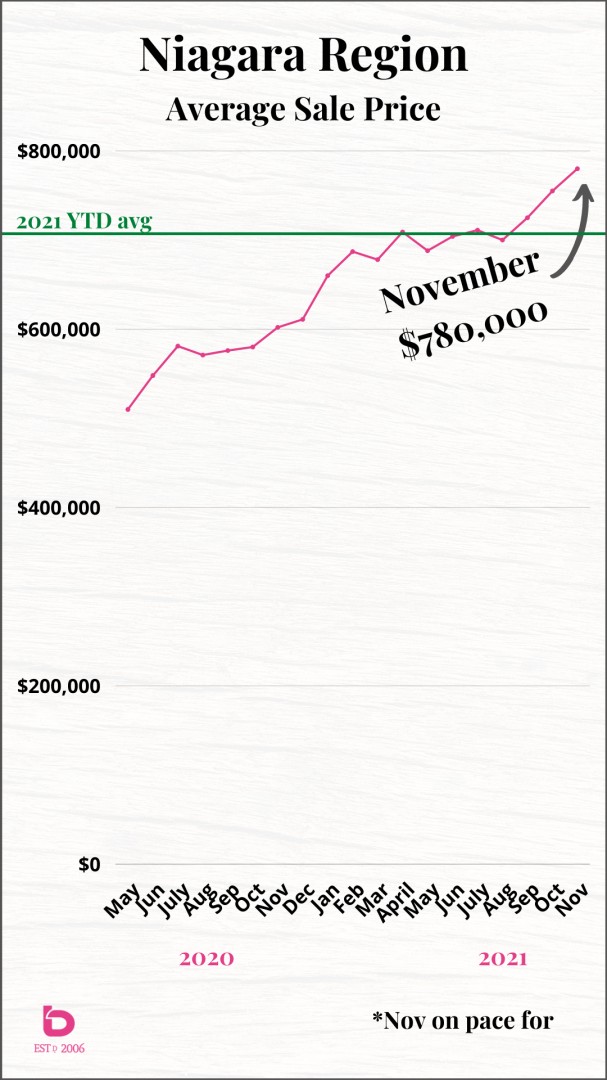
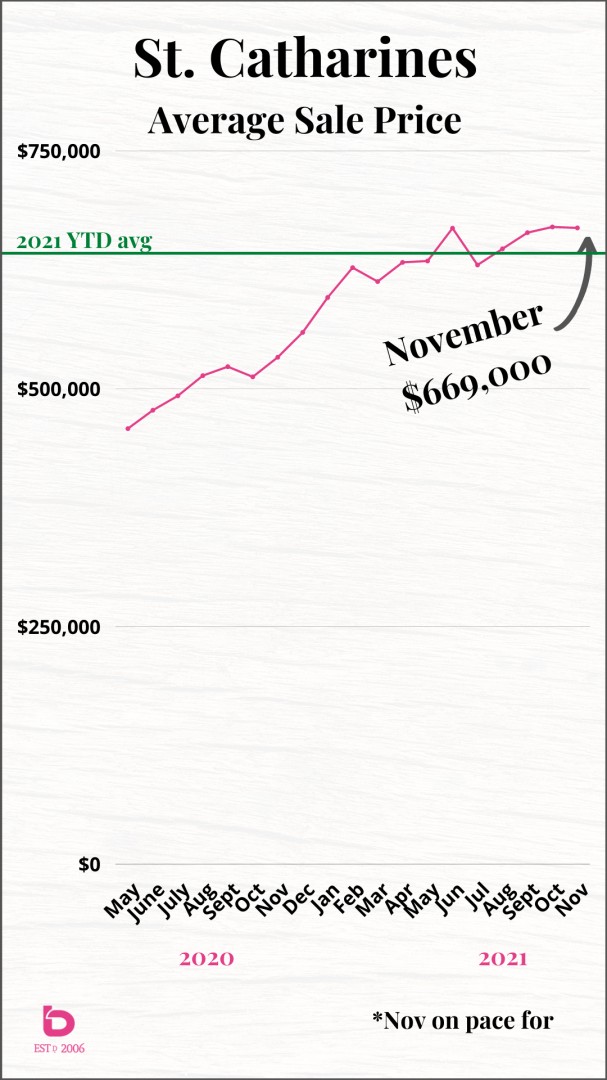
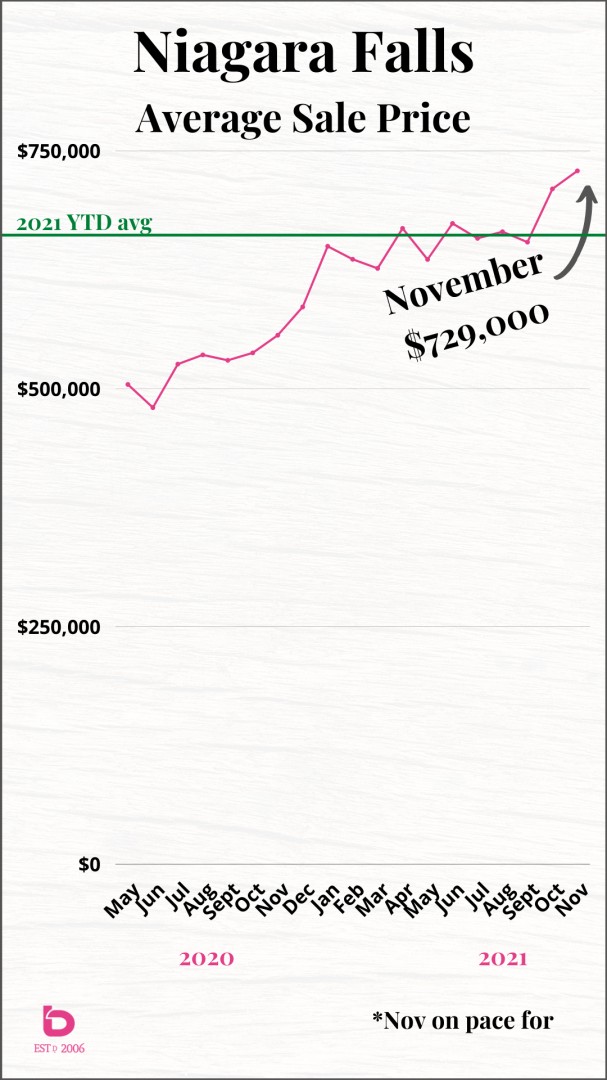
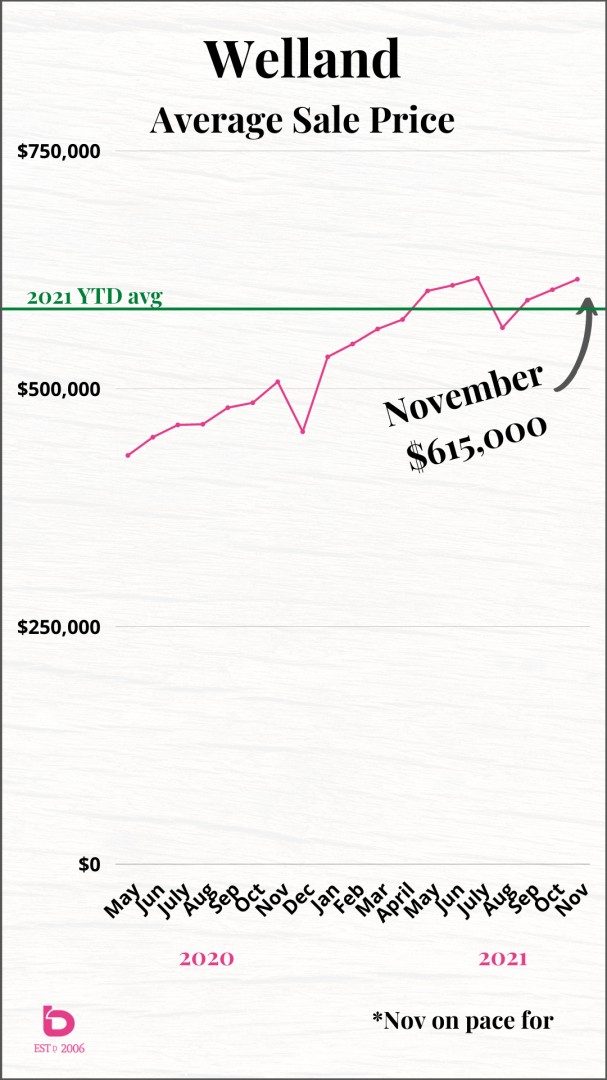
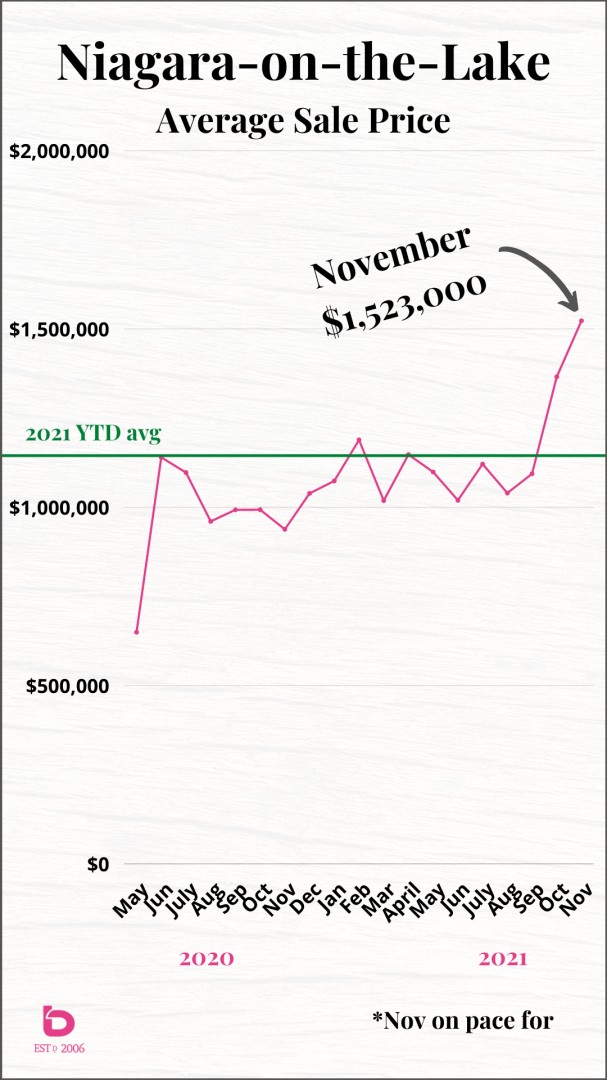
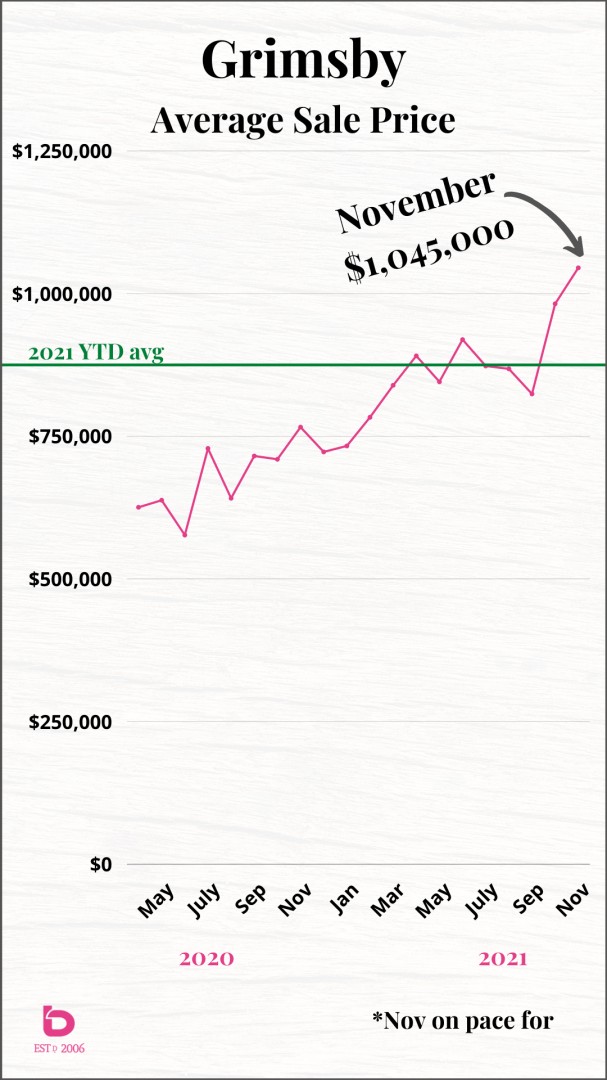
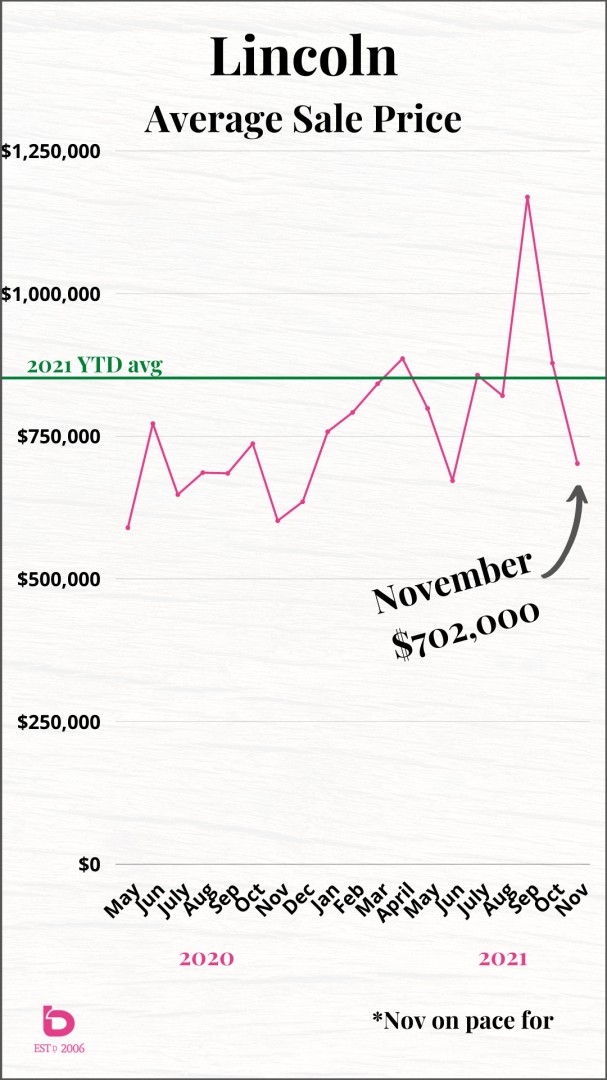
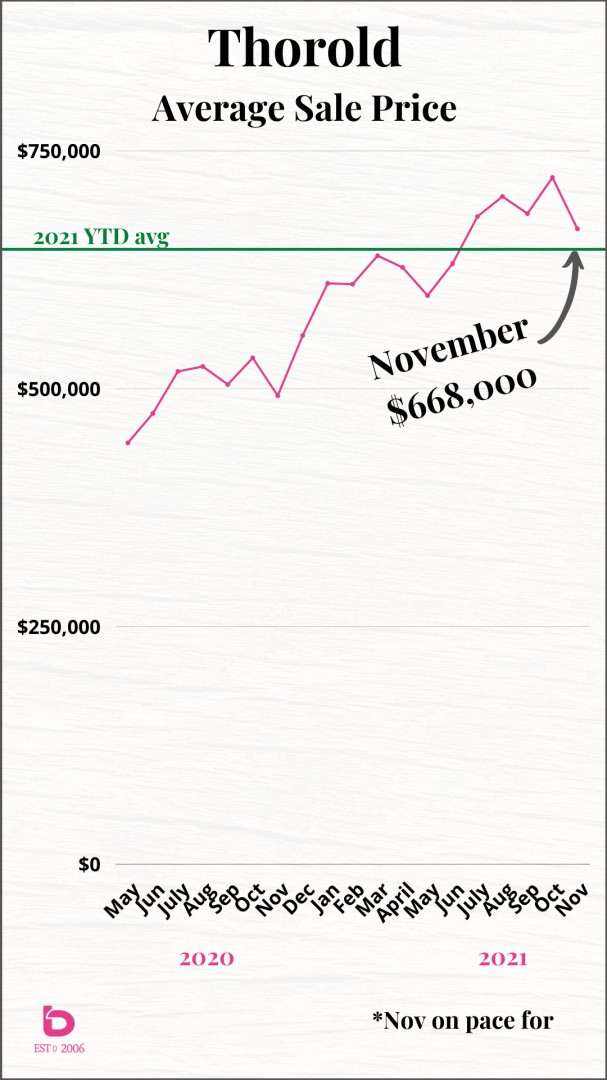
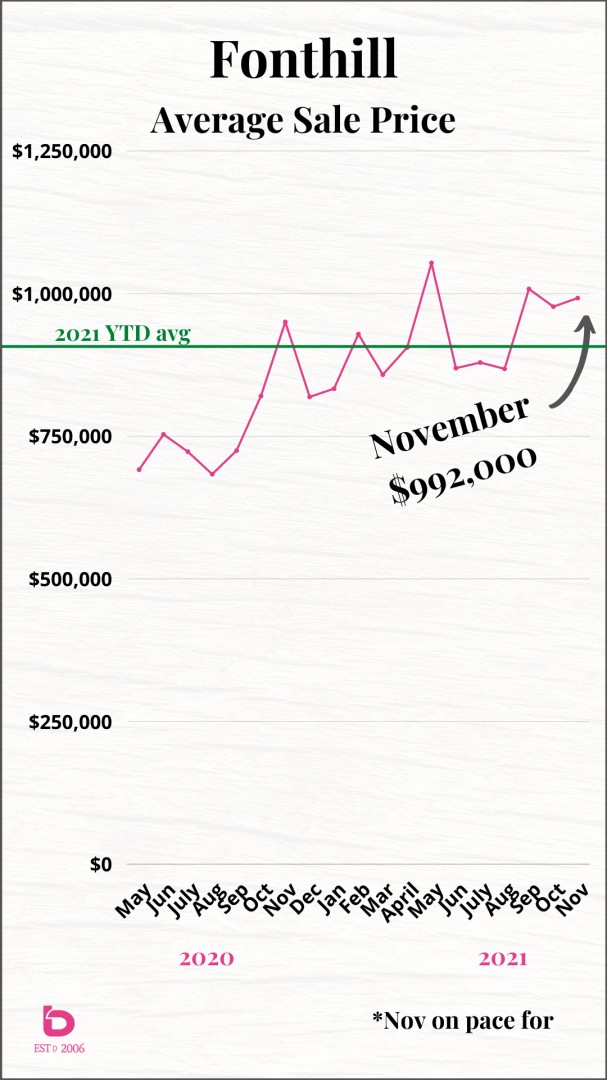
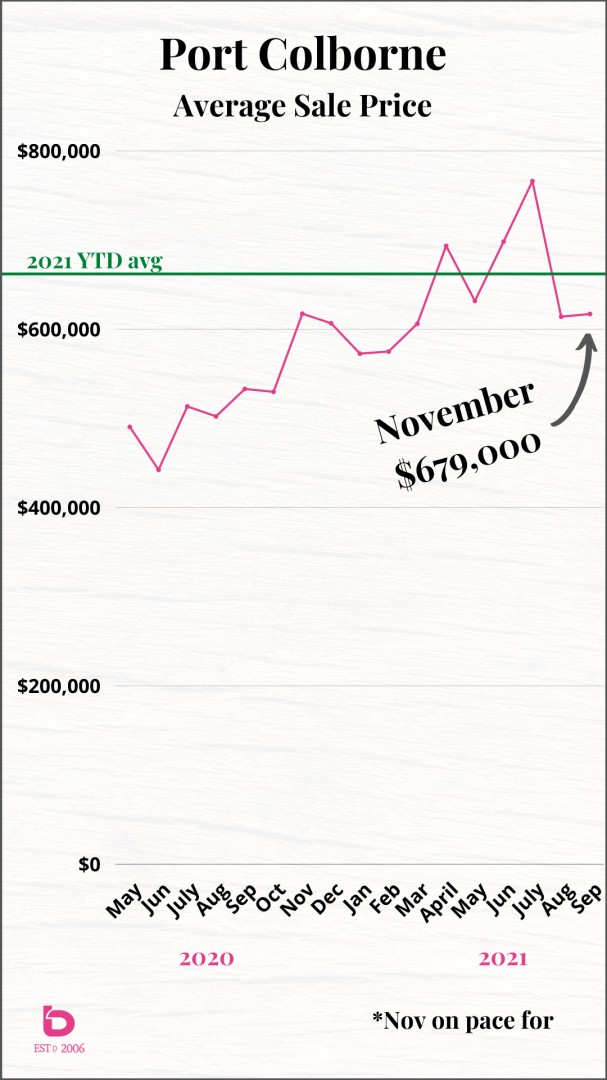
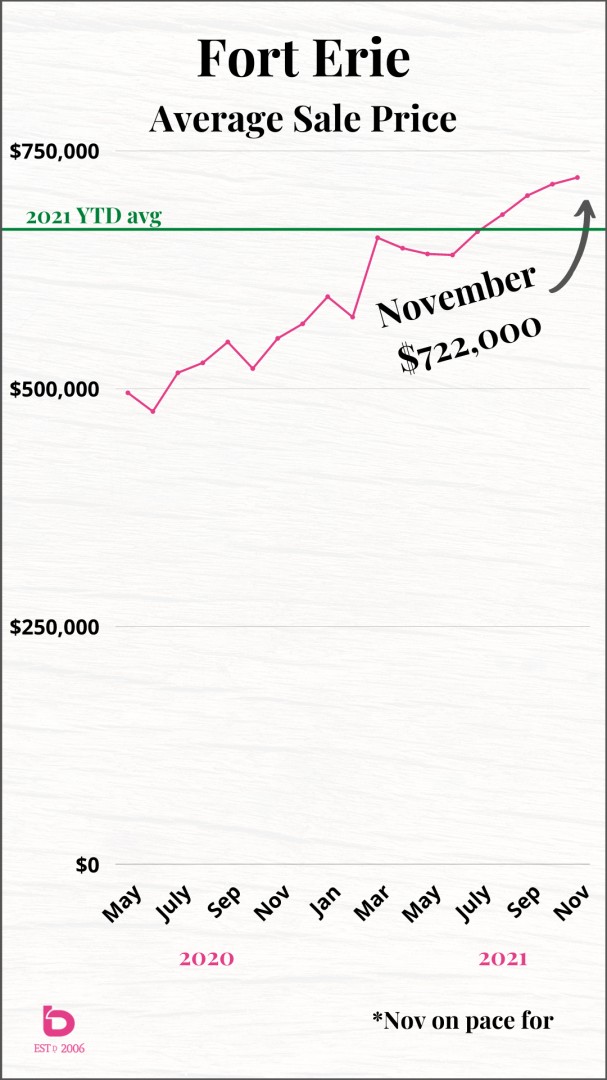
As you can see, the general trend has been increasing with that increase gathering even more steam here at the end of 2021.
Our crystal ball prediction is that we will see the overall sales demand (# of homes sold) and inventory (# of homes listed) continue to ease back to historical averages. In fact, we expect to see November be the first month with sales being below historical averages since March & April 2020 (when COVID first appeared on the scene) so for you buyers, hang tight and keep track of things over the winter.
Questions on the market? Please don't hesitate to reach out anytime.
Thank-you for visiting.
THEbTEAM