

Well....
How does one put into words a market that has zigged and zagged in all directions over the last 3 months. And 6 months. And, really over the last several years. While we’ve almost become accustomed to a flip-flopping market, what we’ve just gone through (and continue to go through) has been on a whole other level.
In the interest of slicing up the big picture into bite sized portions, we bring you another edition of Statistical Charcuterie. We hope you enjoy it.

HOW ARE NIAGARA HOME SALES?
Earlier this year, we saw some quick and drastic changes. Most notably, price. This graph (for Niagara Region) shows you the average sale price trend over the last year:
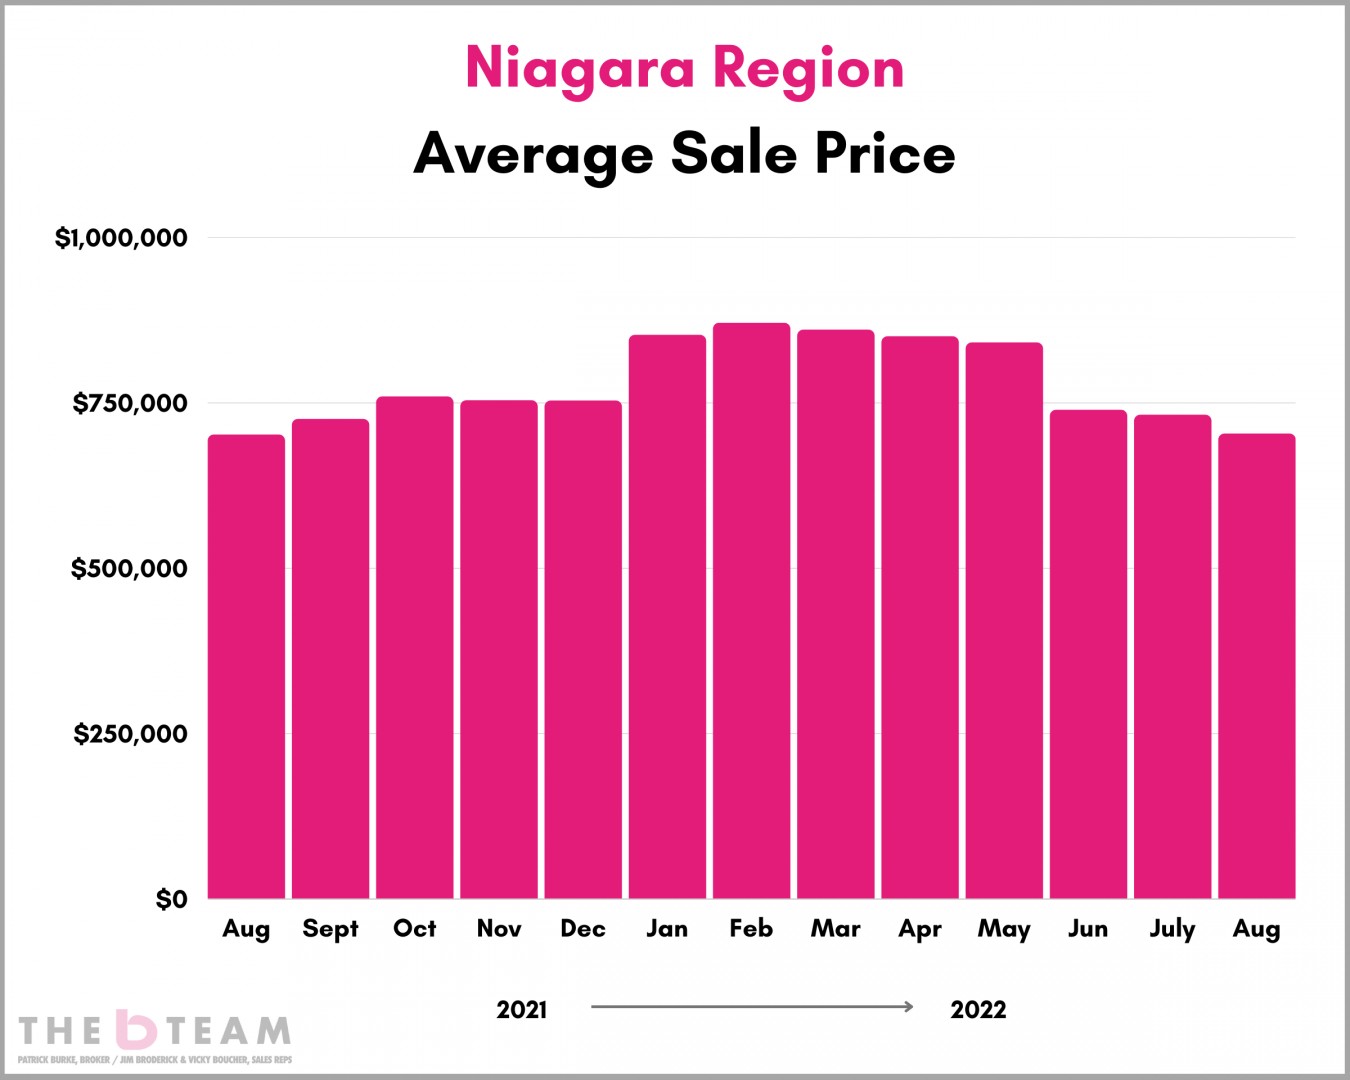
You can see fairly clearly that there were 2 major events.
- A gain in average sale price of $100,000 (+13%) in 1 month (Dec 2021 to Jan 2022).
- A drop in average sale price of $100,000 (-12%) in 1 month (May 2022 to June 2022).
ST.CATHARINES? Similar story. Have a look here...
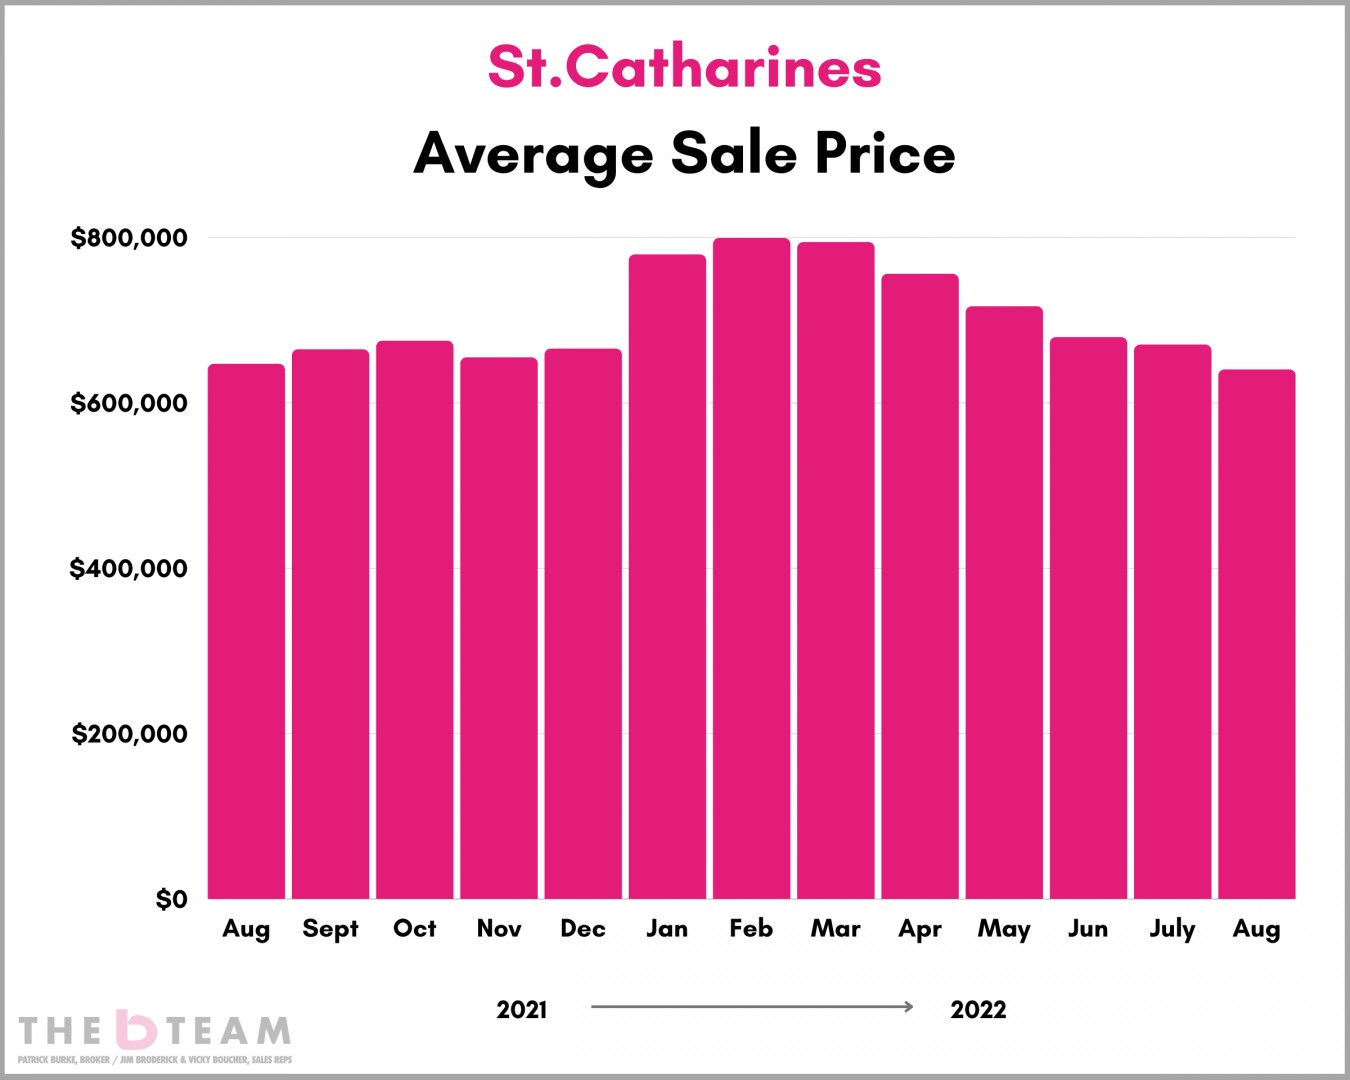
Again, similar but different. Here’s how.
- An historic 1-month gain of $115,000 in average sale price from Dec 2021 to Jan 2022 (up 17%)
- A slow & steady pull-back however the end result has been the same. In terms of numbers, the average sale price dropped by $40,000 +/- on a monthly basis from March through June. It steadied in July but then dropped another $30,000 in August.
So, to confirm what you already likely know, prices have pulled back. In essence, the trend line resembles something like this:
In a nutshell, the market has given up the gains made with average prices across Niagara resembling sale prices from 12-14 months ago.
Editor’s Note: It’s worth noting that the average sale price increased by a record setting 29% in 2021, the largest one-year increase in several decades. So, if that is where we’re back to, then from a longer-term trend perspective, it’s not all bad news.
WHY DID THAT HAPPEN?
Quite simply, supply and demand.
Harry Styles is coming to town. The arena only fits 22,000 people. The problem is that 72,000 people want to go to the show.
Low supply + High demand = Ticket prices in the many hundreds of dollars, or more.
Or conversely...
The bakery has an order for 1,000 chocolate chip cookies. Unexpectedly, the buyer cancels the order and disappears. Suddenly the bakery has 10x more chocolate chip cookies to sell than normal.
High supply + (relatively) Low demand = Heavily discounted chocolate chip cookies. (...finally, a good news story)
The above 2 scenarios, in that order, is what we saw from early 2022 to the summer of 2022. A complete flip-flop, teeter-totter market.
SUPPLY OF HOMES FOR SALE
Exhibit A. This graph for the number of new listings in Niagara shows you the past 12 months (in pink) along with the 10-year average (in black).
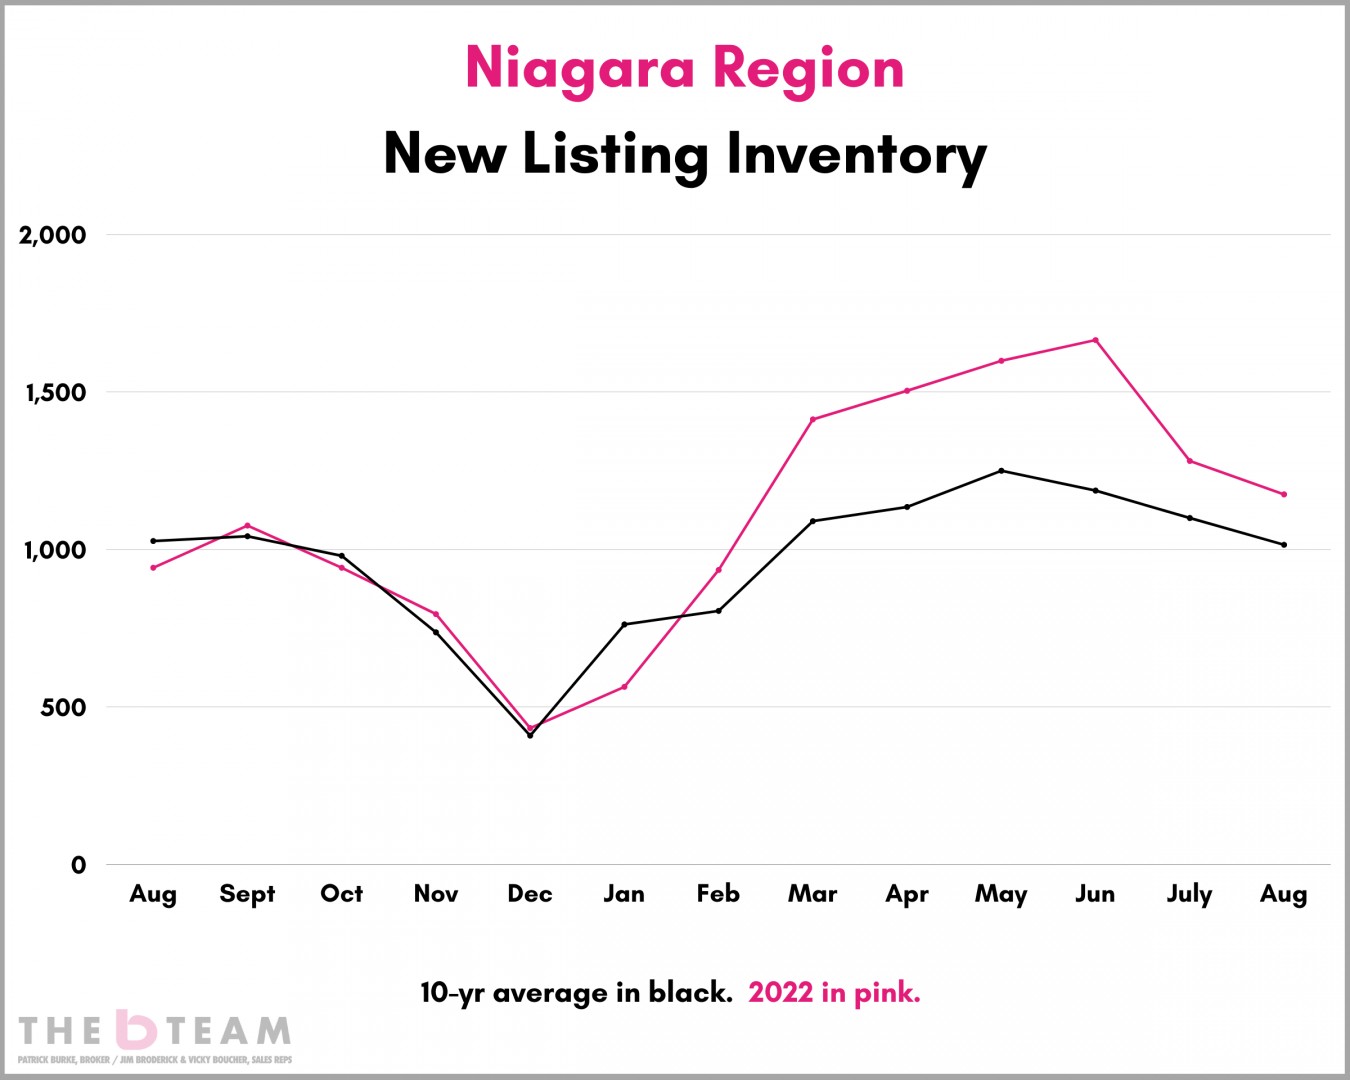
The supply was relatively normal up until January 2022 (pink line below black line) after which supply absolutely exploded through March into July when the number of new listings were running 20 – 40% above the 10-year average.
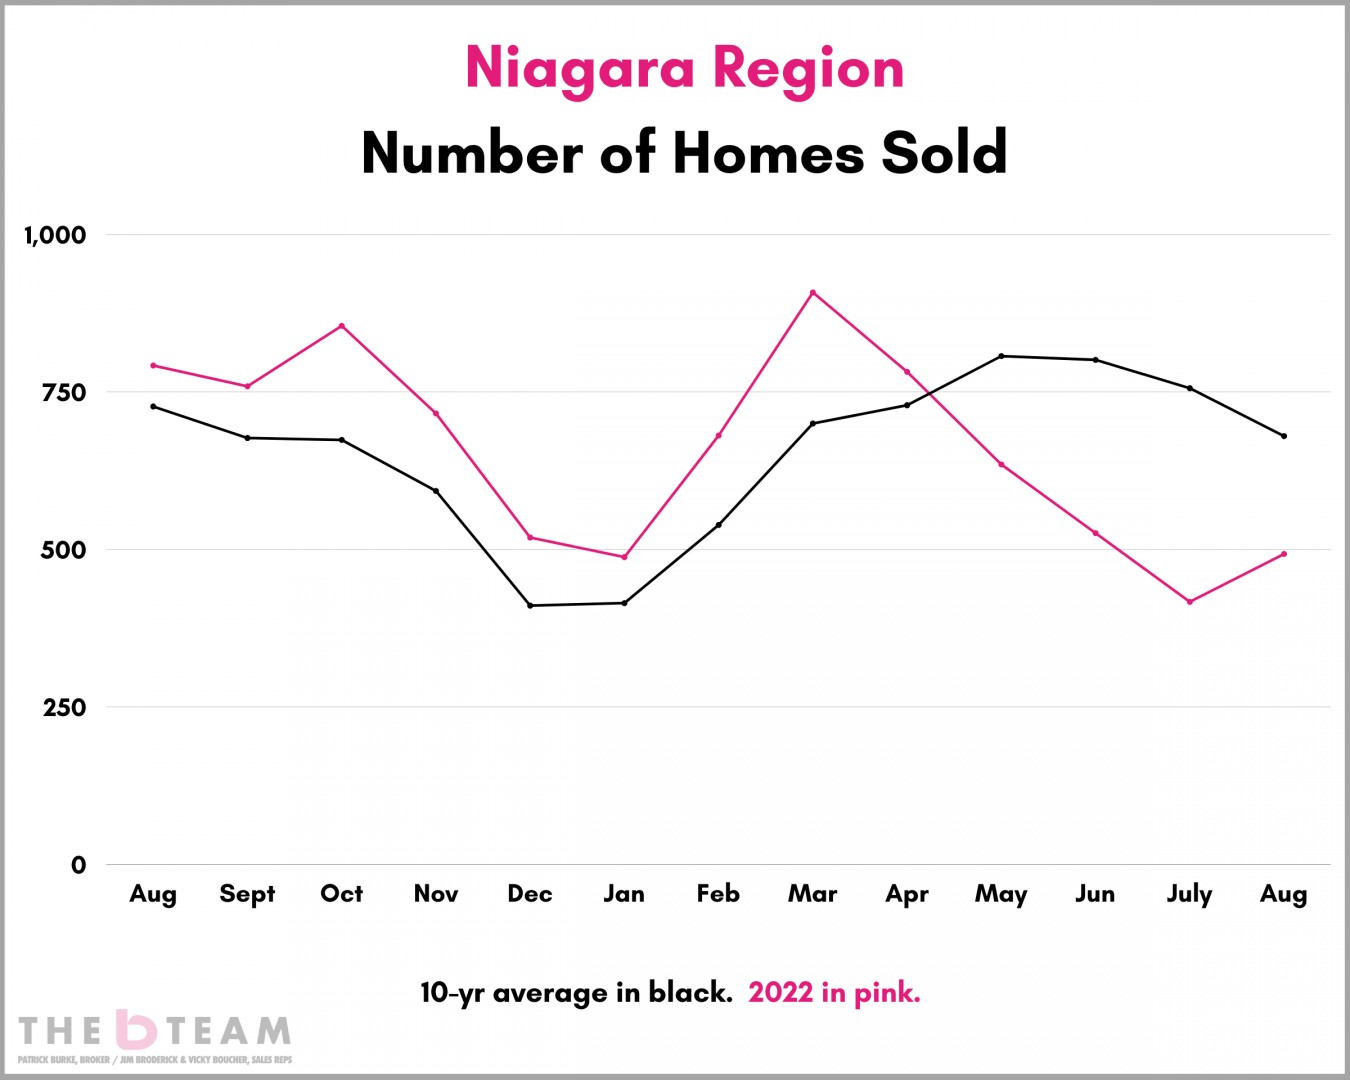
HOW MANY HOMES SOLD
The number of people who want to buy something is equally as important as how many of those things are for sale. 2022 has been a case study in that economic truth.
Check out this graph for Niagara. The number of homes sold per month over the past year is in pink while the 10-year average is in black. While each month was outpacing the 10-year average, that only intensified into March when sales were 30% higher than the 10-year average.
Then, note the drastic drop-off through May into the summer when sales ran 25 – 47% below normal. Remember, that was happening while the number of new listings piled on.
PUTTING IT ALL TOGETHER.
Overlaying the supply of new listings and the number of sales for 2022 will clearly show the flip-flop market mentioned above. Have a look here:
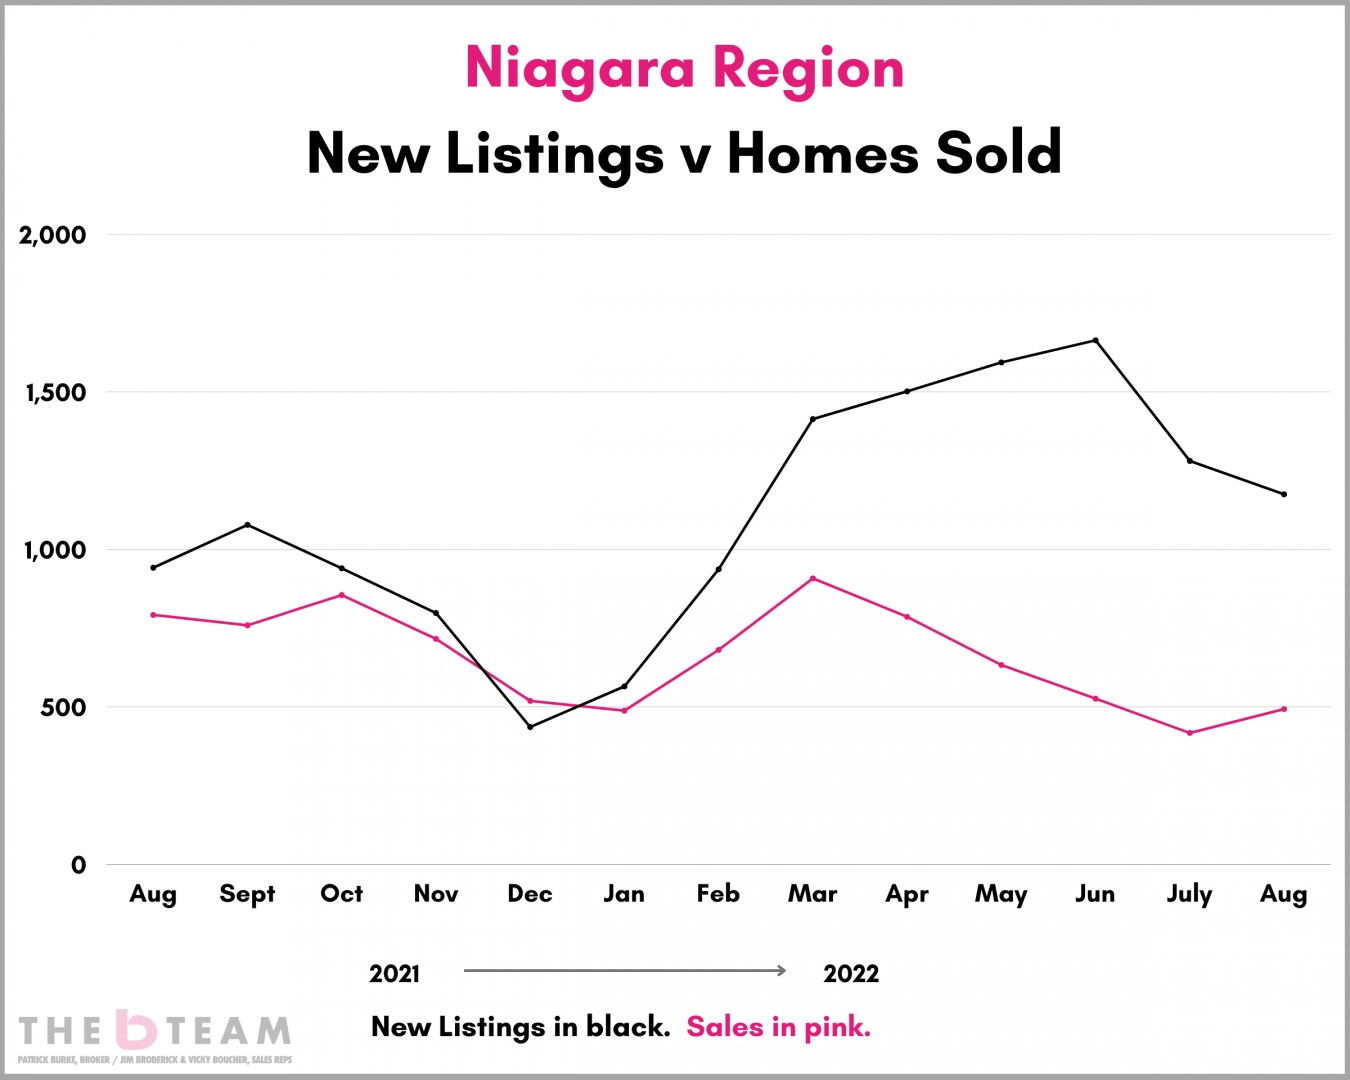
Notice how tight the supply (in black) and the demand (in pink) was until the market first starting showing signs of change as we got into March. From then on, the gap between supply and demand opened wide as we moved into the summer when there were suddenly 2.5 to 3 listings per sale.
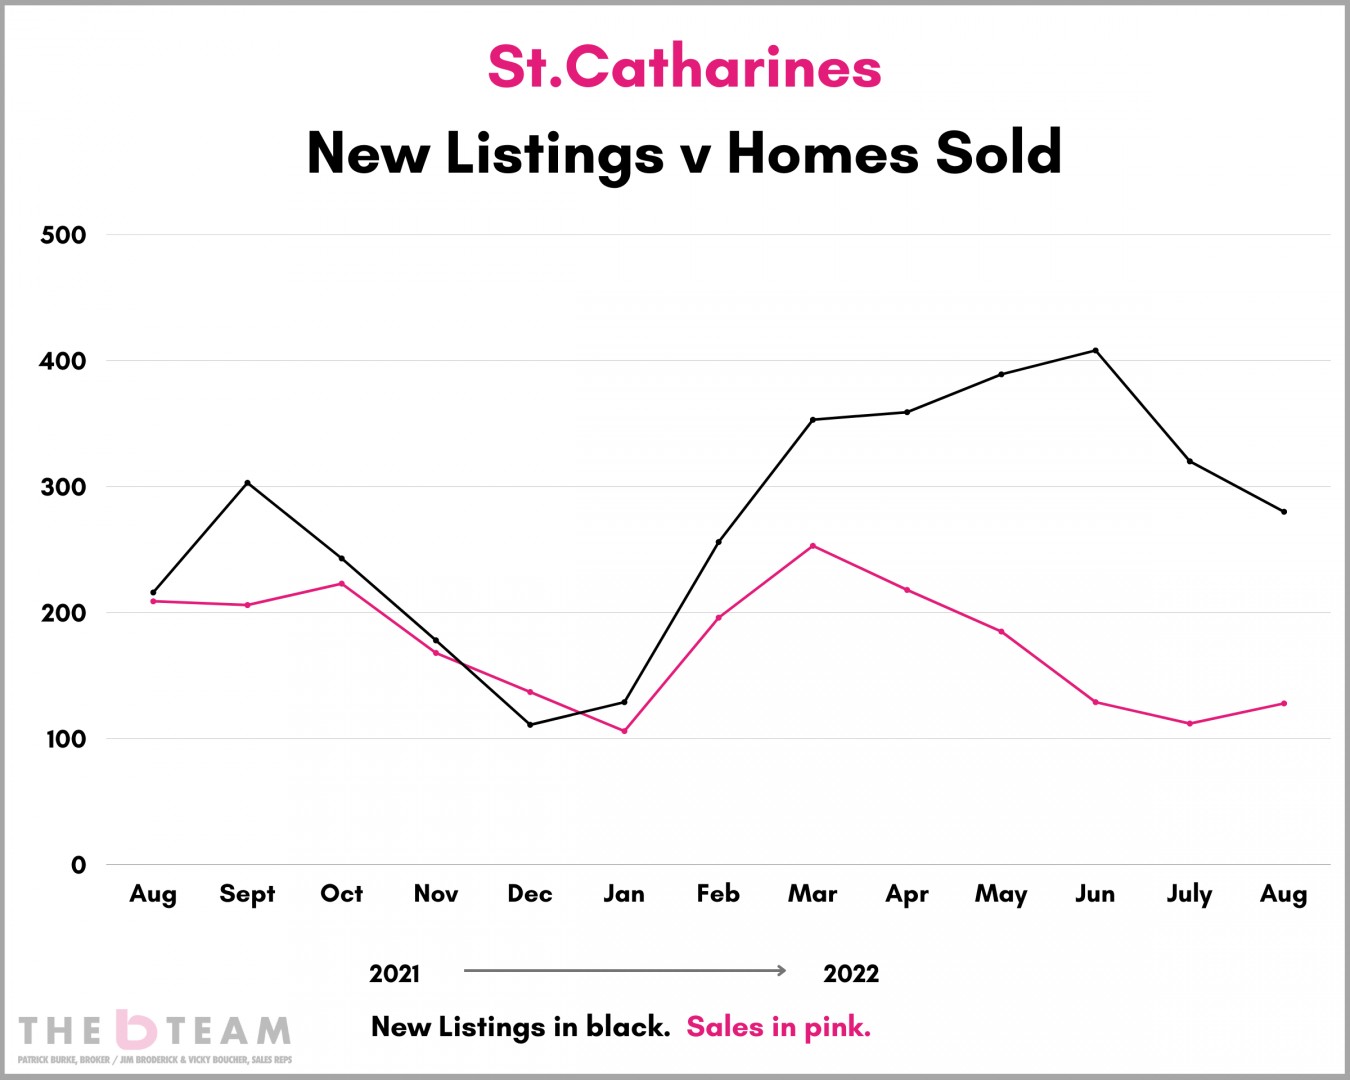
Here is a look at the same thing for St.Catharines. Note how similar it is to the Niagara Region trends.
REASON FOR HOPE
Have a look at the 2 previous graphs above. Notice in August 2022 how the supply of listings receded a bit while the number of sales bumped up. Those steps, though small, are a step in a better direction. A 'normal' Niagara real estate market exists somewhere between what we saw in early 2022 and what we saw in the summer 2022 market.
But while hope is needed, so too are reasonable expectations. For example, the time it takes to sell has been another piece of data that has experienced drastic changes.
This graph tells a few stories.
1. 2021 – 2022 (in pink) shows the major change that happened through winter 2022 into the summer months.
2. 2018 – 2019 (in black) was included to show you a past market and how out of sorts the last few years were in comparison.
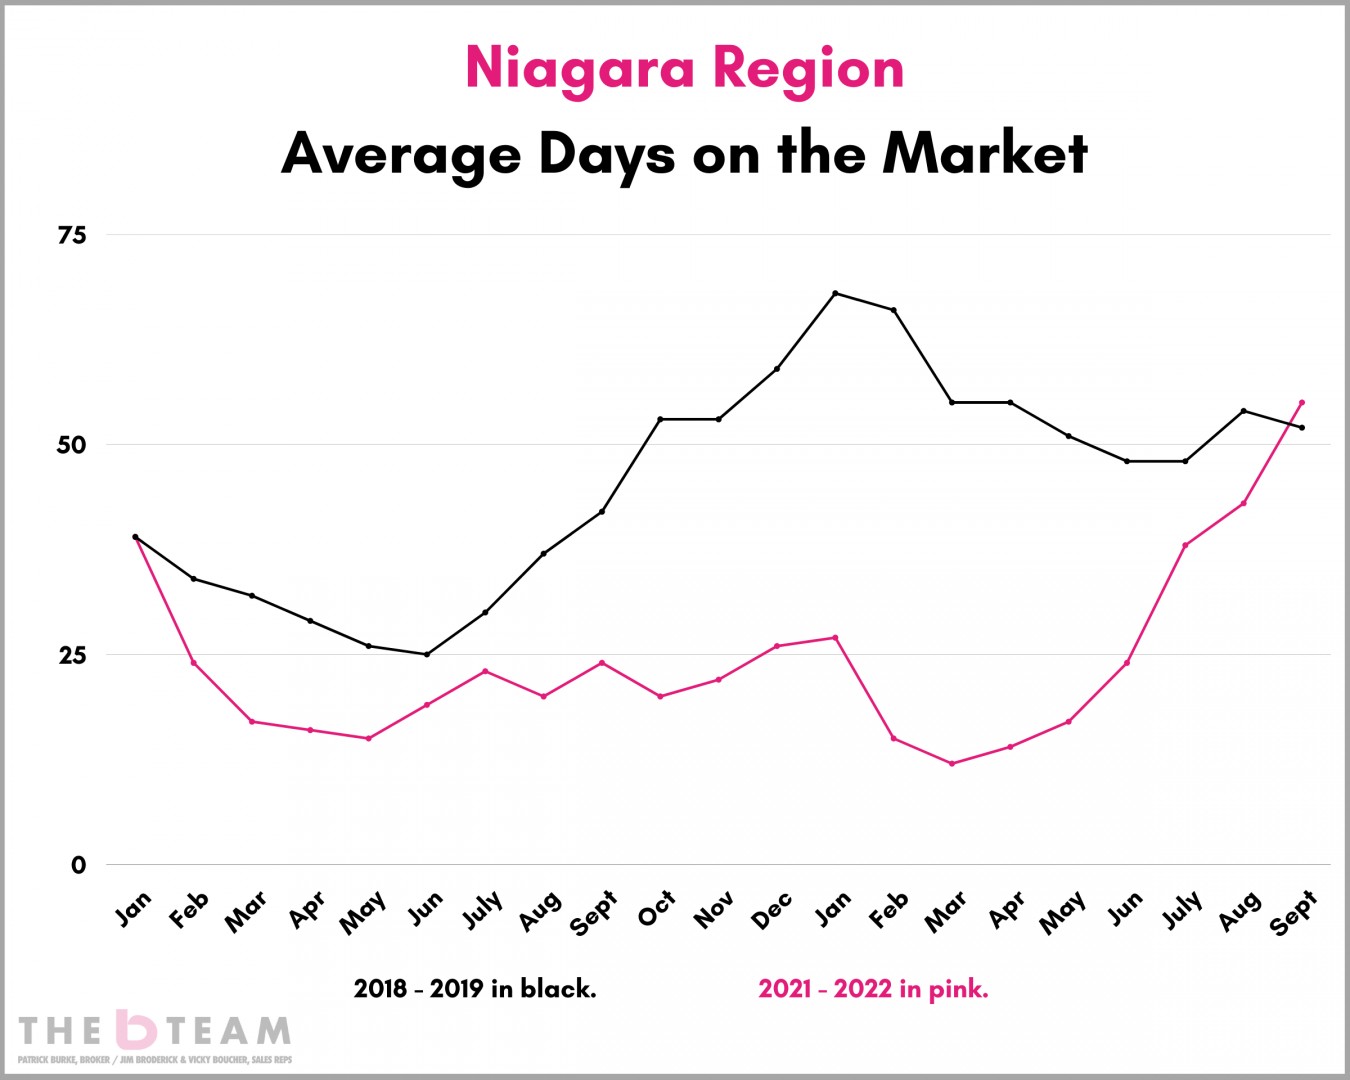
So, yes, it will take longer to sell your home than you probably expect.
WHAT HAPPENS NEXT.
This will be a “fasten your seat belts while we fly through this bumpy air” type of market. With uncertainty comes volatility and that is what we’re going to experience for the next several months and into next year.
The key though will be to watch trends. We’d suggest keeping an eye on these items:
- Have prices flattened out?
- What is the state of buyer confidence?
- How long are homes taking to sell?
- How is the supply of listings relative to reasonable market values?
All of the above requires a deeper dive than a simple month-over-month number. Trends, market characteristics and nuances are key.
Stay tuned here and we’ll keep working to keep you informed.
As always, thank-you for spending some time here with us.
CLICK HERE TO EMAIL US OR BOOK A PHONE CALL CHAT