

The Date: July 27th
The Market: Changing
A funny thing about change. After what has been an epic run, as soon as the winds change direction, the assumption we hear the most is that things must be turning bad.
When a team wins 22 games in a row, that first loss feels kind of strange...
So, yes, the Niagara real estate market is changing. But, in essence, it just had a 22 game win streak. Week after week of record sales, heated demand and some pretty alarming sales prices have conditioned us into a new set of expectations, realistic or otherwise.
But what if instead of things turning negative, we are seeing a market adjust back towards some form of normal?
With that said, this Volume 6 of Statistical Charcuterie is designed to simply offer a quick glimpse into the overarching trends in the marketplace.
Number of Sales
One of the most alarming aspects of the market recently has been the sheer volume of homes sold. In fact, April and March of this year now hold 1st and 2nd place respectively in terms of the number of homes sold in a month for the Niagara Region. In case you've forgotten, those months were largely COVID lockdown months.
These graphs show how the volume of sales has trended back towards monthly normals.
The pink line shows the monthly number of sales of 2021
The black line shows the average monthly number of sales going back to 2011.
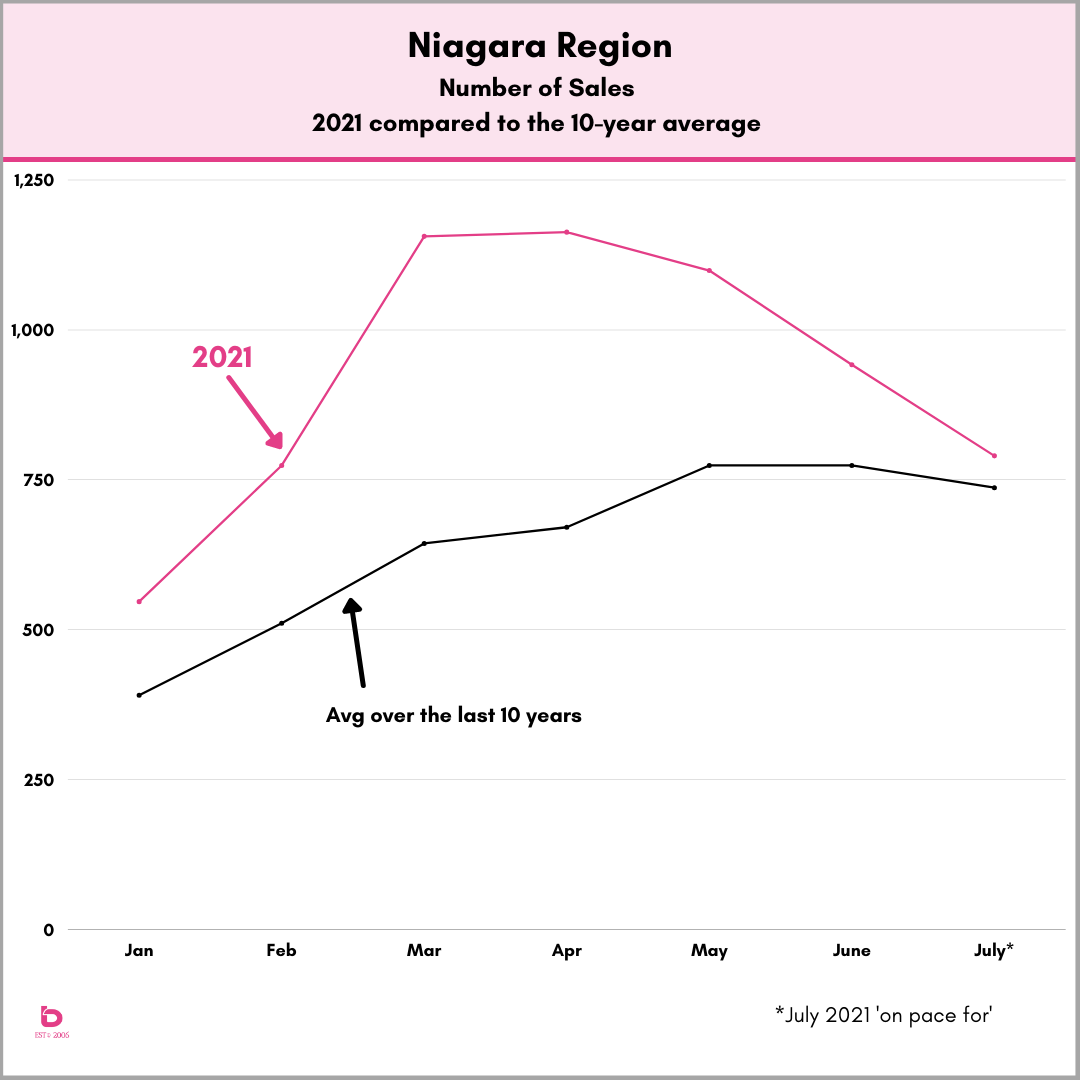
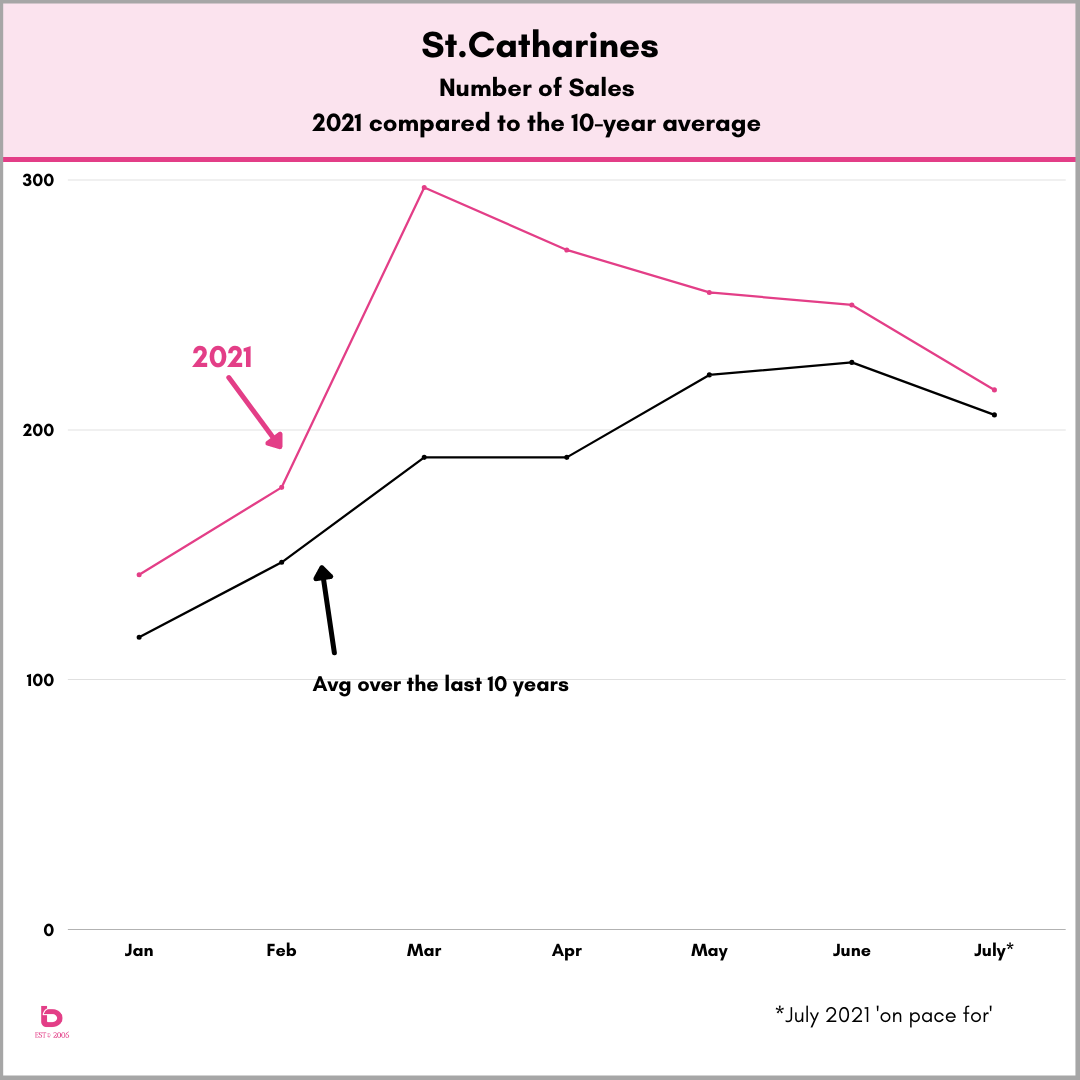
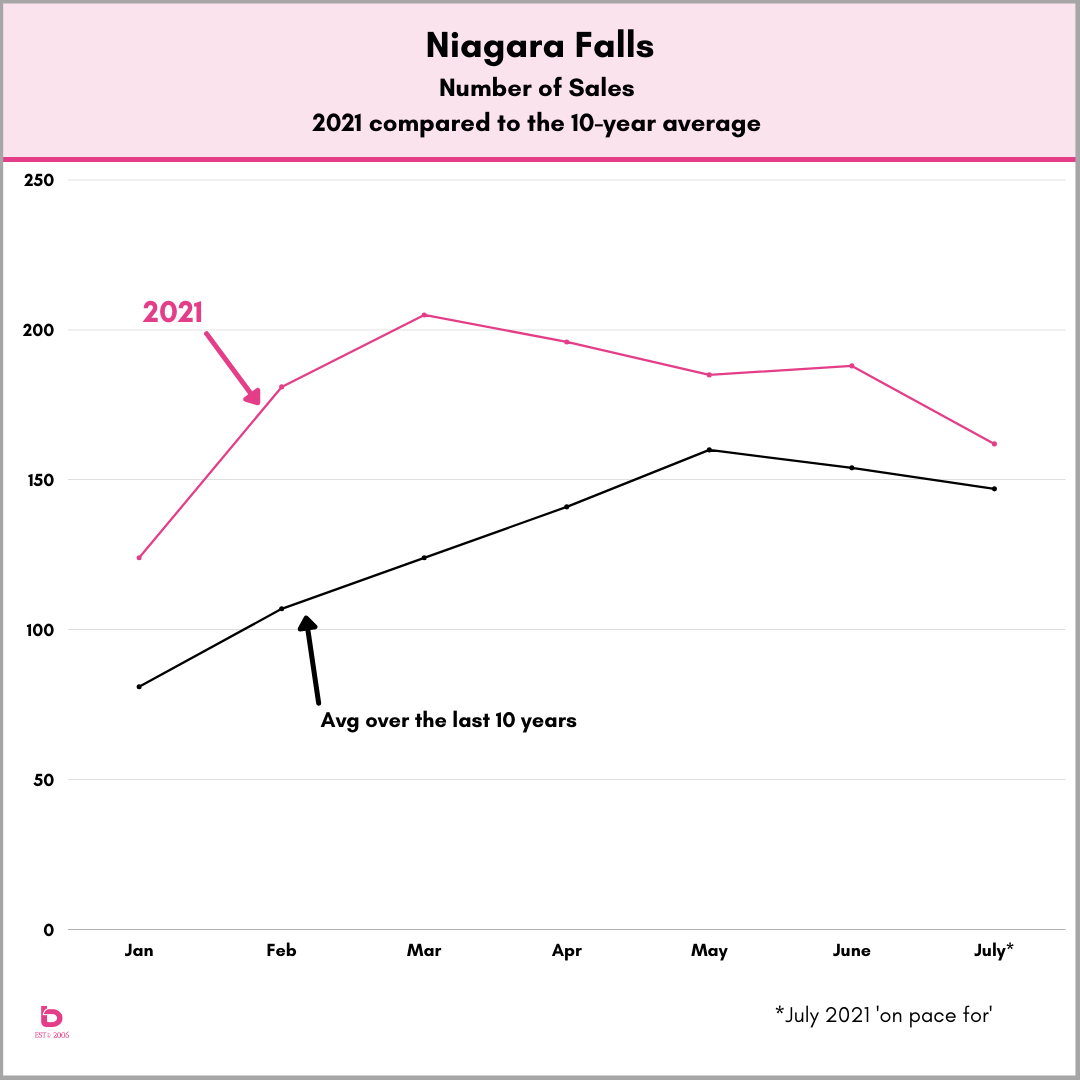
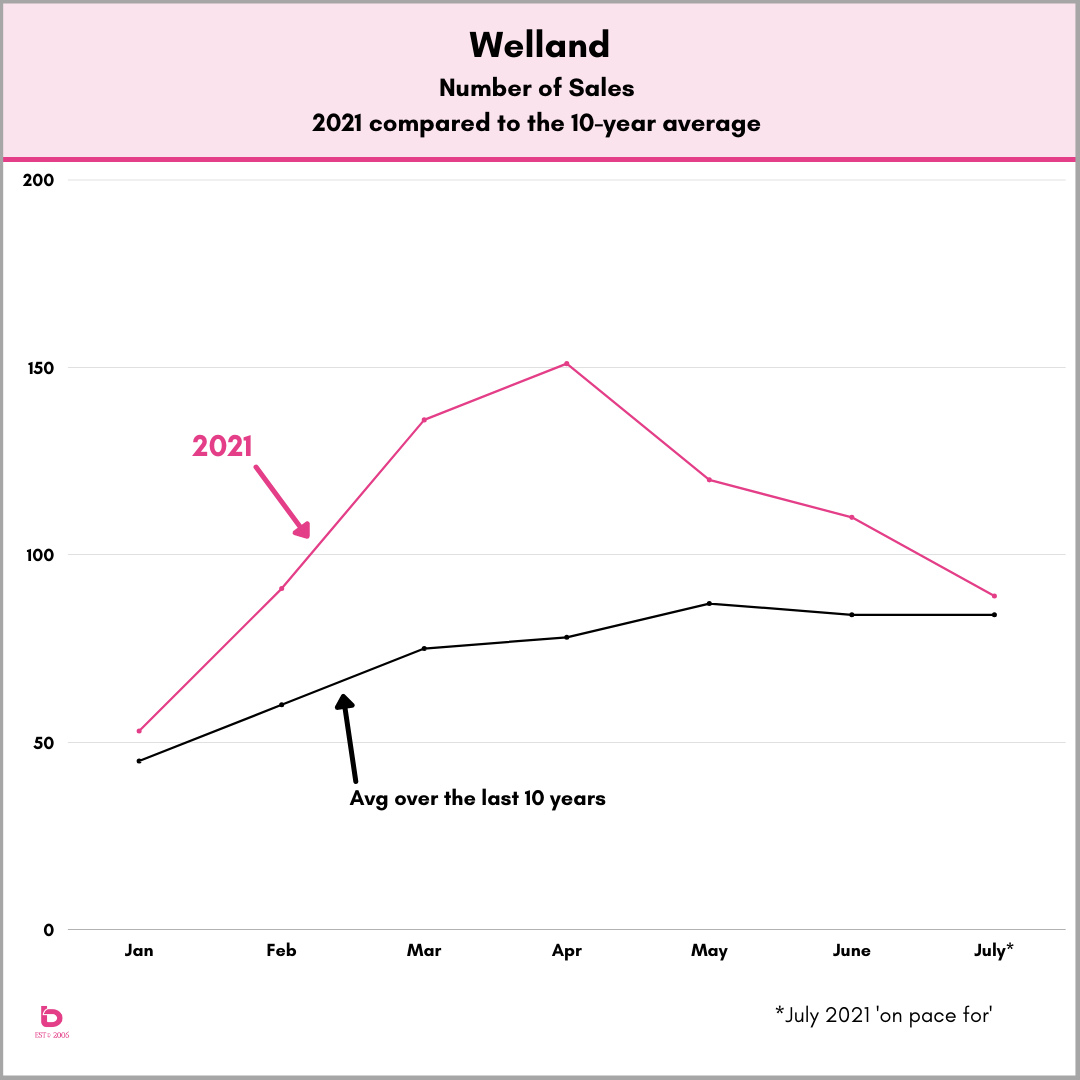
Those graphs show Niagara Region as well as the number of homes sold in St.Catharines, Niagara Falls & Welland which are the top 3 producers of sales in Niagara. It's worth noting though that the same trend carries through regardless of what city you're looking at.
Days on Market
Otherwise known as "how long will it take me to sell my home?"
There are numerous aspects of any market that typically move in some kind of parrallel. It should be no surprise that as a market calms down, the time to sell will get longer. Rather than single digit days on market, the average (note: average) will start to trend upwards.
These graphs tell the story well...
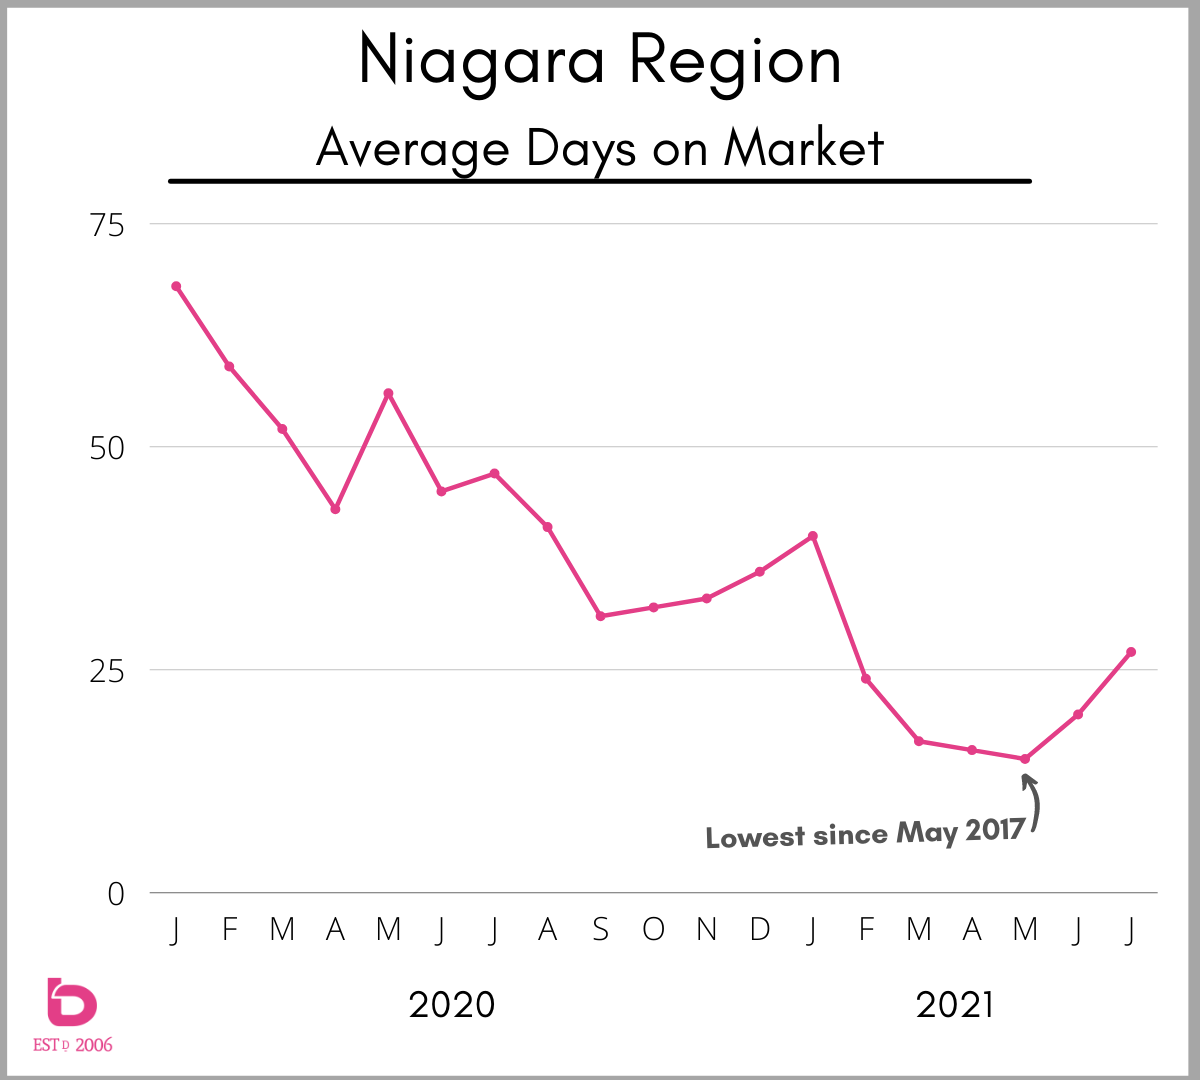
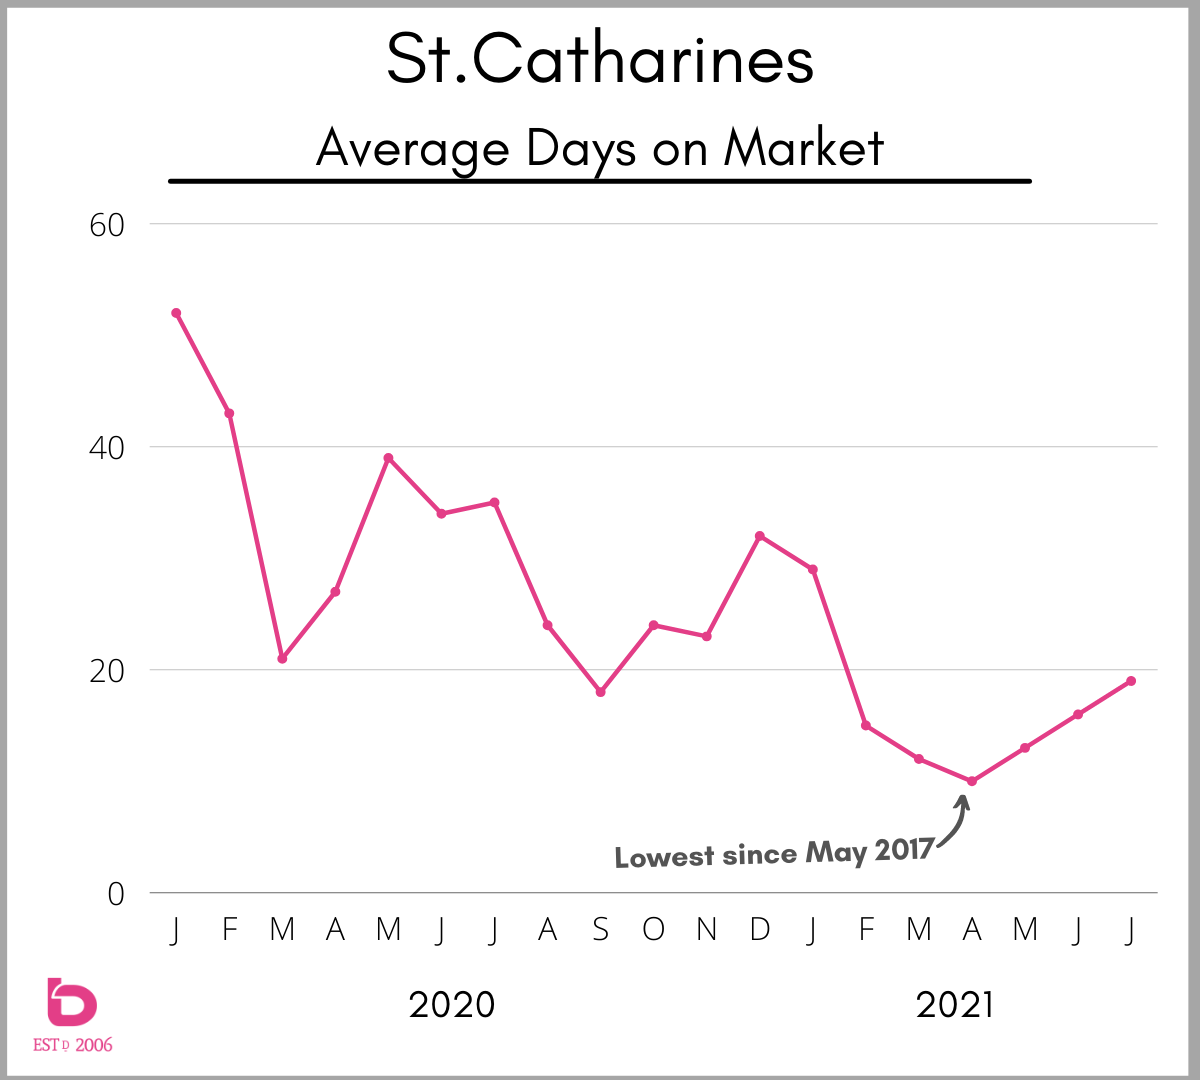
Does that mean all homes are now taking longer to sell? Absolutely not. This data is the average. As often as you'll see a house sell in 34 days, you'll still see a portion of the market that is sold firm within a week.
...and yes, the same trend carries across Niagara, regardless of whether you're looking at homes in Fort Erie, Fonthill, Niagara-on-the-Lake or Grimsby.
Number of Active Listings
Otherwise known as "there seems to be more (or not many) homes on the market these days!?"
As the number of homes sold eases and the time it takes to sell increases, the end result is typically going to be more available homes on the market. This graph, at first glance, is a bit daunting but its quite simple.
Each line represents the number of active (or available) listings each month in the given year for St.Catharines real estate. Here goes:
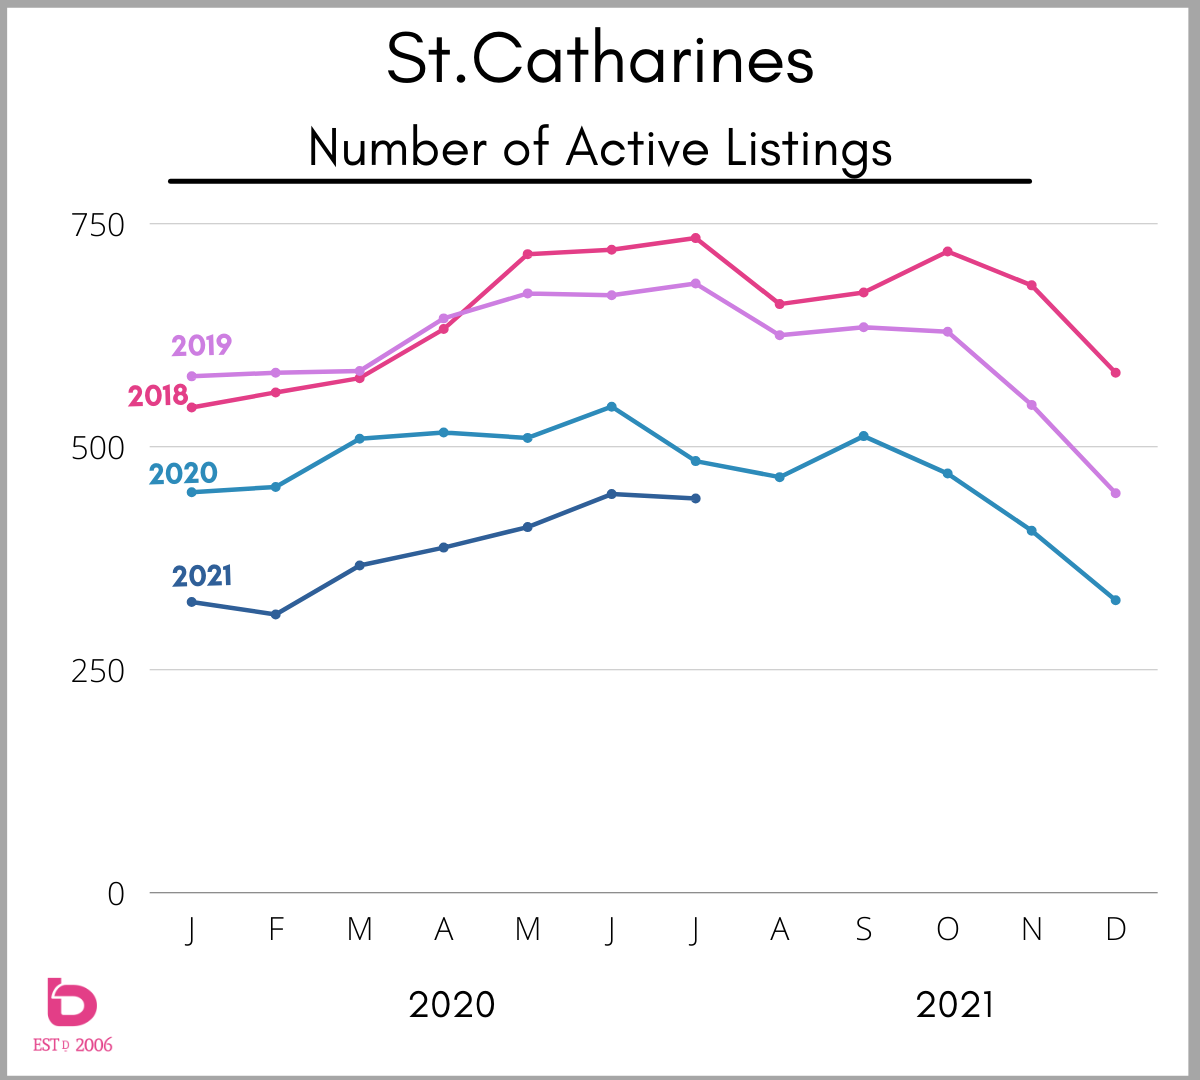
You can see how markedly different the first 3 or 4 months of 2021 has been in comparison to the previous 3 years. As things trend towards healthier numbers, we still have a ways to go to get to some form of typical as far as the number of homes for sale in St.Catharines.
The lower the line = less active inventory = buyer frustration = escalating prices = early 2021.
The line gets higher = more active inventory = buyers getting happier = prices settling = last half of 2021?
Million Dollar (and up) Sales
Sale prices across the region have shown serious growth over the last few years which has seen the number of homes sold over $1 million in Niagara grow to new levels. In fact, that end of the market has gone from 1 or 2% of all homes sold to 10% (+/-) of all homes sold in just a few years.
This graph illustrates the growth in this "higher end" of the market:
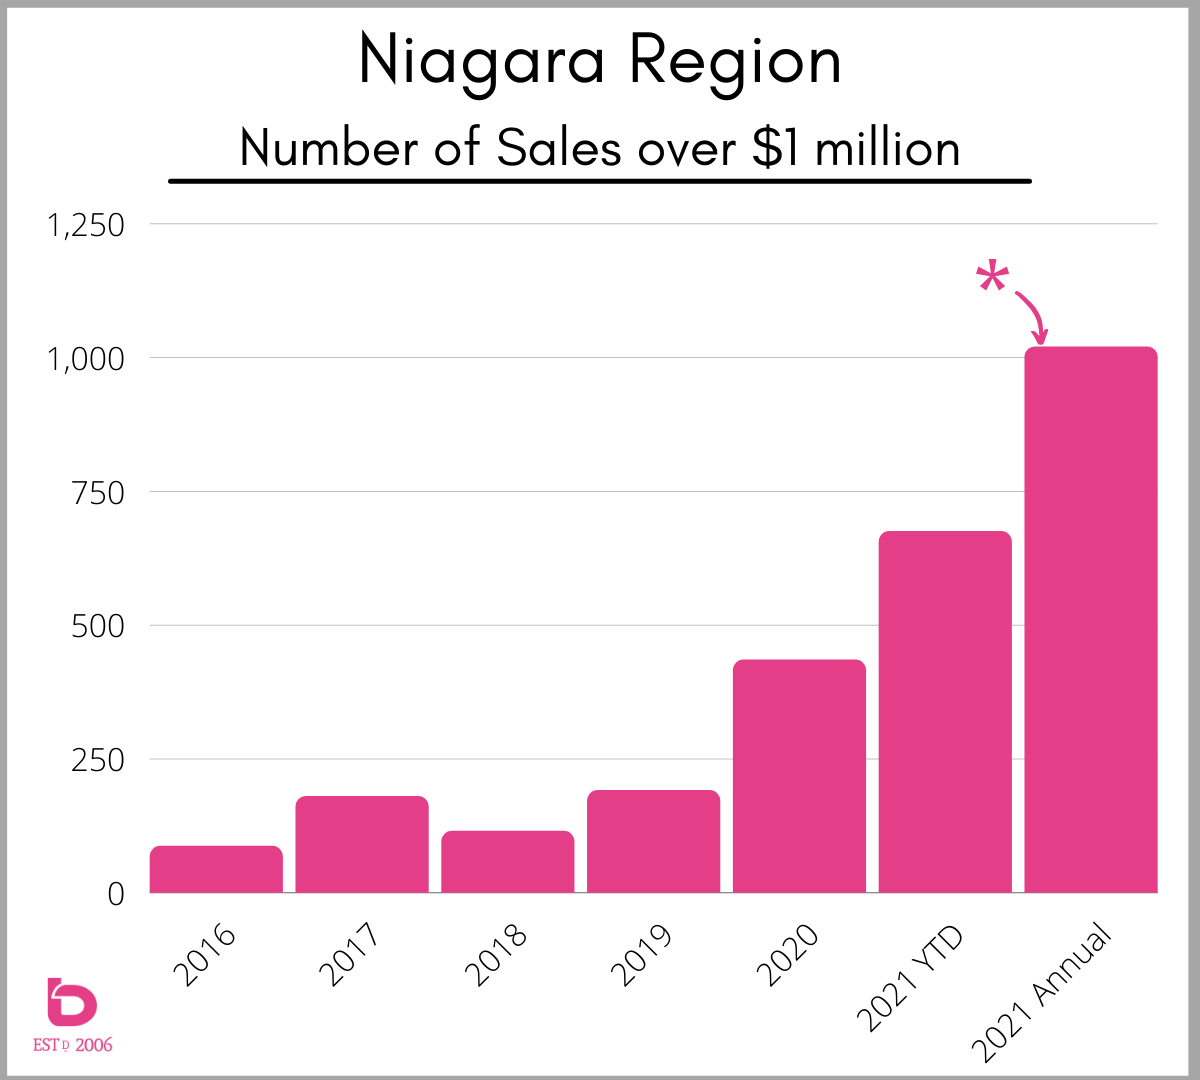
You'll see 2 values for 2021:
2021 YTD: the number of sales over $1 million as of today, July 27th.
2021 Annual: we calculated a daily rate and rather than multiply by 365, we adjusted the number recognizing that the back half of 2021 is not going to produce the same data as the first half.
That should do it. There is a ton more to serve up but in the spirit of charcuterie, we should save room for dinner.
On that note, if you'd like ot take a deeper dive into the current Niagara real estate market, look no further:
Questions? Thoughts? Please do not hesitate to contact us anytime. We're here & ready to chat real estate in Niagara.
Thank-you for visiting.