

This is written in the morning of February 8, 2021.
How are things so far...
So far in 2021 there have been 711 homes sold in Niagara. The range in sales price was between $106,000 and $4,500,000.
Remarkably, nearly 10% of the 711 sales were over $1 million which speaks to the expansion of that end of the market.
Even more remarkable is that those 711 homes sold for an average of $666,075 which was 103% of the asking price. Those list/sale ratios are at levels we haven’t seen since the 2016 market.
How does that compare to last year?
First, it’s worth noting that January and February 2020 were historically very strong months. That being said, from January 1 - February 8, 2020:
There were 633 sales, which means that 2021 was up 12.3% over 2020. The range in sales price last year was between $152,000 and $1,800,000.
And...only 3.2% of those 633 sales were over $1 million.
Not to overuse the word remarkably, but in the huge year of 2016, during this same time period of January 1 - February 8, there were only 2 sales over a million.
The 633 sales in 2020 sold for an average of 97.9% of asking.
What was the average sale price during this time in 2020? $484,317. So in comparison to the 2021 numbers, the average sale price over that time frame was up a whopping 37.5% this year versus last year.
So why are prices appreciating so quickly?
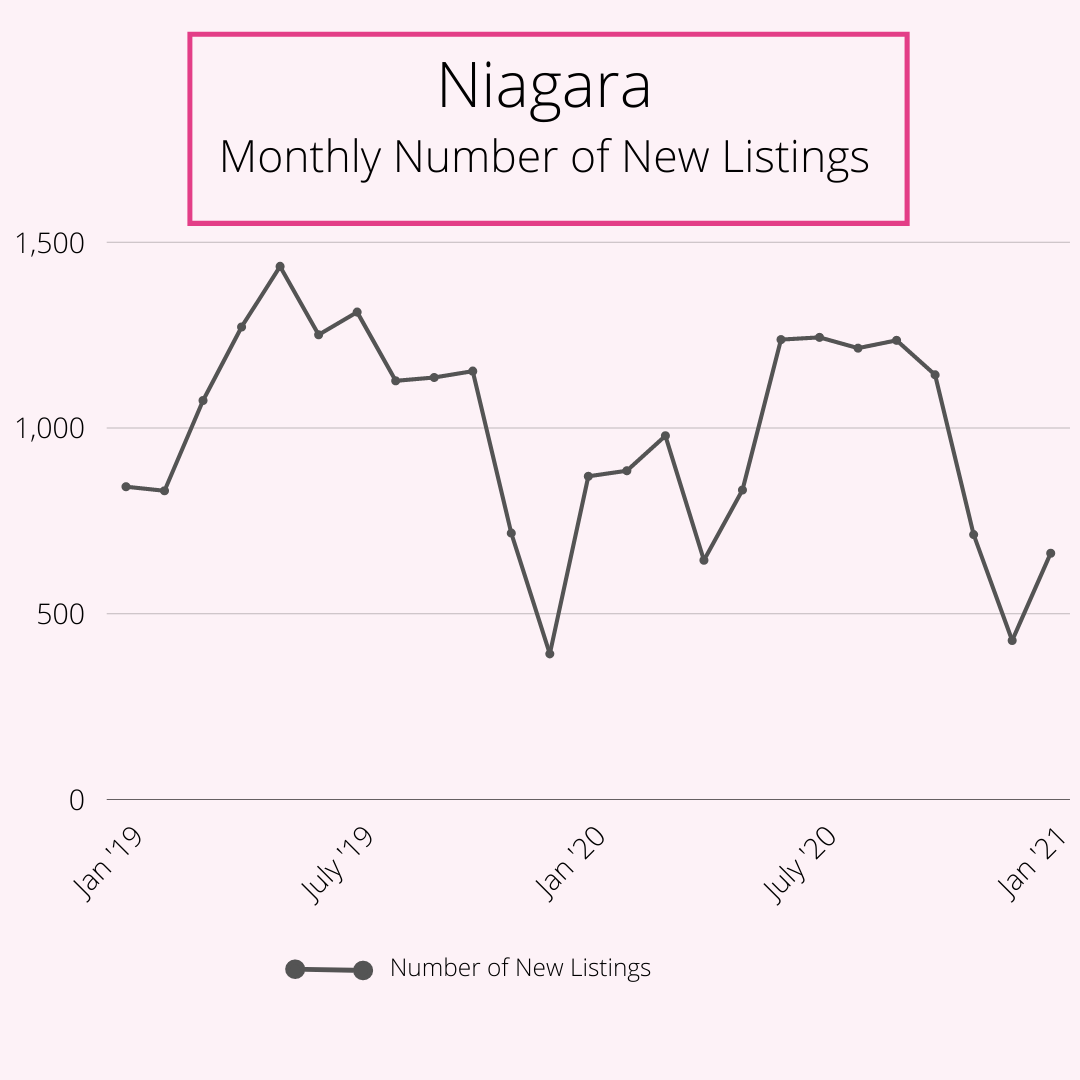
This graph shows you the number of monthly new listings going back to January 2019. It may not look like anything spectacular however keep reading...
This graph looks at the number of homes sold over the same time period. It’s important to note that on a monthly basis, the market set records from July 2020 going forward. Each month, that supply and demand ratio tipped more in the favour of the seller.
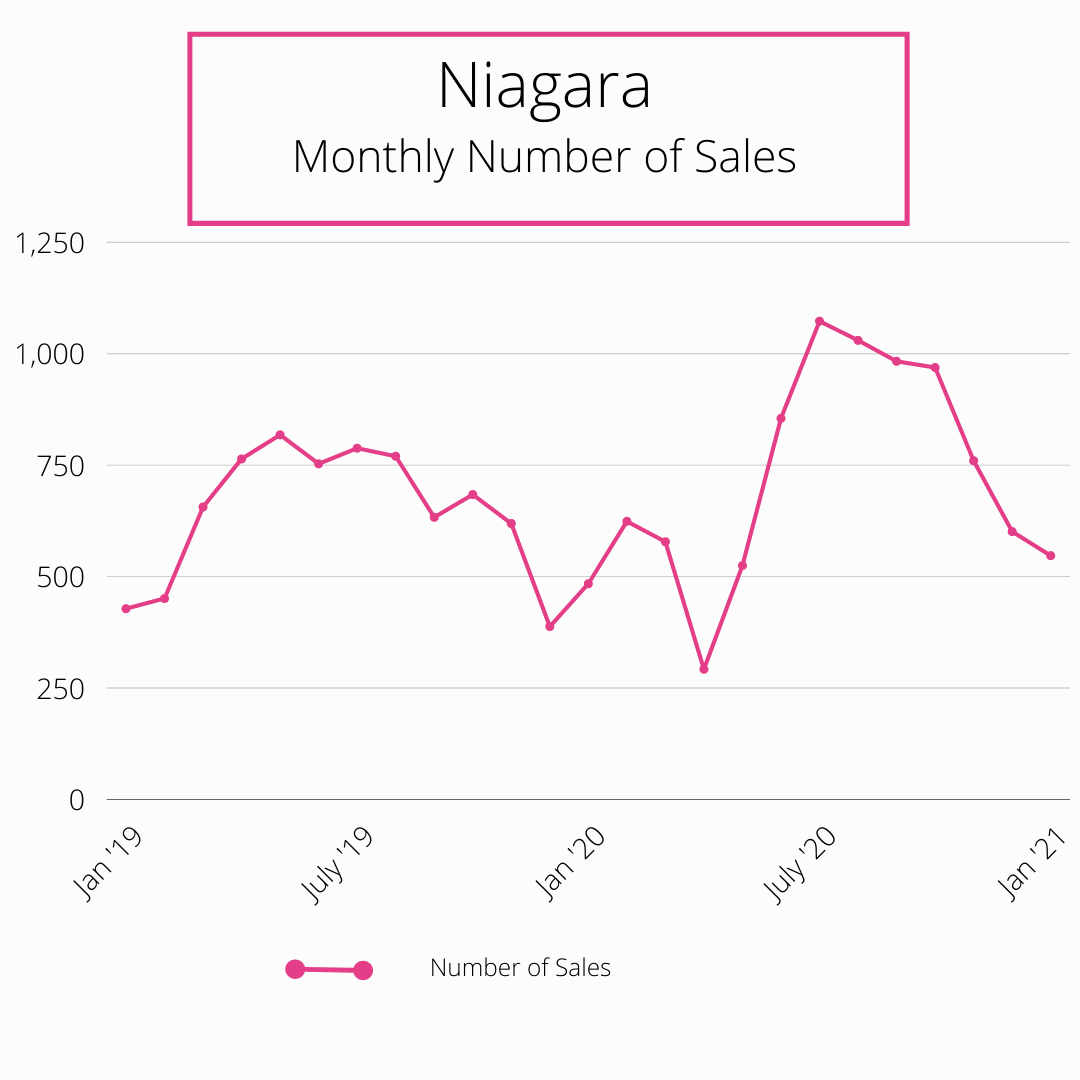
You can see from July 2020 where the volume of sales pushed up considerably. Again, from July 2020 through the balance of the year, one month after another set new sales volume records.
In general, the supply and demand imbalance in January 2021 y/y was this: The number of new listings (supply) in January 2021 were down 23% while the number of sales (demand) were up 13%.
Let's put 'em together....
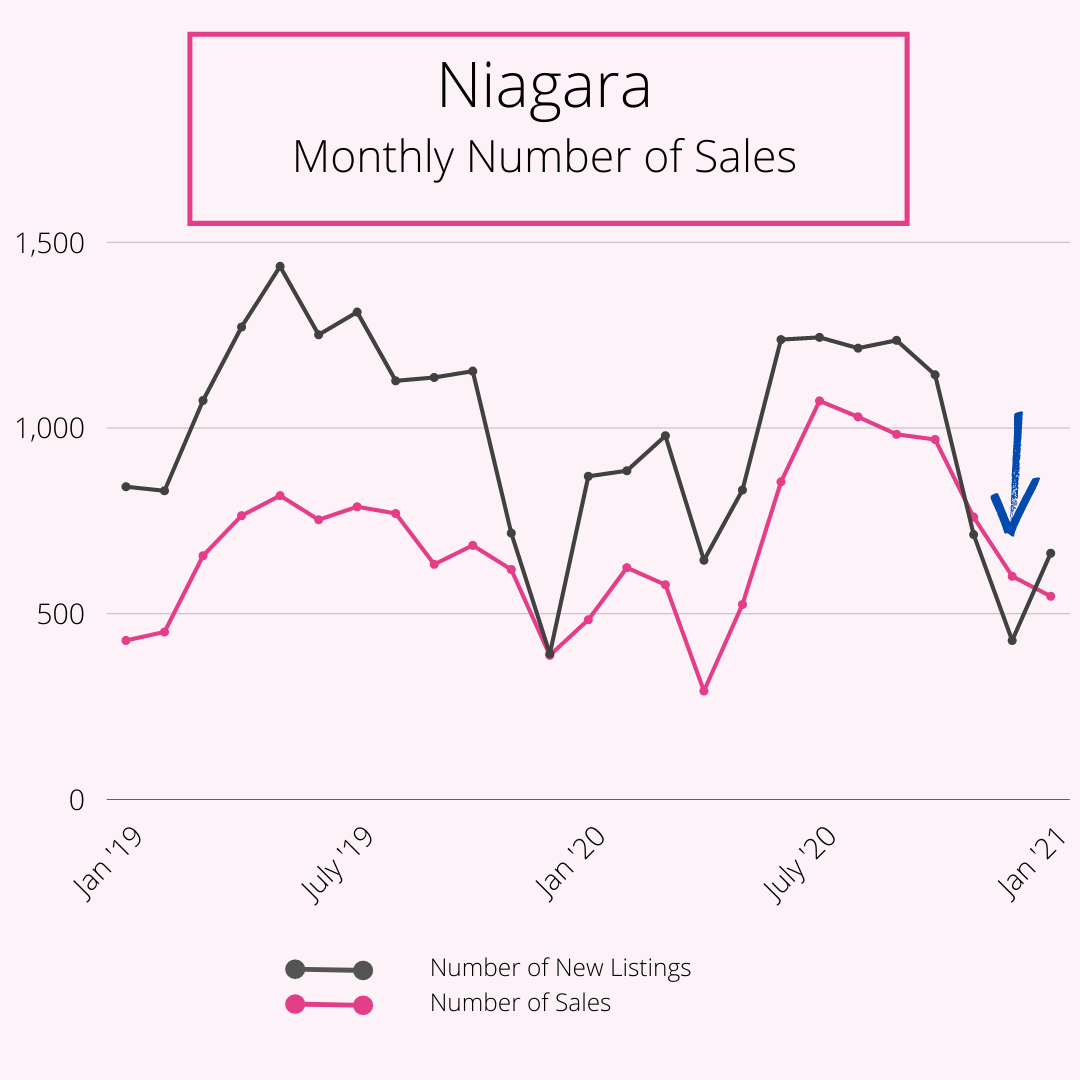
This graph shows you the number of new listings and sales on the same graph. Note how tight it has been since July to the point that sales outstripped new listings for nearly 3 straight months. (see blue arrow)
Where does the market go from here?
Several factors are going to determine the overall market dynamics over the next 2 or 3 months:
- when does COVID ease? (vaccines, lockdowns, overall numbers)
- how many sellers need/want to sell but are waiting for COVID to back off somewhat
- this is not typically a heavy volume time of the year in spite of what buyers may have you think
- how many out-of-market buyers are going to arrive on the scene once COVID eases
If the COVID impact easing has the same effect on sellers selling as it does on buyer demand, then we may not be in any different position. February & March will be a big indicator in that.
What's happening in St.Catharines detached homes?
Lastly, it's no secret that the detached market in St.Catharines is intense. Here are the real numbers for the last 30 days for detached home sales:
ALL detached:
98 sales
Average asking $632,000
Average selling $661,000 (105% of asking)
53 active for sale.
11 of 53 have offers in place.
13 of 53 are over $1 million
Average asking $980,000 (heavily skewed by $1 million + listings)
Priced under $750,000:
79 sales
Average asking $509,000
Average selling $548,000 (108% of asking)
35 active for sale.
6 of 35 have offers in place.
Average asking $542,000
Priced under $500,000:
22 sales
Average asking $377,000
Average selling $415,000 (110% of asking)
15 active for sale.
1 of 15 have offers in place.
Average asking $431,000.
What does this tell you? In general, there is strong demand across the detached market with an increasingly competitive market as you get into the "entry level" end of the market.
That's a wrap on volume 3. If there is anything you'd like served up on volume 4, please do not hesitate to contact us anytime.
As always, thank-you for visiting. :)