

What. A. Year.
2021 will go down in the record books, setting numbers and levels that we may never see again. (Note: we'll probably be proven wrong on that but it sounds good for now).
One of the consistent debates has been about a lack of supply. The refrain of "there aren't enough listings"! Well, some of the data shows otherwise. We saw one month up 34% while 2 months later supply was negative 22%.
That up & down produced the roller coaster ride that 2021 was.
What Really Happened With New Listings Supply
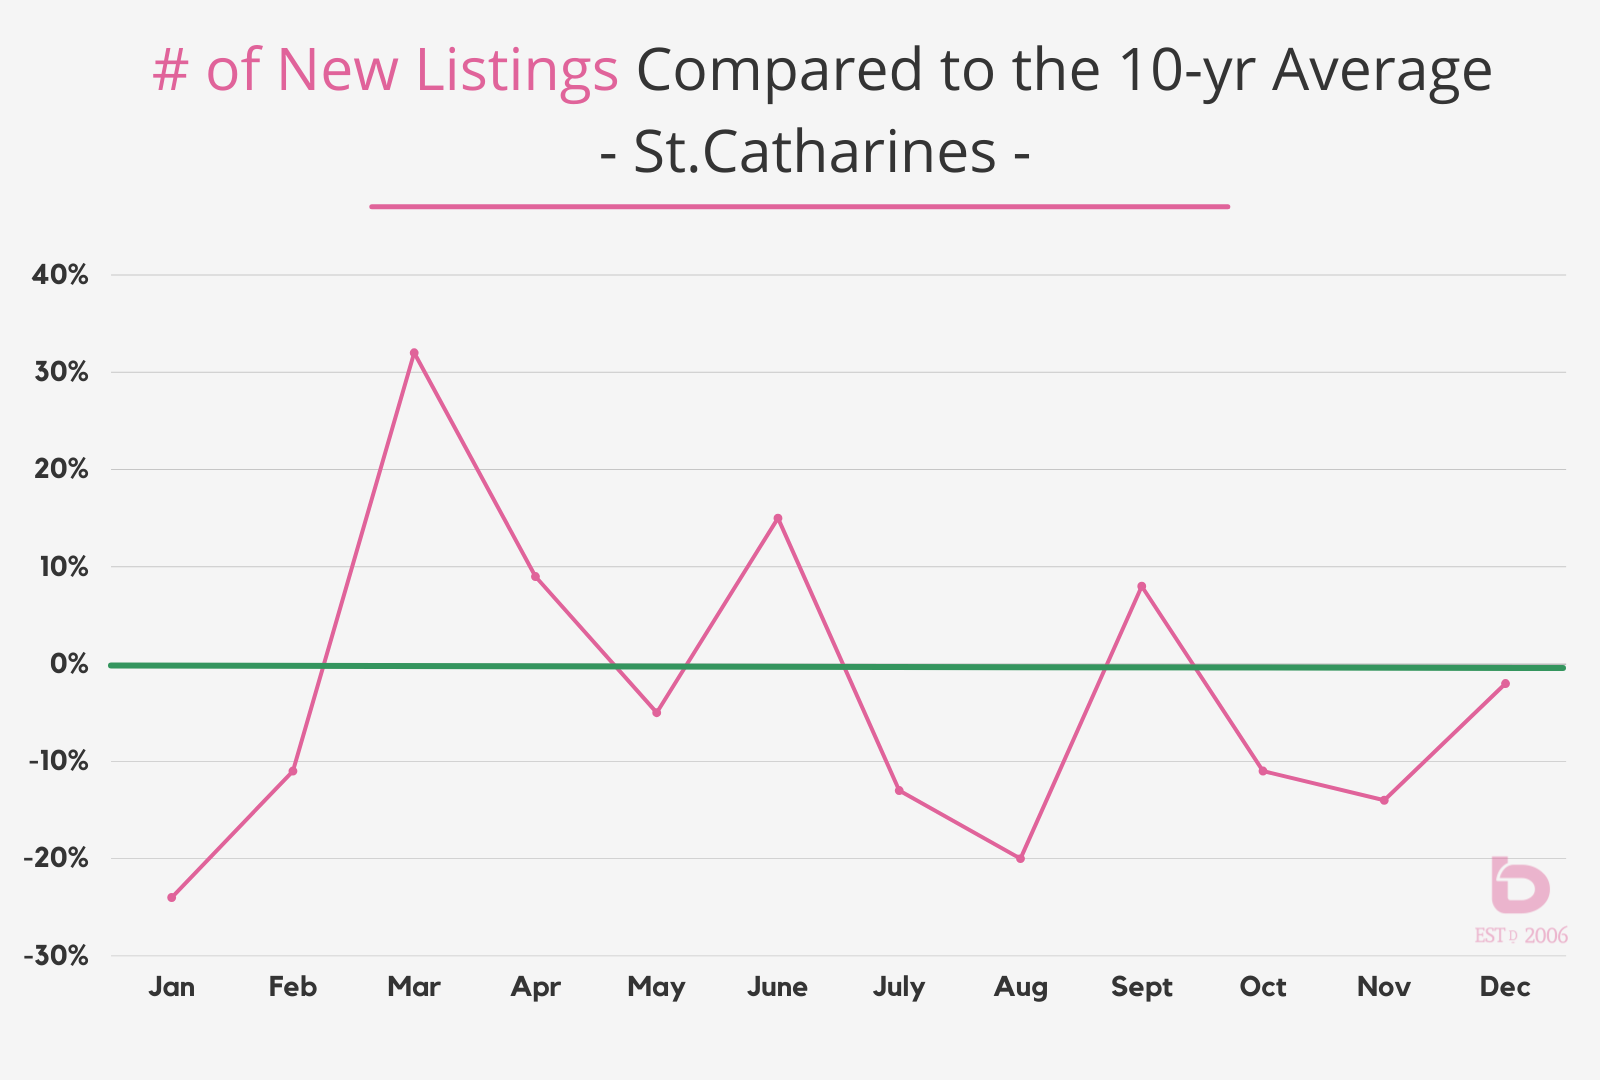
This first graph shows the number of new listings in St.Catharines for each month in 2021 compared to the 10-year average for that month.
Note: the green line represents zero so anything above the green line is above average while anything below the green line is below average.
But... it wasn't just about being below average. It was about volatility as the months that were above average helped offset the losses.
Notice 8 of 12 months in 2021 were BELOW average for the number of new listings.
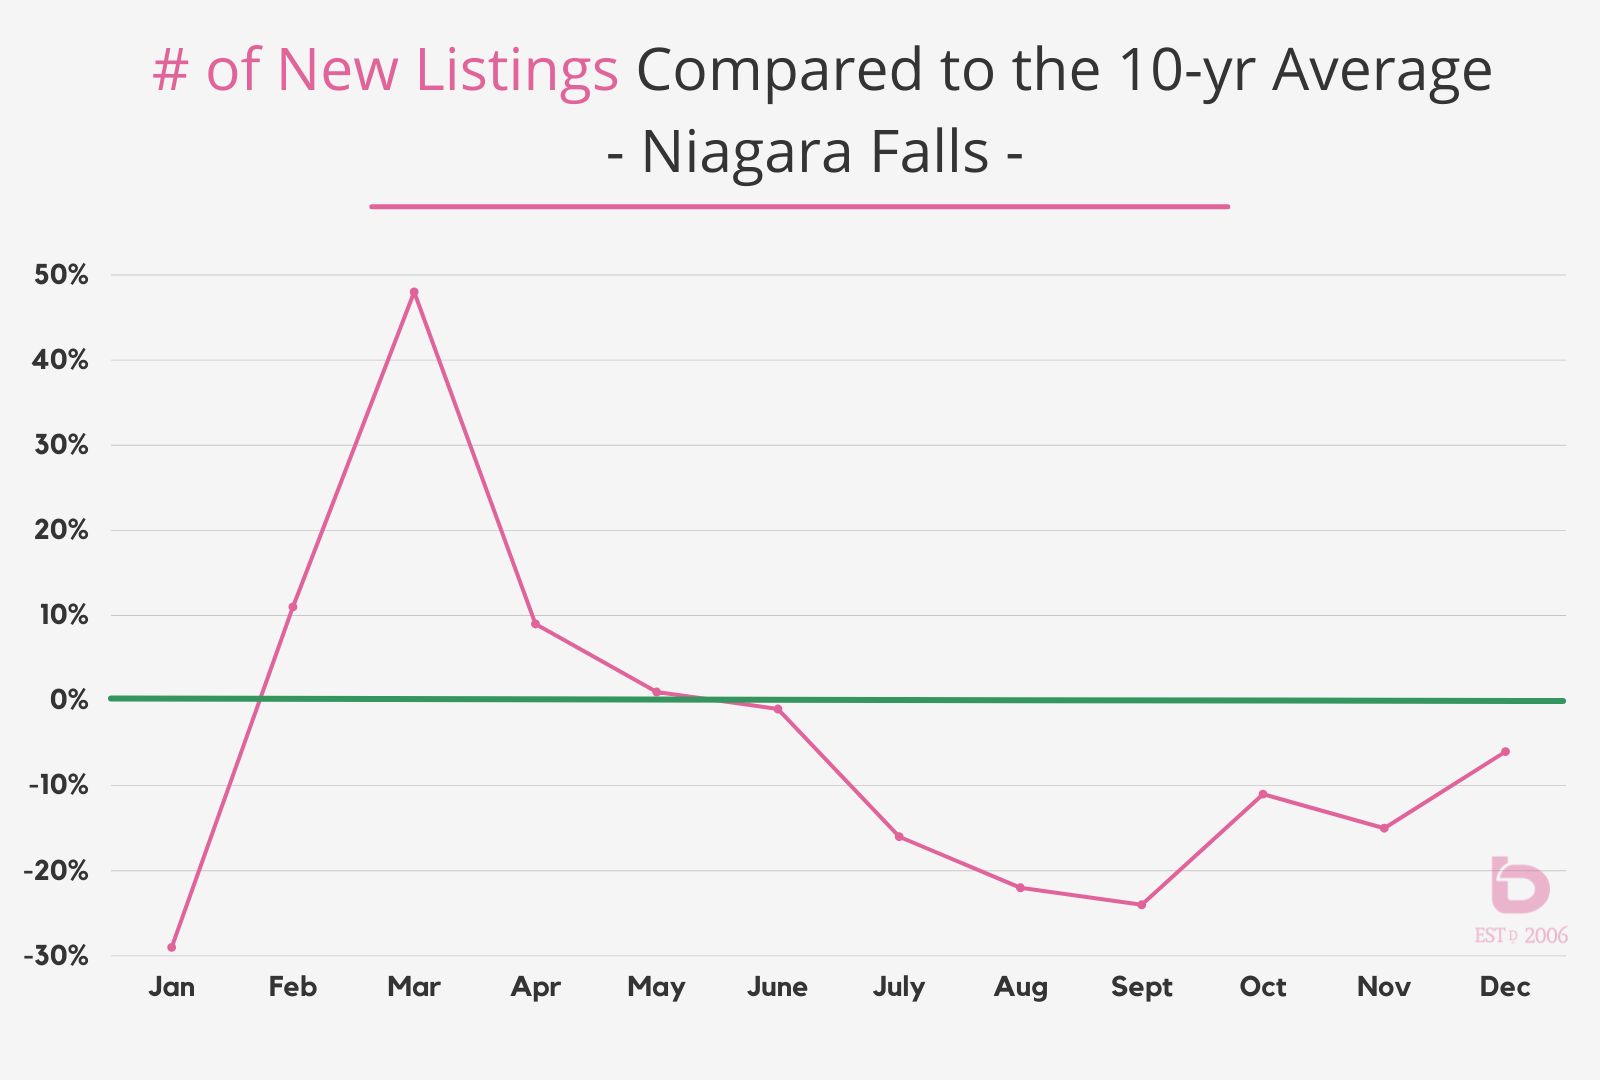
How about Niagara Falls?
Same deal but different.
2 key points. Again, 8 of 12 months were below average however note how weak the last half of 2021 was. One month after another of weak supply. If it wasn't for the epic start of 2021, listing inventory would have been in worse trouble than it was.
The Demand (# of Sales) Was Epic & Record Breaking
Looking at each city in Niagara, all but 2 set all-time 1st place, highest number of sales ever. Here is a bit-sized summary:
| City | Place |
Notables |
|
Niagara Region |
1st | First time ever with more than 10,000 sales |
|
St.Catharines |
1st |
Edged out 2016 by just 25 sales to claim top spot |
|
Niagara Falls |
2nd |
2016 is still The Champ but it was close |
| Welland | 1st |
A huge year, 20% higher than 2nd place 2020 |
|
Fonthill |
2nd | 2nd place behind 2020 which only had 5 more sales than 2021 |
|
Grimsby |
1st | The first year with over 700 sales |
|
Lincoln |
1st | Just 5 sales short of cracking 500 sales for the first time |
| Niagara-on-the-Lake | 1st |
A huge year, just 12 sales short of cracking 500 sales |
|
Thorold |
1st | First time over 600 sales, nearly double the total in 2018 |
|
Fort Erie |
1st | Nearly 1,000 sales for the first time ever |
|
Port Colborne |
1st | A big year, cracking 500 sales for the first time ever |
So, yes, no matter where you look, 2021 was a big year in sales volume.
"Hey! We want a graph!"
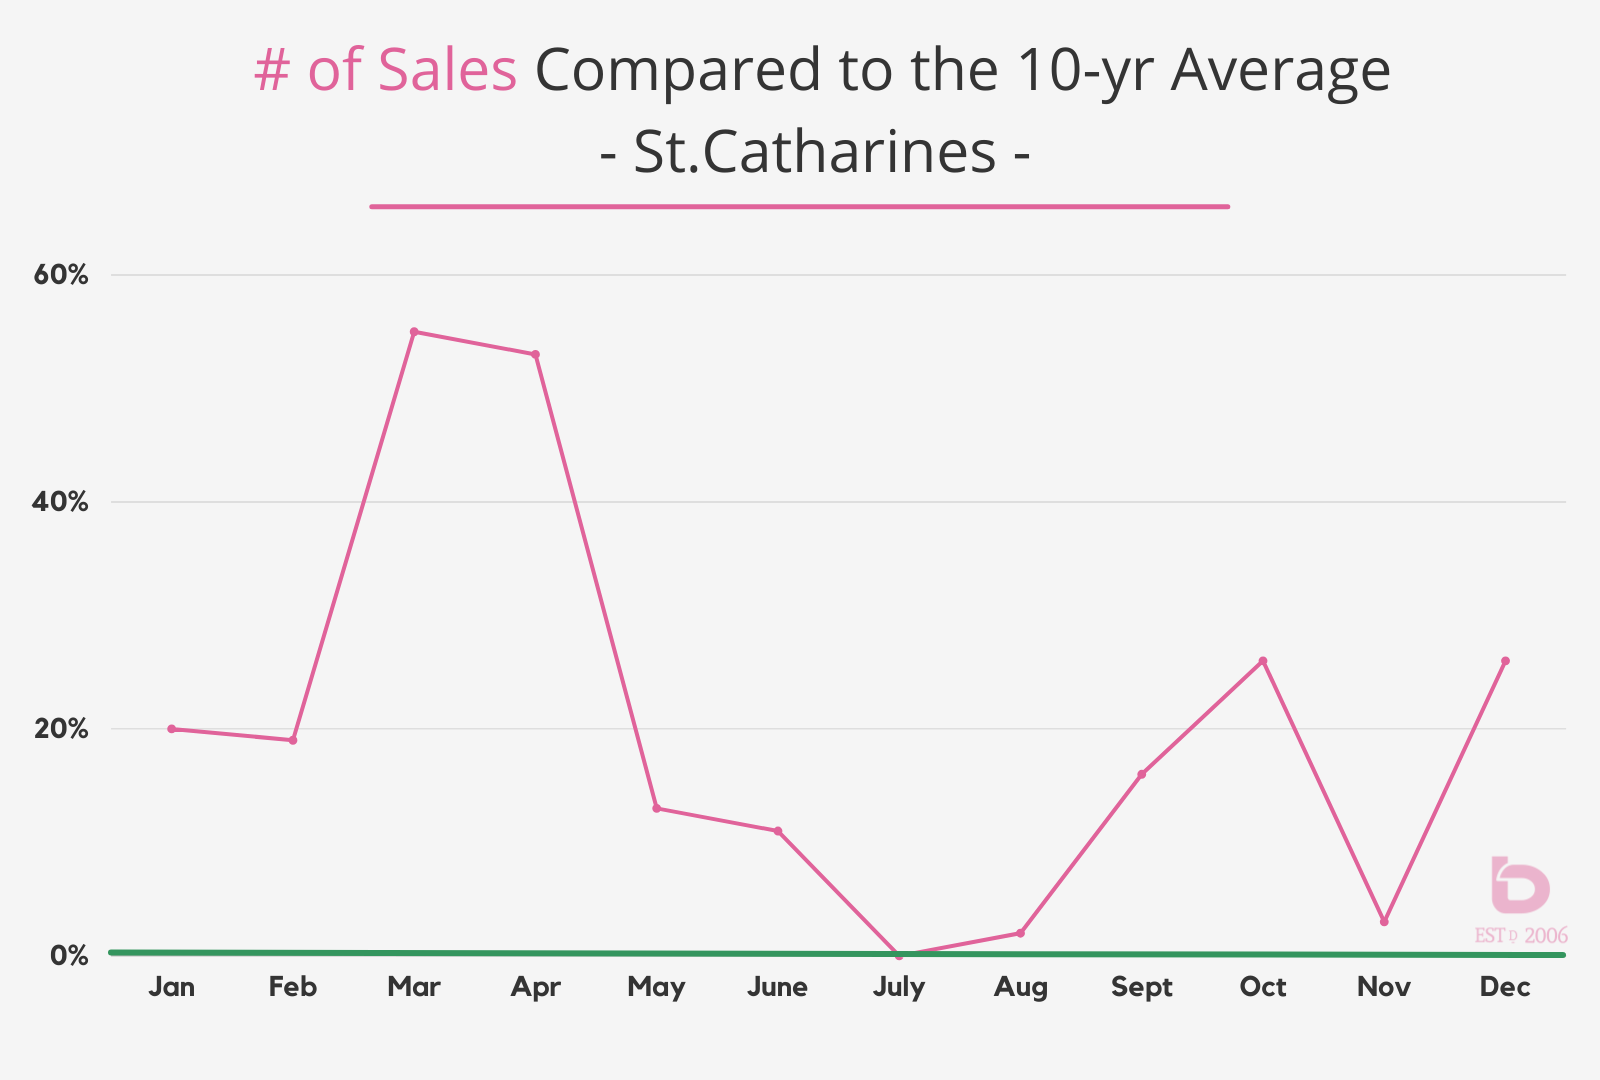
Ok...here is the sales graph for St.Catharines, again showing each month in 2021 compared to the average.
The closest 2021 got to negative territory in sales was July which was flat or very much average. The reason for that was purely COVID related. Remember when restrictions eased and everyone ran off to a cottage or a BBQ or a show? It was a time that was about everything but real estate.
Similar deal for Niagara Falls:
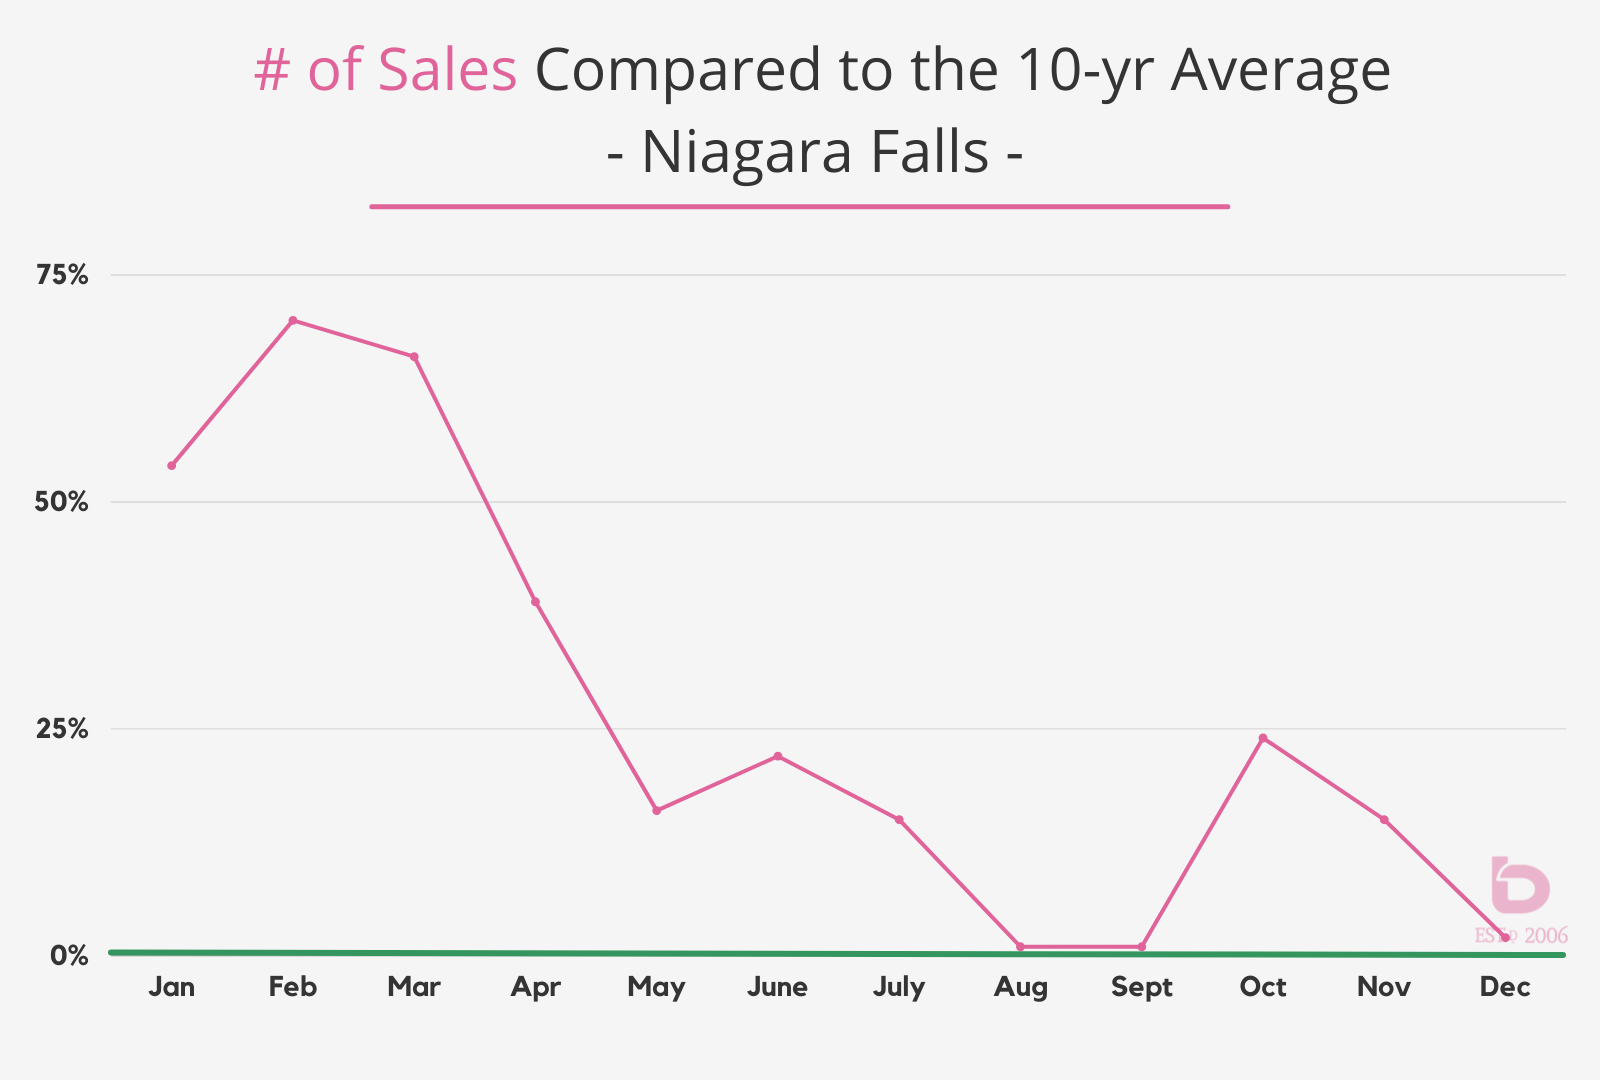
You will see though that things definitely started to calm down towards the end of the year after sales were at sustained record levels in the first half of the year. The maintained intensity at the end of the year could quite possibly be the huge number of buyers who were unable to find something in the exceedingly competitive first half of 2021.
Prices up (2017). And up (2020). And then up again (2021).
In the case of pricing, it’s tough to spin the annual price increases that we’ve been seeing. The fact is, we've seen 3 recent years shatter previous average sale price increases.
Here are 3 key points:
- 2002 - 2021 (20 years): average annual increase was 8.6%
- 2002 - 2011 (First 10 years): average annual increase was 4.9%
- 2012 - 2021 (Second 10 years): average annual increase was 12.3%
So yes, things got more intense as time went on.
What does a 12.3% annual average increase do over the course of a decade in Niagara?
Average price of a home in 2012 $234,453
Average price of a home in 2021 $708,775
As mentioned, it all comes down to these 3 years:
2021 Up 27.6%
2017 Up 22.1%
2020 Up 21.1%
The commonality of those 3 years really was sales demand. In fact, the annual price increase is in the same order of the annual sales volume. Meaning:
| 2021 |
Highest Annual # of Sales AND Highest Annual Average Price Increase |
|
2017 |
2nd Highest Annual # of Sales AND 2nd Highest Annual Average Price Increase |
|
2020 |
3rd Highest Annual # of Sales AND 3rd Highest Annual Average Price Increase |
As long as listing inventory (Supply) is relatively normal, increased sales (Demand) will only lead to price escalation.
Bigger Demand = Bigger Price Escalation
More Sales + Higher Prices = Incredible Dollar Volume
Total Dollar Volume is the total value of all homes sold. In other words, add up the sale price of all 10,050 homes sold in Niagara in 2021 and what do you get?
You get $7,123,839,395.00. ...that's just over $7 Billion (with a b) dollars.
Where the increase in sales and prices really show is that total dollar volume over the past 10 years. Have a look here:
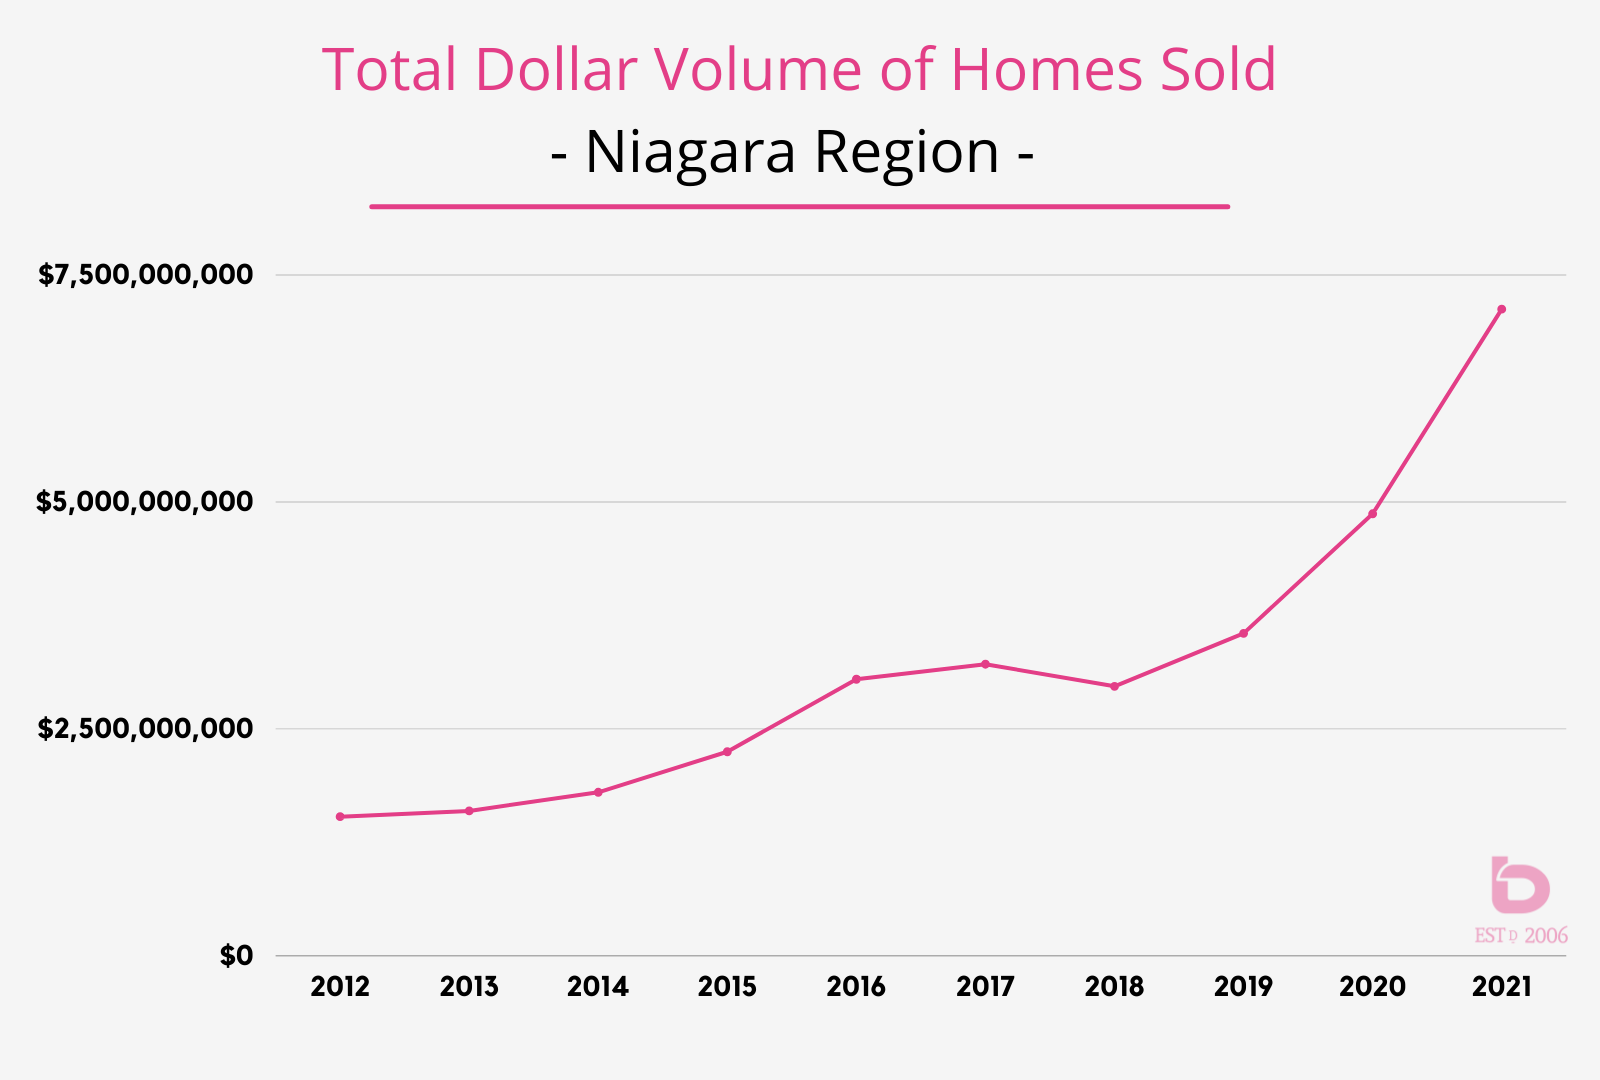
That climb from 2018 to 2021 really shows the impact that record number of sales and the resulting increase in sale prices has on the total dollar volume.
When 2021 is the same as 2012, 2013, 2014 and 2015 combined, you know something significant happened.

"Where do we go from here?"
The reality is that the supply of listings won't waiver too much from where it has been over the last several years. That is somewhere in the 11,000 - 12,000 range, plus or minus.
When sales increase from 8,000 to 10,000 in the span of a few years, then that upward pressure on everything is going to happen and keep happening.
Here in early January, we're currently in an extremely tight market with overall listing inventory creating scenarios that are tough to manage, particularly if you're a buyer looking to get into the market.
We will continue to monitor all aspects of the market but in general, hold onto your hats. We expect to see a challenging spring market that will require strategy and patience.
Questions? Comments? Want to discuss your home or real estate in general?
Reach out to us anytime. We're happy to chat real estate anytime.
EMAIL, TEXT or BOOK A CALL WITH US ANYTIME