

What exactly is going on out there these days?
2021 continues to amaze and surprise. And frustrate and confuse. It really is a market that is producing joyous highs for some and heartbreak for others.
The good news is that the data is slowly improving, at least for those looking for options and a place to call home.
There is a ton to unpack so we’ll try to cover it in general here with 3 Main Points:
1. Supply
2. Demand
3. Pricing
1. Supply
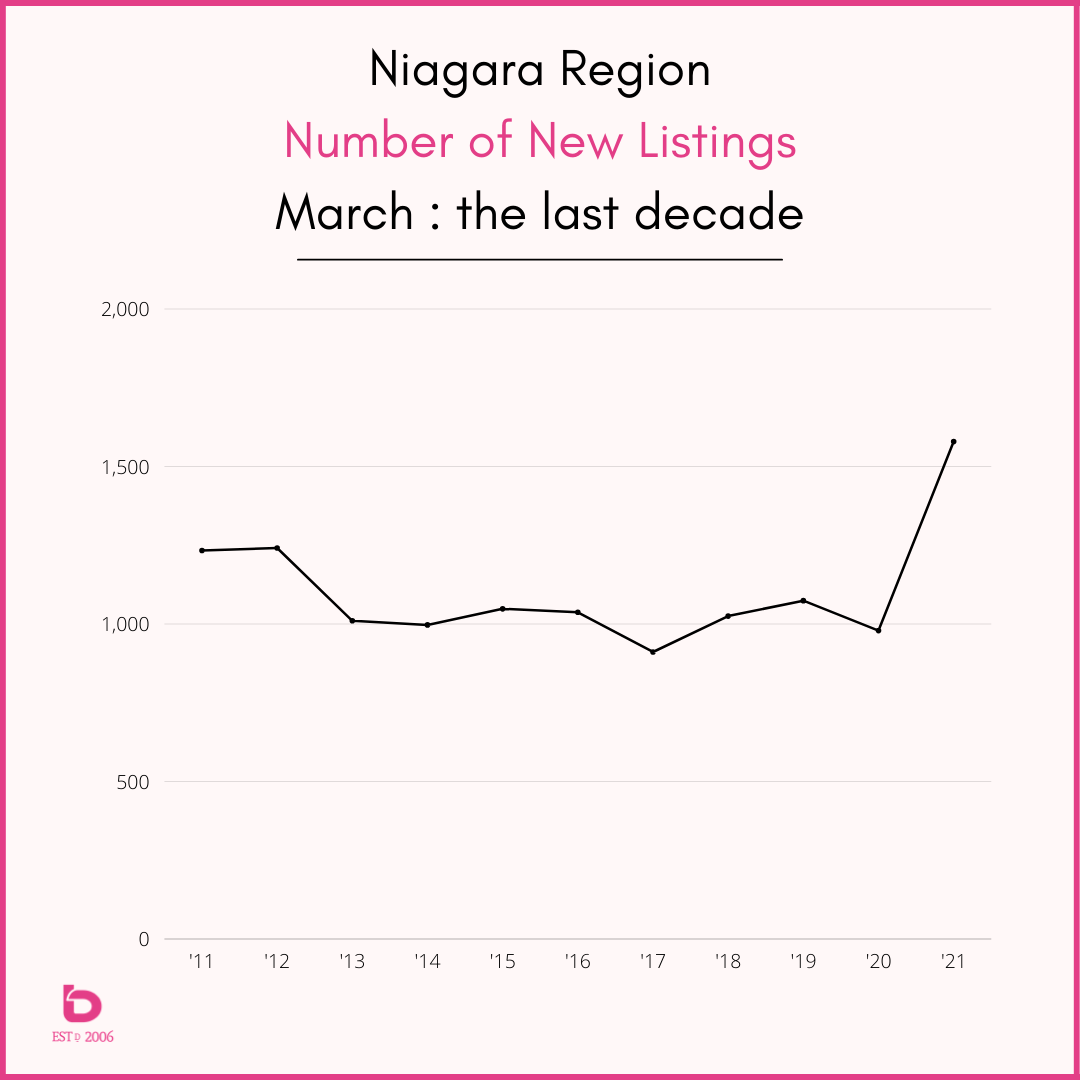
The supply (number of new listings) made big strides in March 2021. In fact, with 1,579 new listings in Niagara, that was the highest month of March in recent times. It was actually 50% higher than the average over the last 10 years.
Exhibit A: this graph is looking at the month of March specifically going back to 2011 for the Niagara Region:
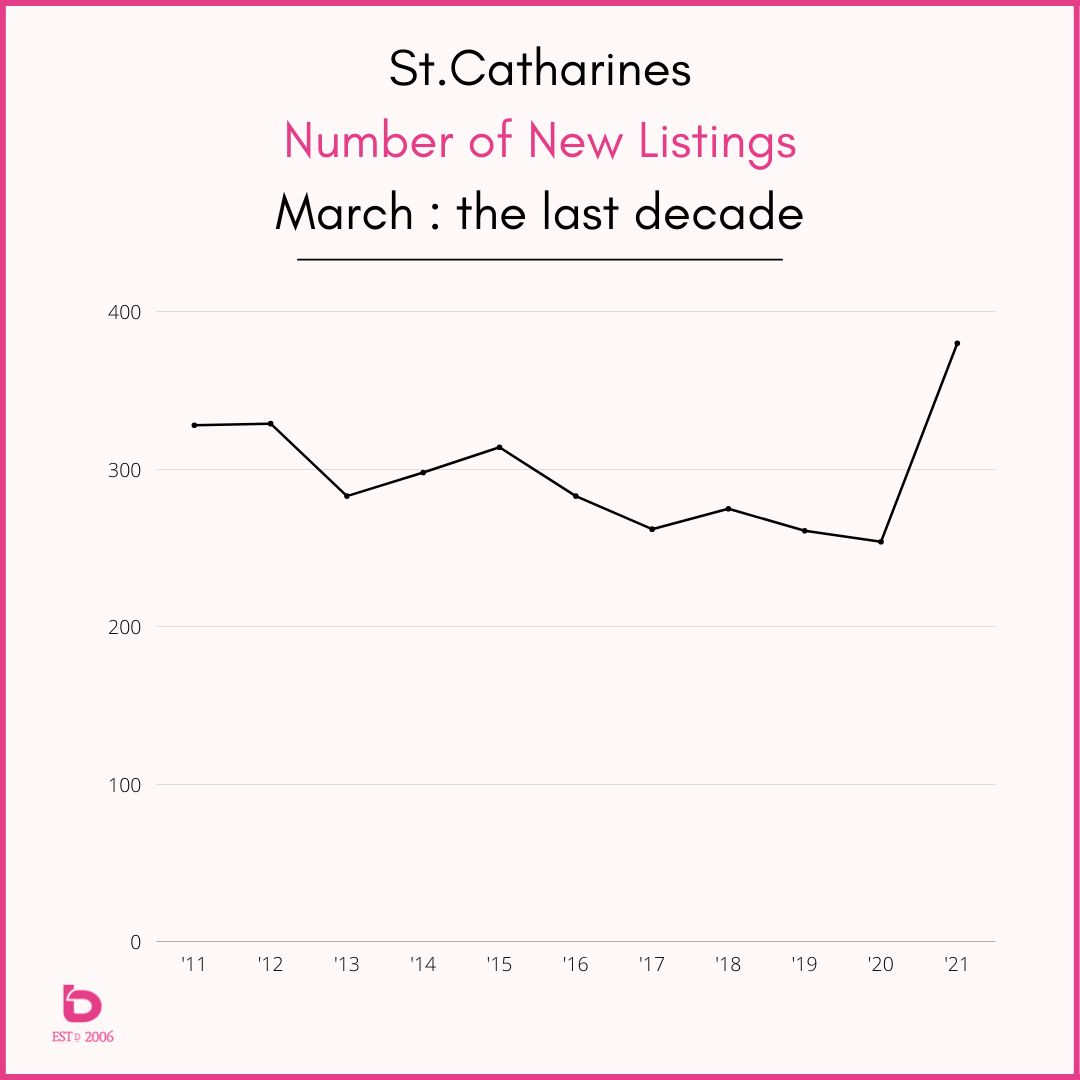
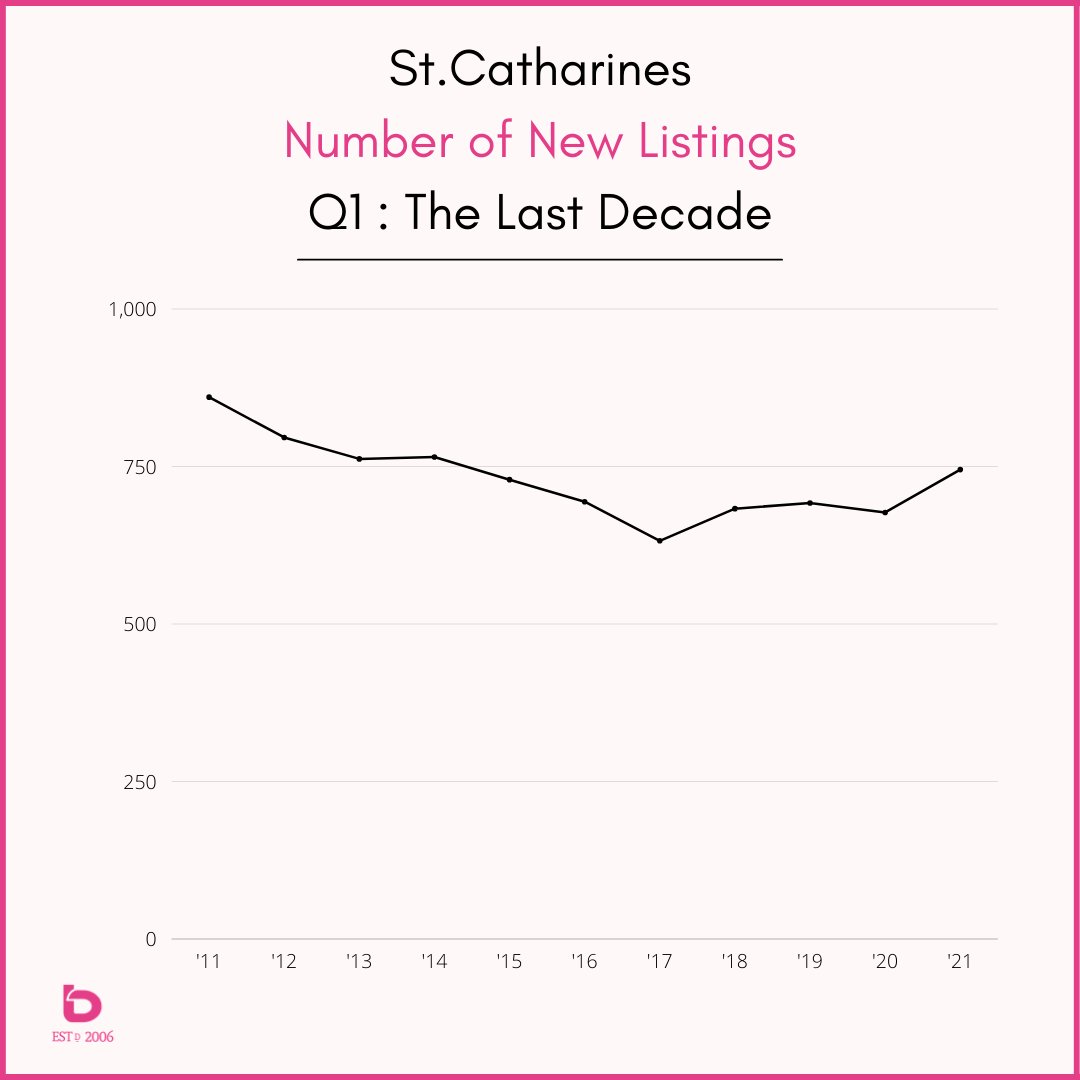
The same but for St.Catharines:
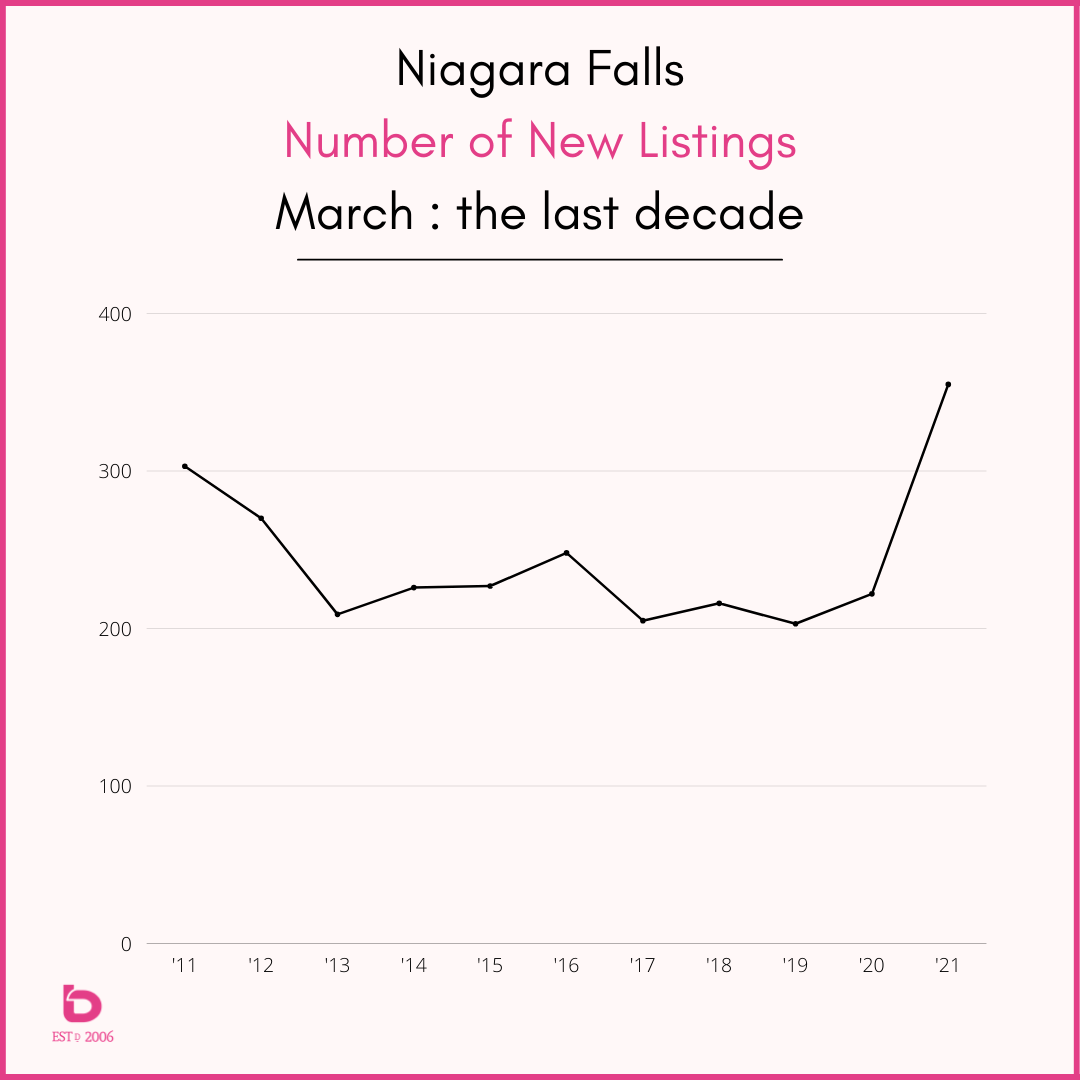
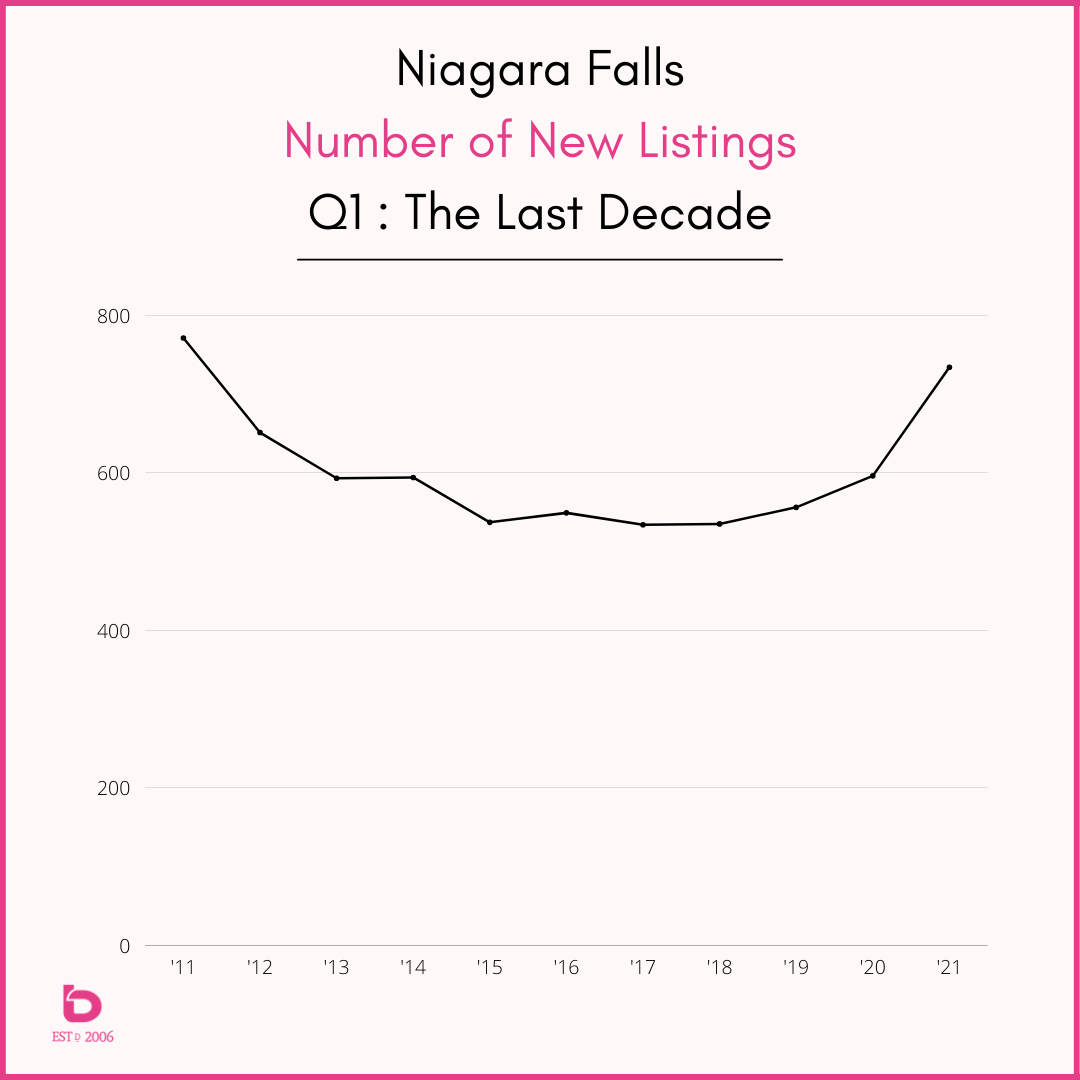
The same but for Niagara Falls:
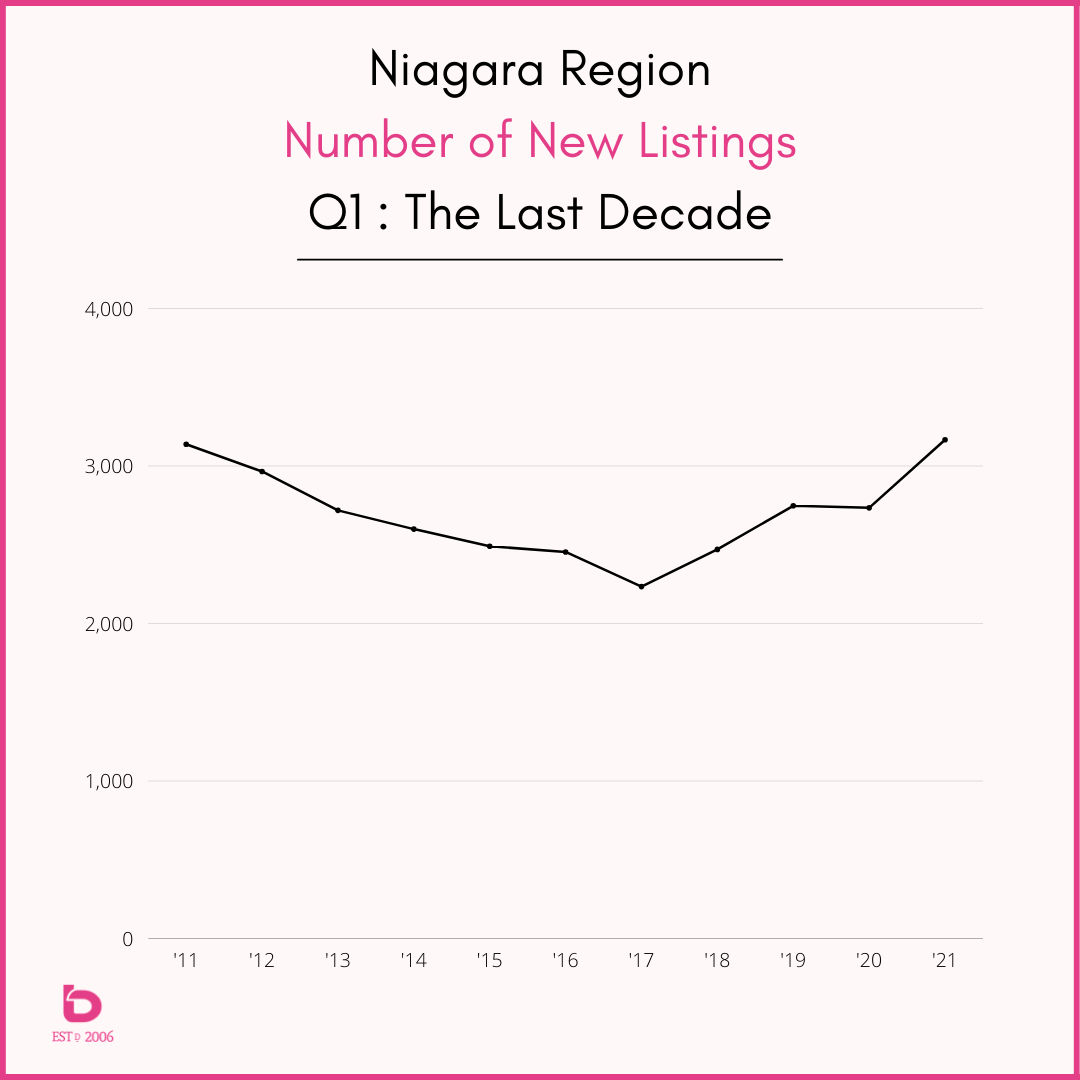
Q1 FACTS
The fact that the first quarter (Q1 = Jan + Feb + March) of 2021 was so historically strong only speaks further to how strong March was.
Some quick facts.
Q1 was the STRONGEST in modern times for new listings in Niagara as well as St.Catharines and Niagara Falls…and essentially, every municipality in Niagara.
Have a look at these graphs showing Q1 2021 in comparison to the previous decade:
Niagara Region
St.Catharines
Niagara Falls
Great. More new listings. But what about sales?
So, while March was strong, it’s important to know how weak supply in January and February was in comparison to the level of demand (Number of Sales). For example, when compared to the 10-year average:
| January | February | March | |
| Niagara Region | |||
| # of new listings | -15% | +14% | +50% |
| # of sales | +41% | +52% | +80% |
| St.Catharines | |||
| # of new listings | -24% | -11% | +32% |
| # of sales | +21% | +20% | +57% |
| Niagara Falls | |||
| # of new listings | -13% | +24% | +68% |
| # of sales | +53% | +69% | +70% |
So, while the new listing inventory has improved, you can clearly see how strong the number of sales have been. Long story short, there is still work to be done!
2. Demand
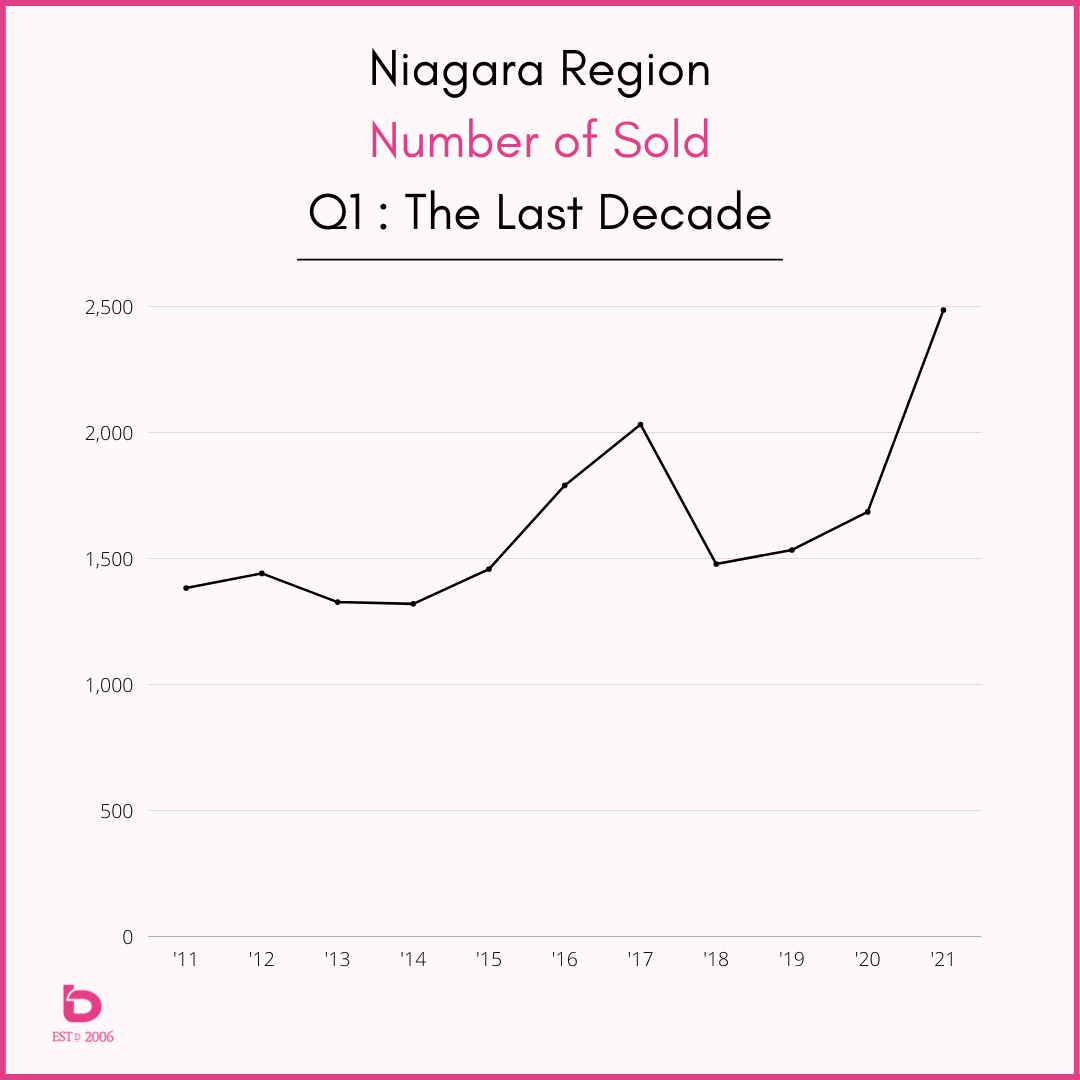
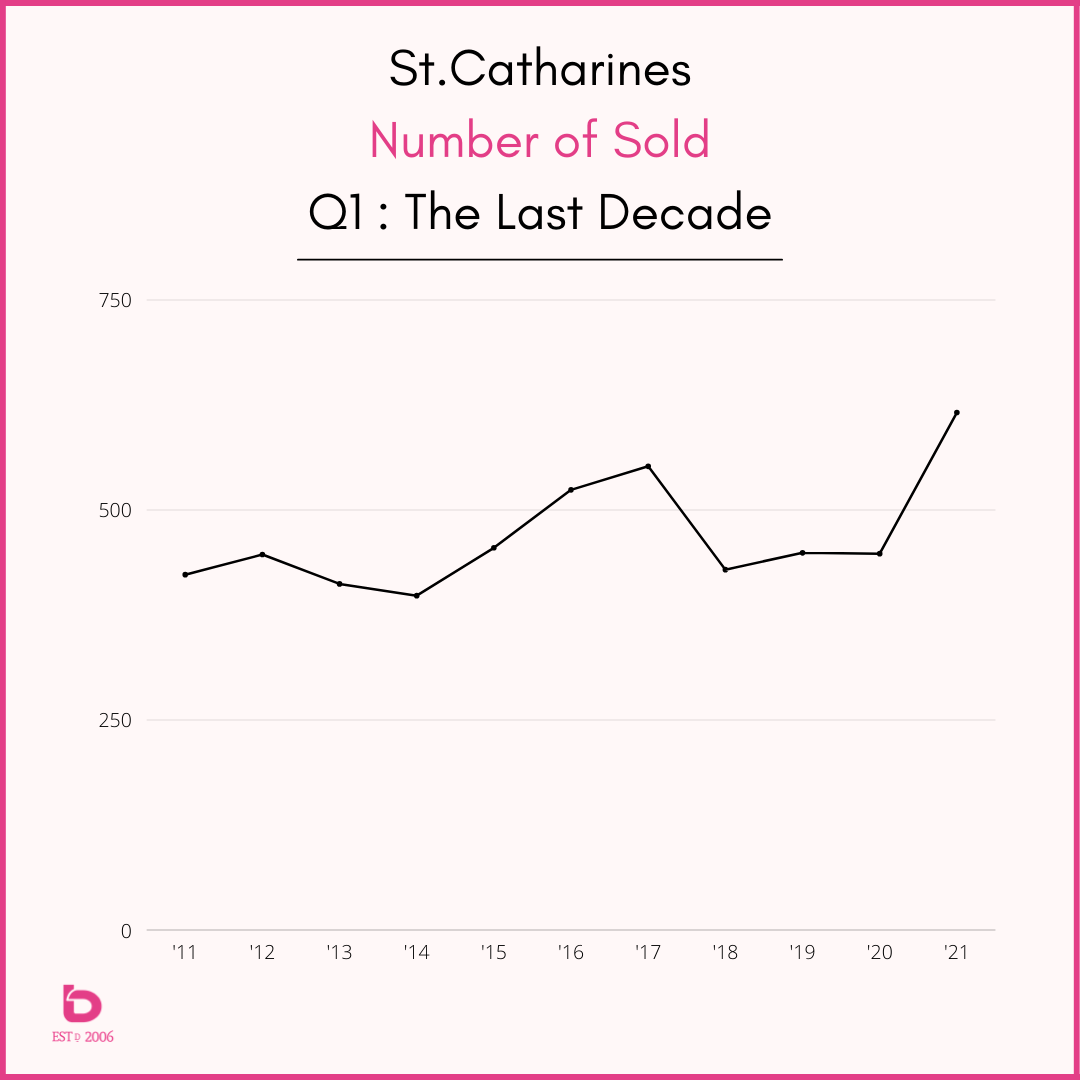
These graphs show you how huge Q1 2021 was in the number of sales for Niagara and St.Catharines. We tend to hone in on the the largest volume cities in Niagara but the same trends continue across the region.
Niagara Region Q1 Sales compared to previous 10 years:
St.Catharines Q1 Sales compared to previous 10 years:
3. Pricing
Pricing has been a bit of an enigma the last several months. You can have a house listed at $549,900 sell for $725,000 while another up the street listed at $624,900 sells for $685,000.
"How are we supposed to make sense of that?"
"Well, it’s tricky."
How’s that for clarity!?
Overall though, there is not doubt that pricing over the last 6 months has made massive gains which goes back to the elation/frustration scenario.
Some love it while others are finding themselves priced out of the market.
A quick look at 2021 year-to-date numbers for all municipalities in Niagara:
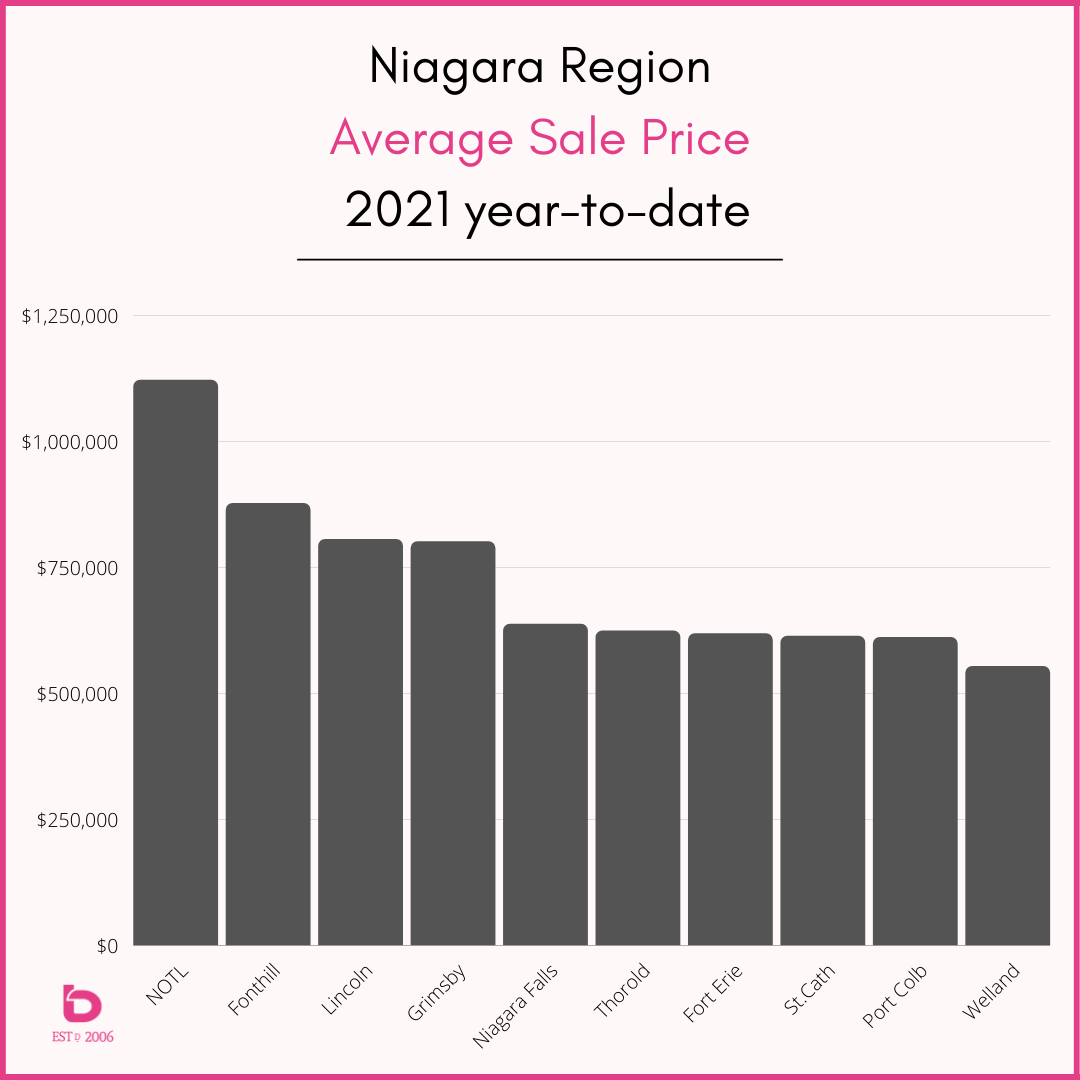
Those new price levels are in part, a direct correlation between the massive sales demand meeting head on with below average new listings.
That's a wrap!
So there is a quick look at where we are at currently. What we’re watching for now is to see if the strengthening we saw in March continues through April and into May. Should that happen, we’ll see a moderation of the intensity out there.
Stay tuned. We’ll be here keeping track of things.
Questions? Reach out anytime. We're happy to help. :)
Our latest YouTube video covers it from a few different angles as well. Have a watch here: