

A MARKET WITH AN IDENTITY CRISIS
“What exactly is going on out there!?”
After an unprecedented start to the year from January into March, the market took some serious twists and turns through April into May, resulting in one of the quickest and most profound shifts in our 20+ years in real estate.
The market went from being starved for listing inventory with buyers lining up around the corner to surging inventory as buyers packed up their tent and moved on or pulled back altogether.
So, as mentioned in our YouTube video (see below), let’s take a dig into the actual numbers.
THE NUMBER OF NEW LISTINGS
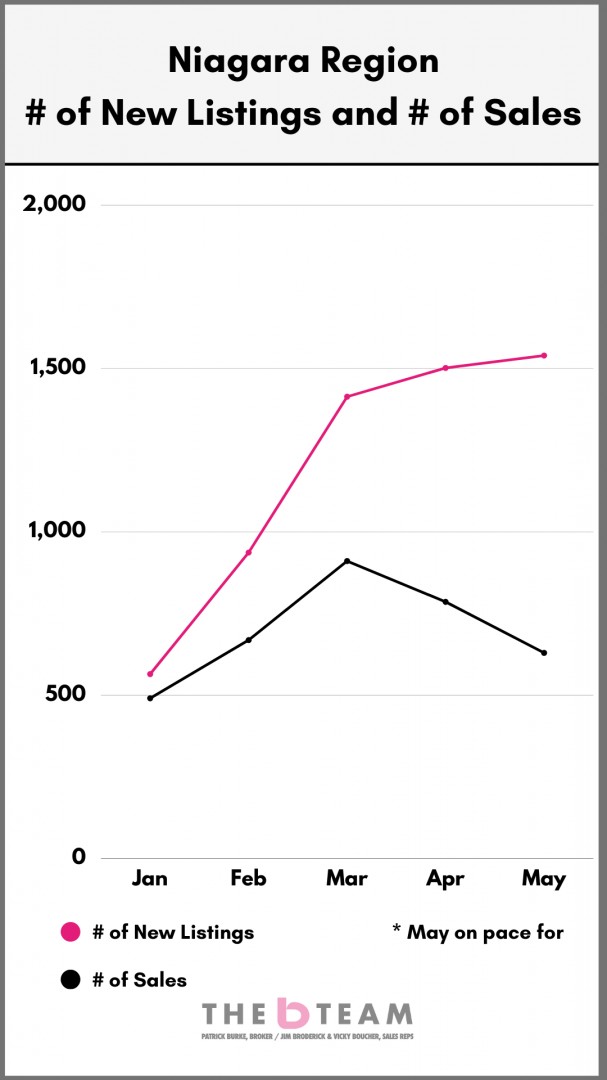
NIAGARA REGION new listing inventory (supply):
January: The lowest month in 15 yrs (at least) for the number of new listings. *that is excluding December which is a historically slow month of any year.
April: 2nd highest ALL-TIME for ANY month
…so, while new listings were up 6% from March to April, as mentioned, the number of homes sold took a step back. In fact, from March to April, sales were down by 14%.
That trend took hold and here in mid-May is looking like the inverse of February. Rather than low listings and intense demand, we’re seeing intense supply of new listings with tepid buyer demand.
Note: this isn’t across the region in every city and on every street. This is a big picture look at what is happening in the region. Keep reading for a bit of a closer look at specific cities.
THE RELATION BETWEEN SUPPLY & DEMAND
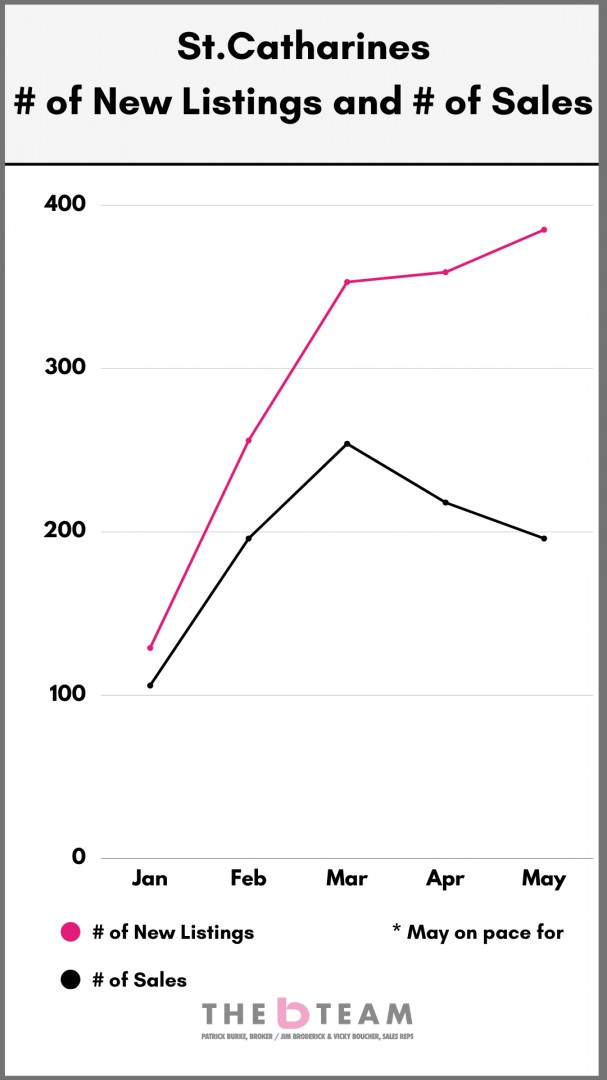
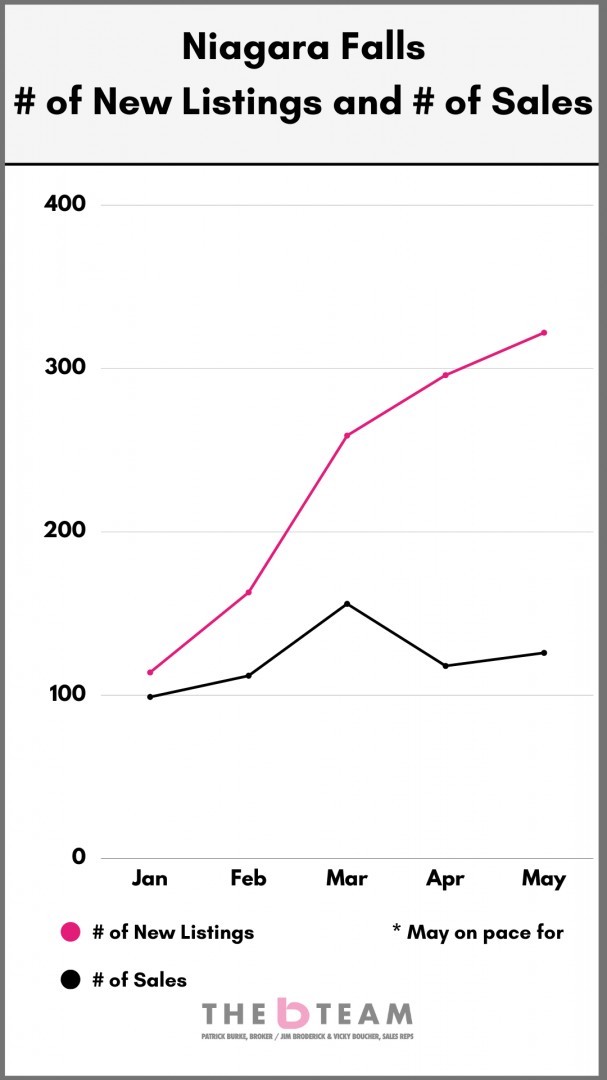
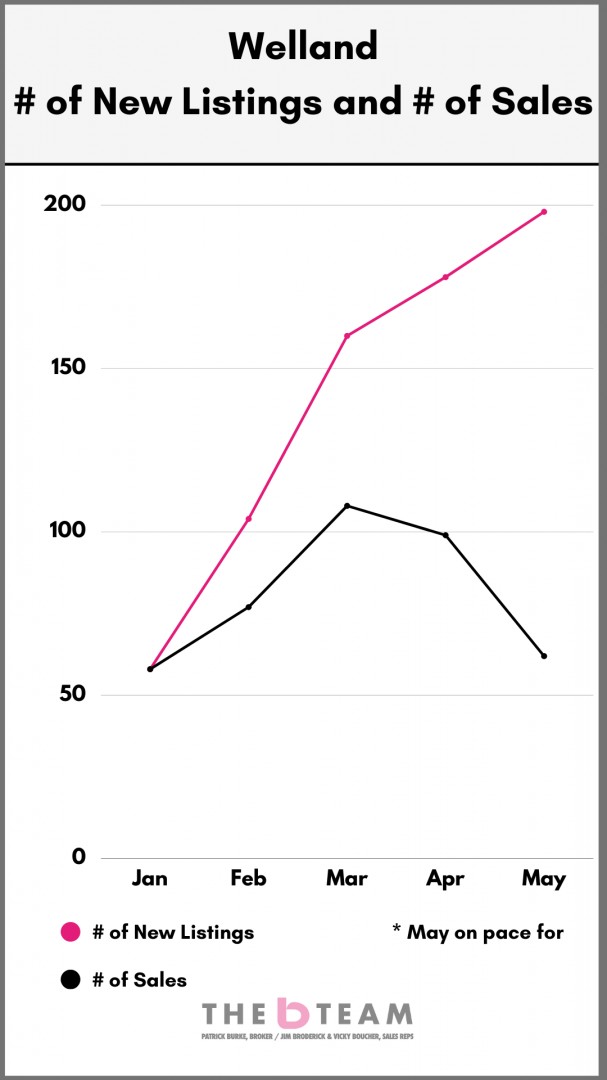
In these graphs, you’ll see the relationship between the number of new listings (black line) and the number of homes sold (pink line).
Notice how tight things were earlier in the year and then the shift as we got into April and May. That divergence over the last few months is what is driving overall sentiment these days.
Note: we only have the Niagara Region graph as well as St.Catharines, Niagara Falls & Welland because they are the 3 largest markets (for total # of sales) in the region. Smaller markets with 25-35 sales a month are harder to draw too much insight from on a monthly basis.
COMPARE JAN & FEB TO APR & MAY
Imagine you own a store. In terms of your inventory, how many items are left on the shelves at the end of the month? For example, if there are 150 new items put up for sale and 100 sales, then there are 50 items still on the market for buyers to buy. As days and weeks go on like that, there is always a healthy amount of choice for the buyer.
In general terms...
Jan + Feb was similar to 150 new listings and 142 sales with only 8 left over.
Arp + May are on pace to be closer to 150 new listings and 75 sales with 75 homes still on the shelves.
Whether you are a buyer or a seller, those 2 markets will produce 2 distinctly different experiences.
The real numbers…these numbers are the surplus number of new listings over sales:
NIAGARA REGION
Jan + Feb 342
Apr + May 1,626
ST.CATHARINES
Jan + Feb 83
Apr + May 330
NIAGARA FALLS
Jan + Feb 66
Apr + May 374
WELLAND
Jan + Feb 20
Apr + May 215
NUMBER OF SALES?
Here is how May 2022 compared to the last 15 years (previous months of May):
Niagara Region Lowest number of sales on record.
St.Cath Lowest number of sales since 2012.
N Falls Lowest number of sales on record.
Welland Lowest number of sales on record.
* excluding May 2020 which was still frozen due to the arrival of COVID.
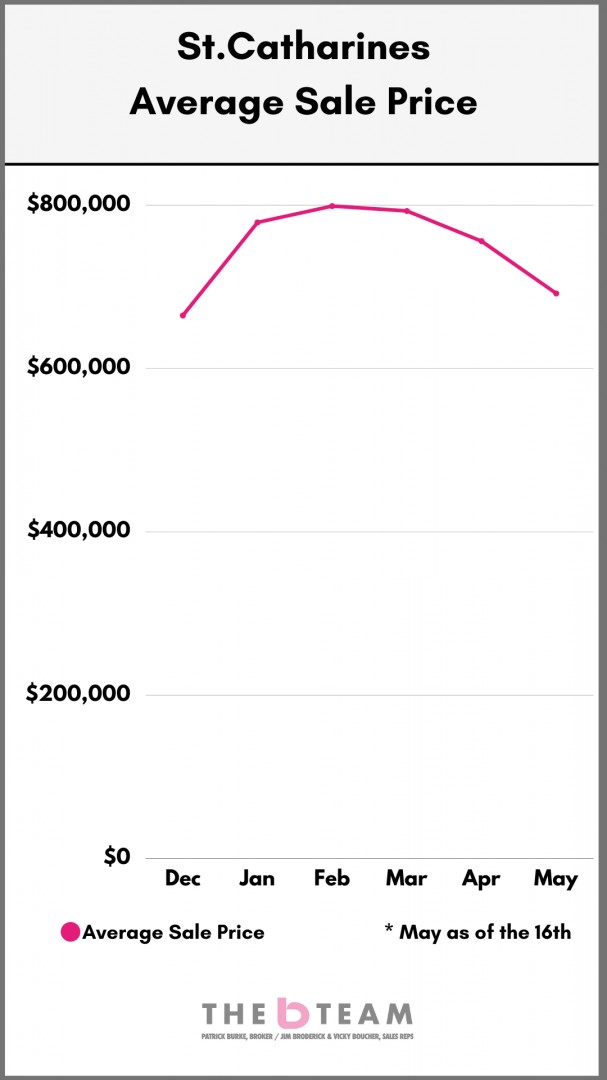
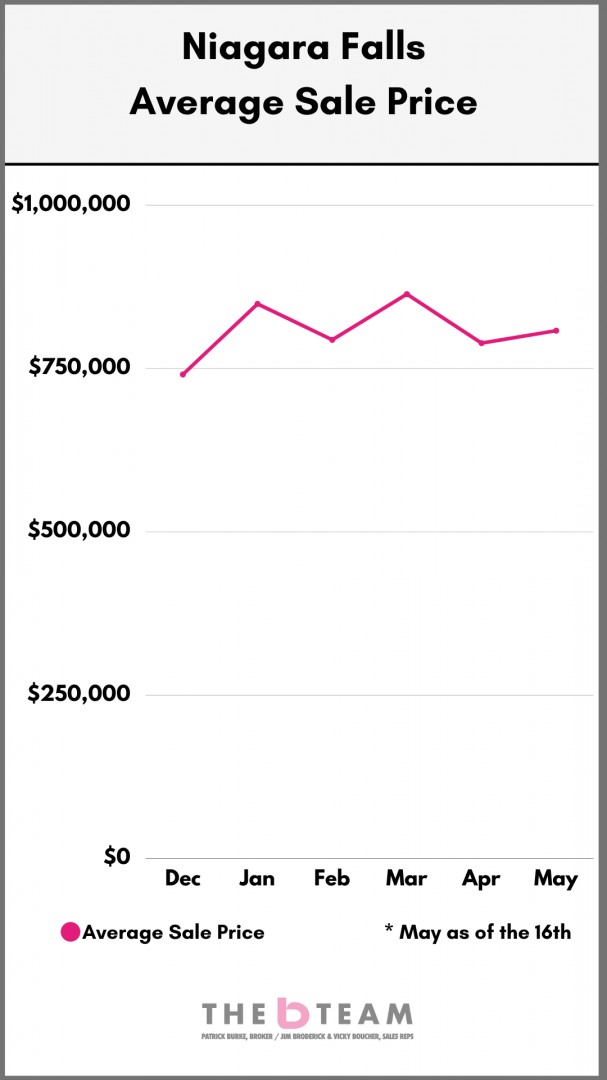
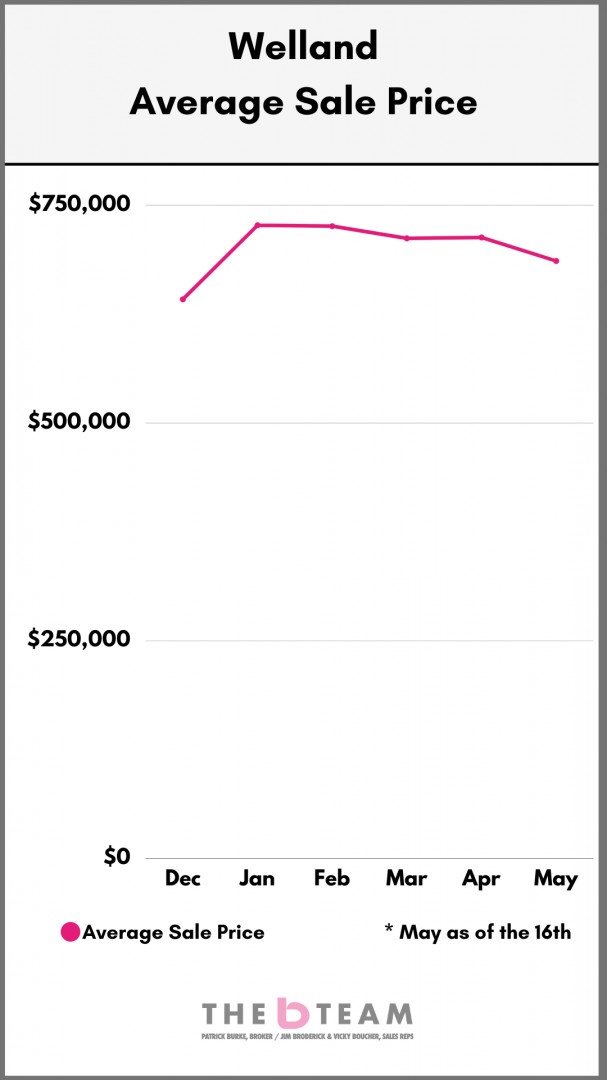
WHAT DOES THIS MEAN FOR PRICES?
These graphs show you the previous 6 months including December 2021. We included that month for one main reason. The leap in prices from December 2021 to January 2022 was nearly unprecedented.
For example, in St.Catharines, average sale prices jumped by 17%. That is the single biggest monthly jump that we could find, at least in the last 20 years.
NIAGARA REGION
2022 year-to-date is $857,000, an increase of 21% over 2021 annual.

ST.CATHARINES
2022 year-to-date is $772,000, an increase of 20% over 2021 annual
NIAGARA FALLS
2022 year-to-date is $824,000, an increase of 24% over 2021 annual
WELLAND
2022 year-to-date is $716,000, an increase of 21% over 2021 annual
We tend to focus on those 3 cities since they have considerable volume which helps mitigate the impact that a few outlier sales can have.
That being said, here is a quick look at the rest of Niagara:
| City | % Increase YTD v 2021 |
Avg Sale Price YTD in 2022 |
|
Fort Erie |
19% | $794,000 |
|
Grimsby |
22% | $1,051,000 |
| Thorold | 28% |
$835,000 |
|
NOTL |
15% | $1,307,000 |
|
Port Colborne |
17% | $760,000 |
|
Lincoln |
22% | $1,021,000 |
|
Fonthill |
17% | $1,078,000 |
WHERE DO WE GO FROM HERE?
The driver behind any marketplace is how many things are for sale (or available) and how many people want to buy them.
In this case, we are seeing growing new listing inventory (more things) while less people are in the marketplace looking to buy (less demand).
So, where we go from here is going to be driven by how that relationship carries into the summer months.
The Niagara Region in May 2022 is on pace to set record highs for new listings and record lows for the number of homes sold. The municipalities aren’t much different.
BUT….it’s only one month. The jury is still out. Is this the market re-calibrating?
3 THINGS TO WATCH
1. Buyer Sentiment. How will rate hikes impact the confidence of the buyers out there. Will they pull back out of caution? Will they wait and try to “time the market?”
2. Seller Sentiment. Will sellers try to rush the market out of concern that they’ll miss a boat? Will we see a rush of inventory, or will sellers decide now isn’t the time, resulting in the boat levelling off in calmer waters?
3. Days on Market. Sellers see growing days on market and experience instant anxiety. Realtors often do as well. Meanwhile, buyers may see a home on the market for 28 days and smell blood. Afterall, the last while has conditioned us to believe that 8 or 11 days on market is normal, when in the past, normal is more in the 40 - 60 days range.
Rest assured, we will stay on top of things and keep you updated. If you have any questions at all, please do not hesitate to contact us.
Thank-you for visiting.
WANT TO DISCUSS FURTHER? CONTACT US HERE.