

Has the Niagara market peaked?
That is the $861,772 question.
And in a related matter, the average sale price so far in 2022 (as of March 30th) is sitting at $861,772.
A few quick facts.
1. Million Dollar Sales
In the last 3 - 5 years, the market share of homes selling for over $1 million has grown from 1% of the market to over 20% (of all sales).
2020: million+ sales accounted for 4.9% of all sales.
2022 YTD: that number has jumped to 22.9% of all sales.
So yes, they’re not exactly abnormal anymore.
2. Not Just Niagara-on-the-Lake
In 2021, Niagara-on-the-Lake was the first (and only) city to have an annual average sale price over $1 million. That was just last year when NOTL averaged $1,141,000.
Here in 2022, 5 of 11 municipalities are sitting over a million.
NOTL
Grimsby
Lincoln
Fonthill
West Lincoln
3. Change in Price Brackets
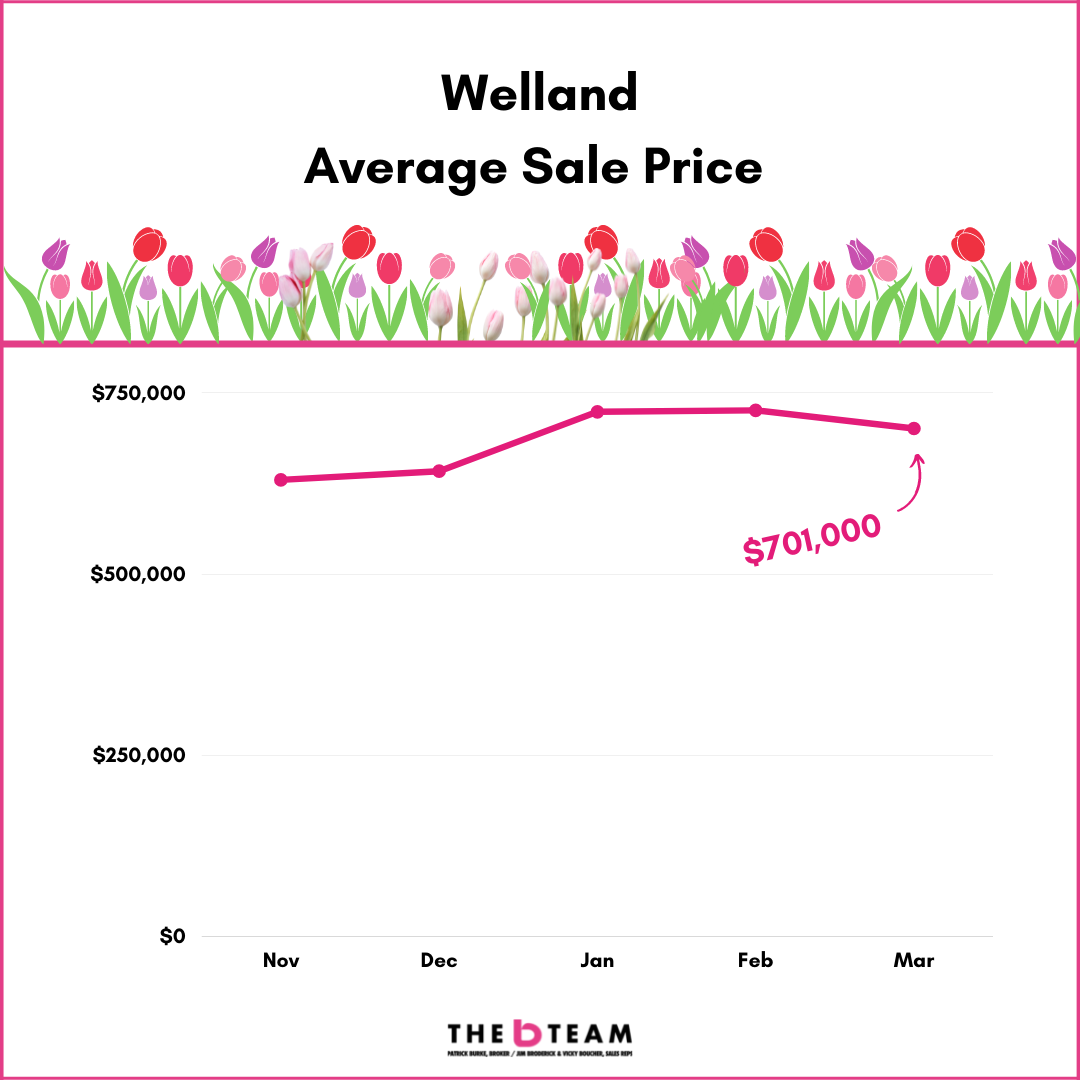
2021: there was only 1 city with an average sale price under $600,000 and that was Welland ($590,000).
2022: Welland is still in last place but is now sitting at $718,000 year-to-date.
All cities have bumped up at least $150,000 from 2021 to 2022.
4. Price Leagues
Year-to-date in 2022: there are 4 cities averaging in the $700s, 2 in the $800s and 5 in the $1 million & up bracket.
2021: we had 5 cities in the $600s, 2 in the $800s, 2 in the $900s and 1 over a million.
2018: we had 6 cities in the $300s, 4 in the $500s and 1 at $750,000 (NOTL).
To confirm, all cities have seen enormous price growth whether compared to 2021 or 2018.
...and yes, the lowest price city (Welland) in 2022 is alllllmost the same as the most expensive city (NOTL) in 2018.
5. Average Sale Price %
For Niagara...
2022 YTD:
average asking price $788,000
average sale price $862,000
average of 109.3% of asking price
2018:
average asking price $417,000
average sale price $408,000
average of 97.8% of asking
And 95-98% of asking is where our market was (in general) year in and year out prior to these recent market explosions that we’ve seen.
THE MARKET TRENDS ARE UNDENIABLE
While some price escalations happen over the course of several months or a year, what was saw from December 2021 to January 2022 was unique. In some cases, it was the largest monthly price growth (based on percentage) on record.
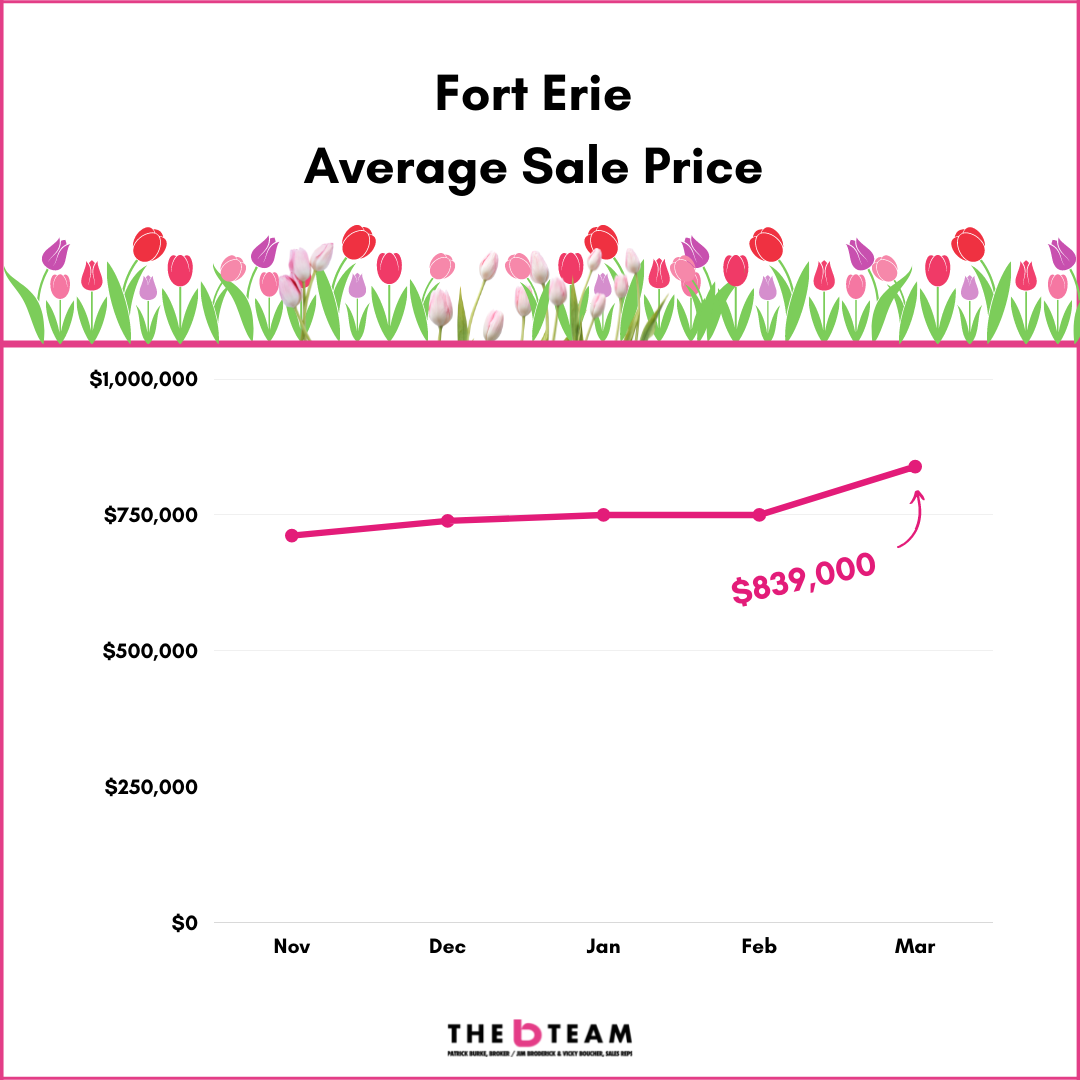
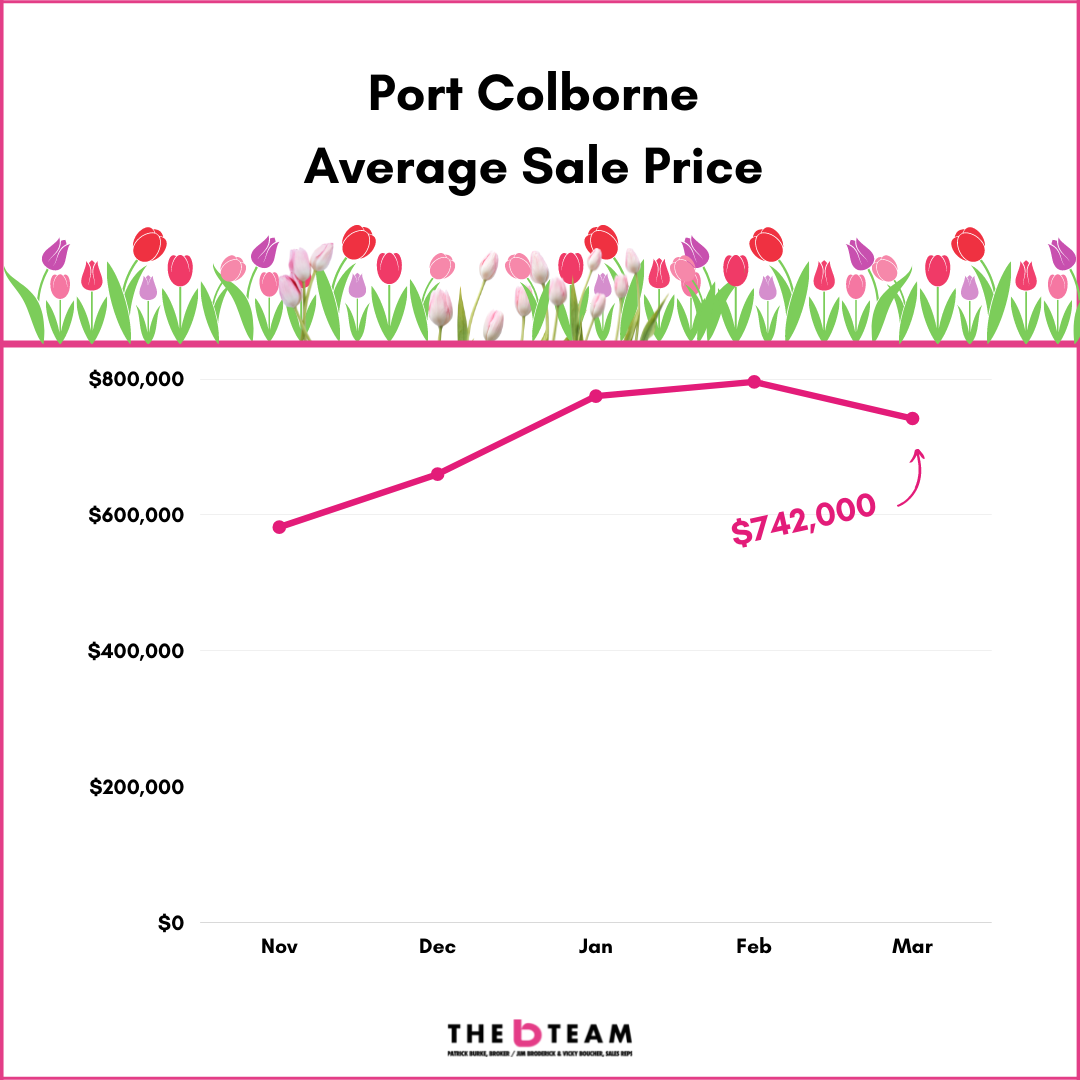
The graphs below illustrate it well. They show you the month average sale prices going back 5 months to November 2021. This way you can see the bump into January and the relative levelling off since then.
Word of Caution. The smaller market cities (lower # of homes sold) will produce volatile prices. So, a city with only 20 sales in a month can show sale prices up or down by 20 or 30 (or more) percent. If you see a massive spike in either direction, it’s worth a closer look.
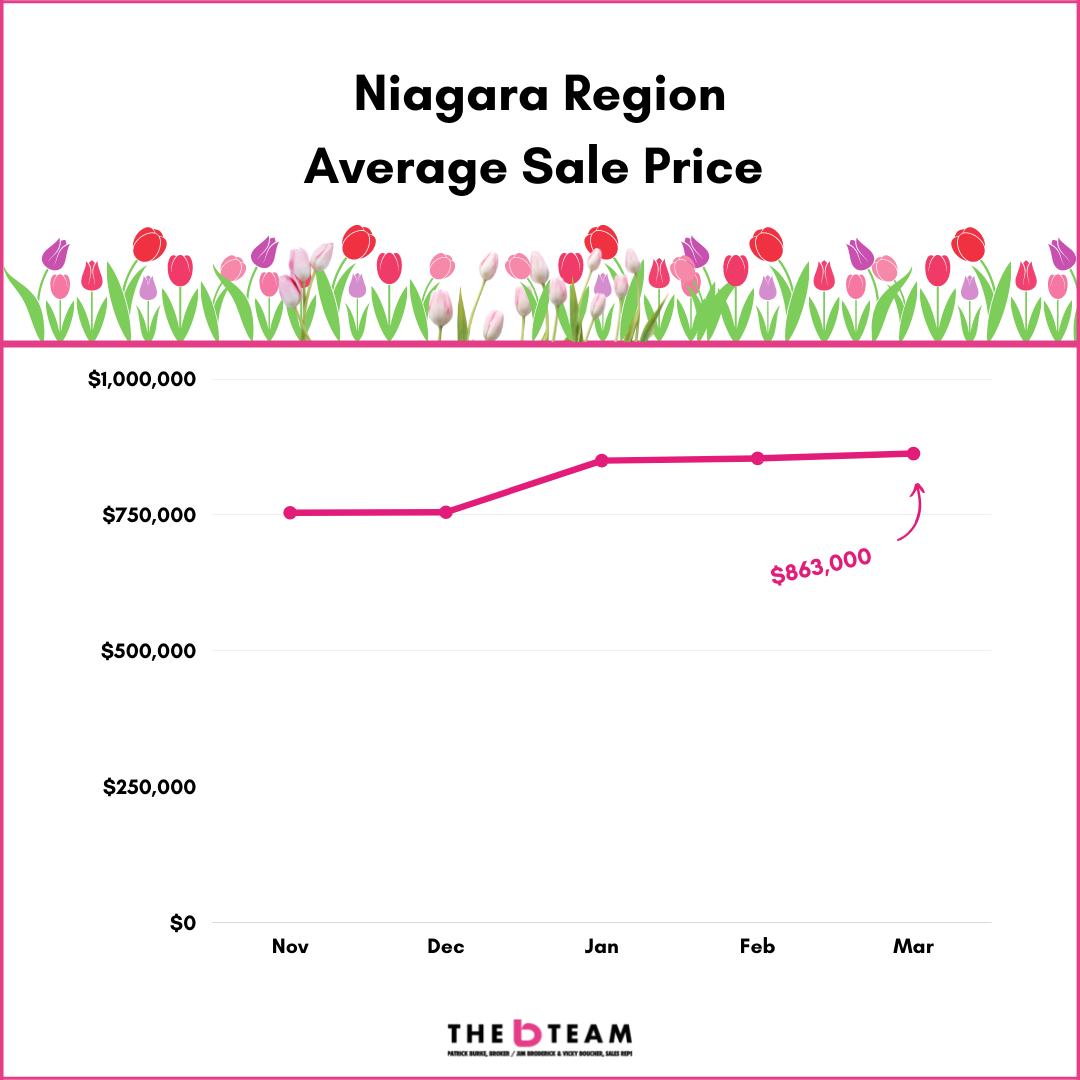
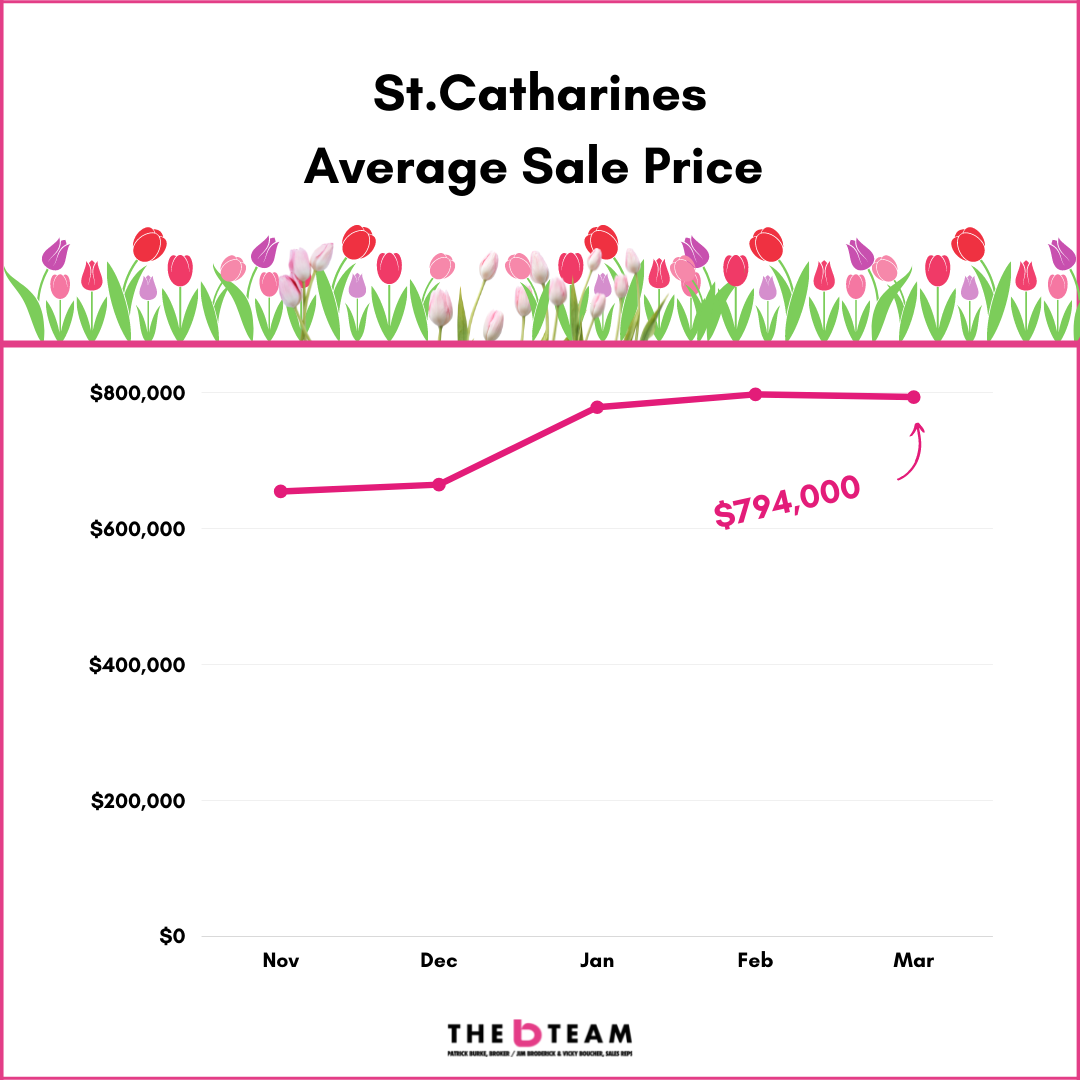
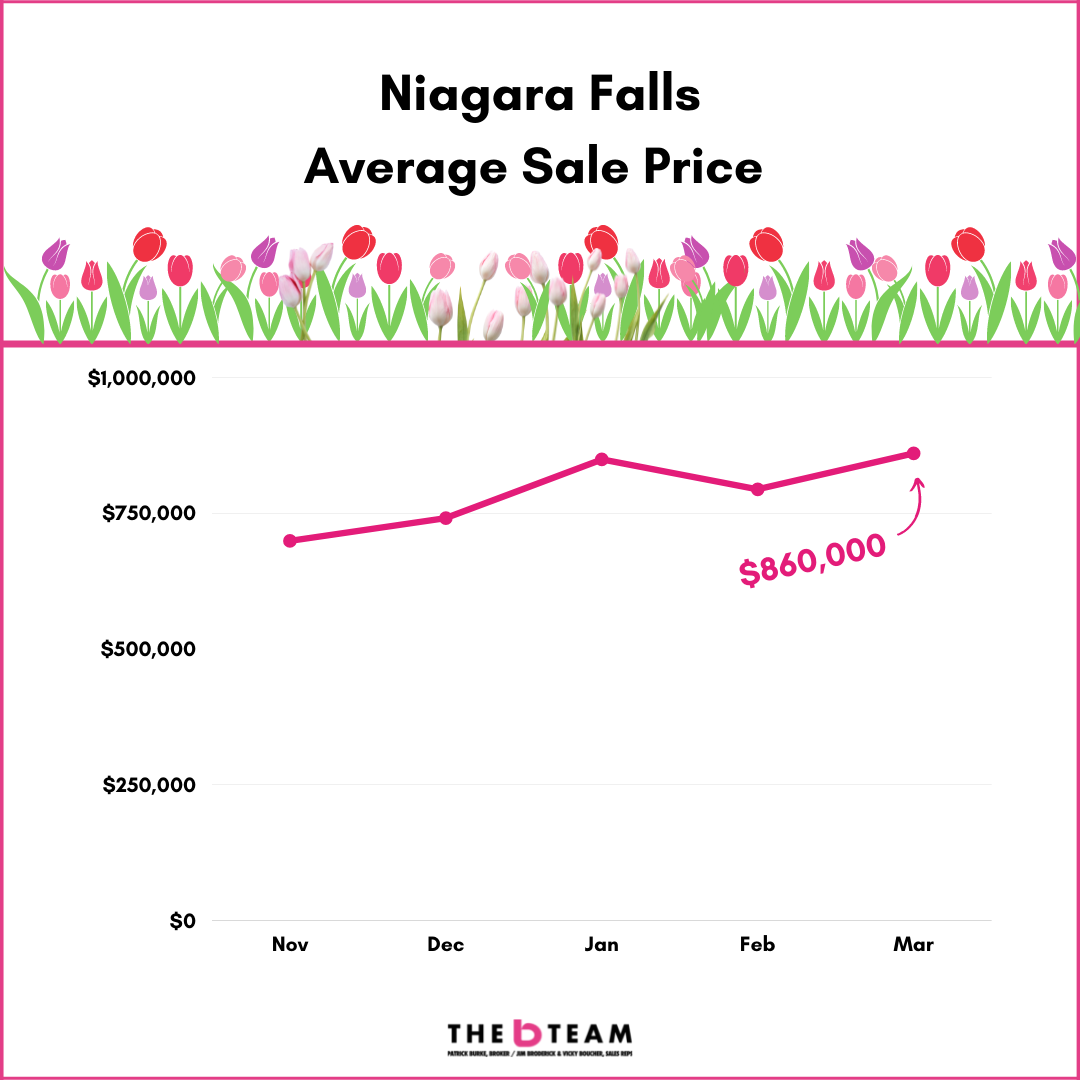
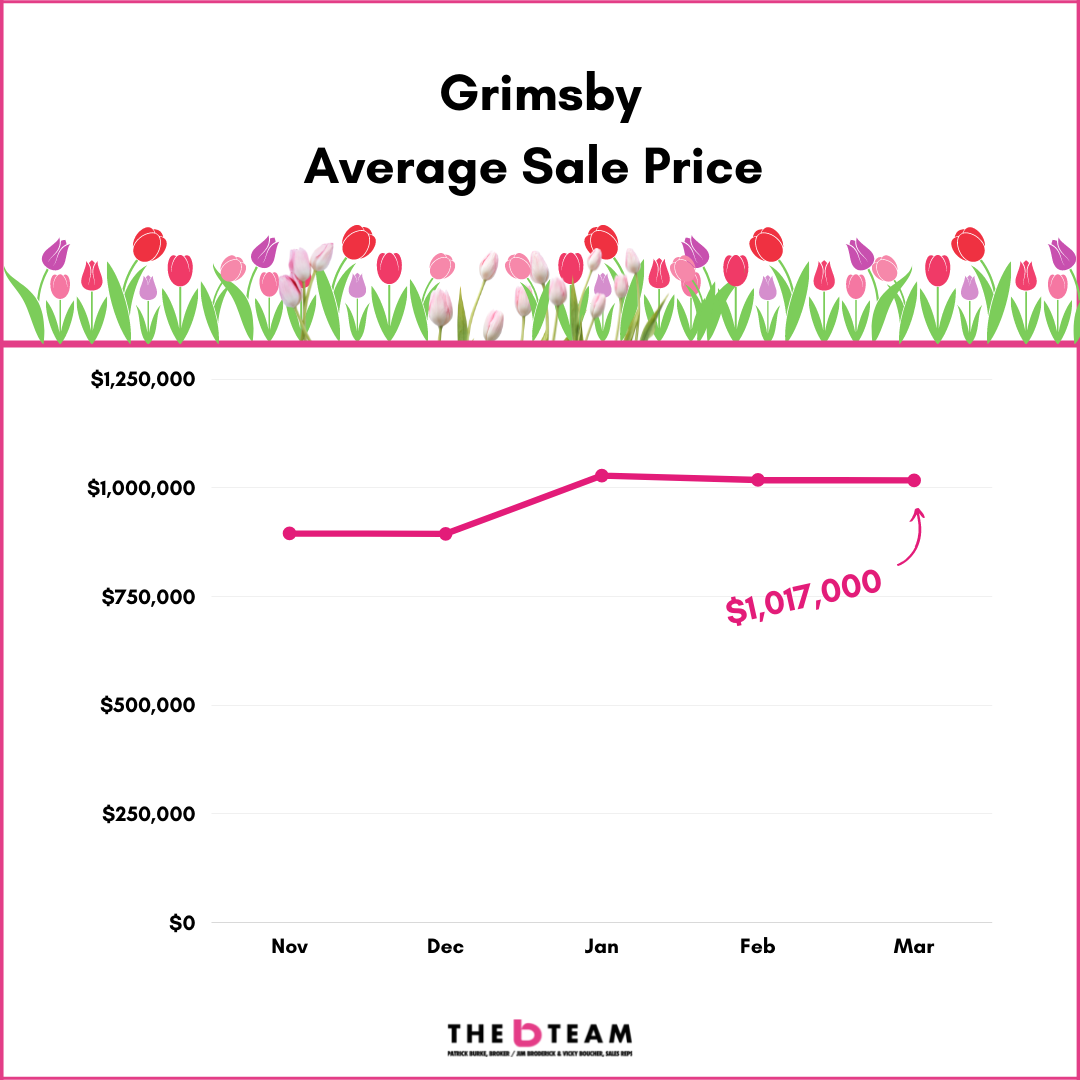
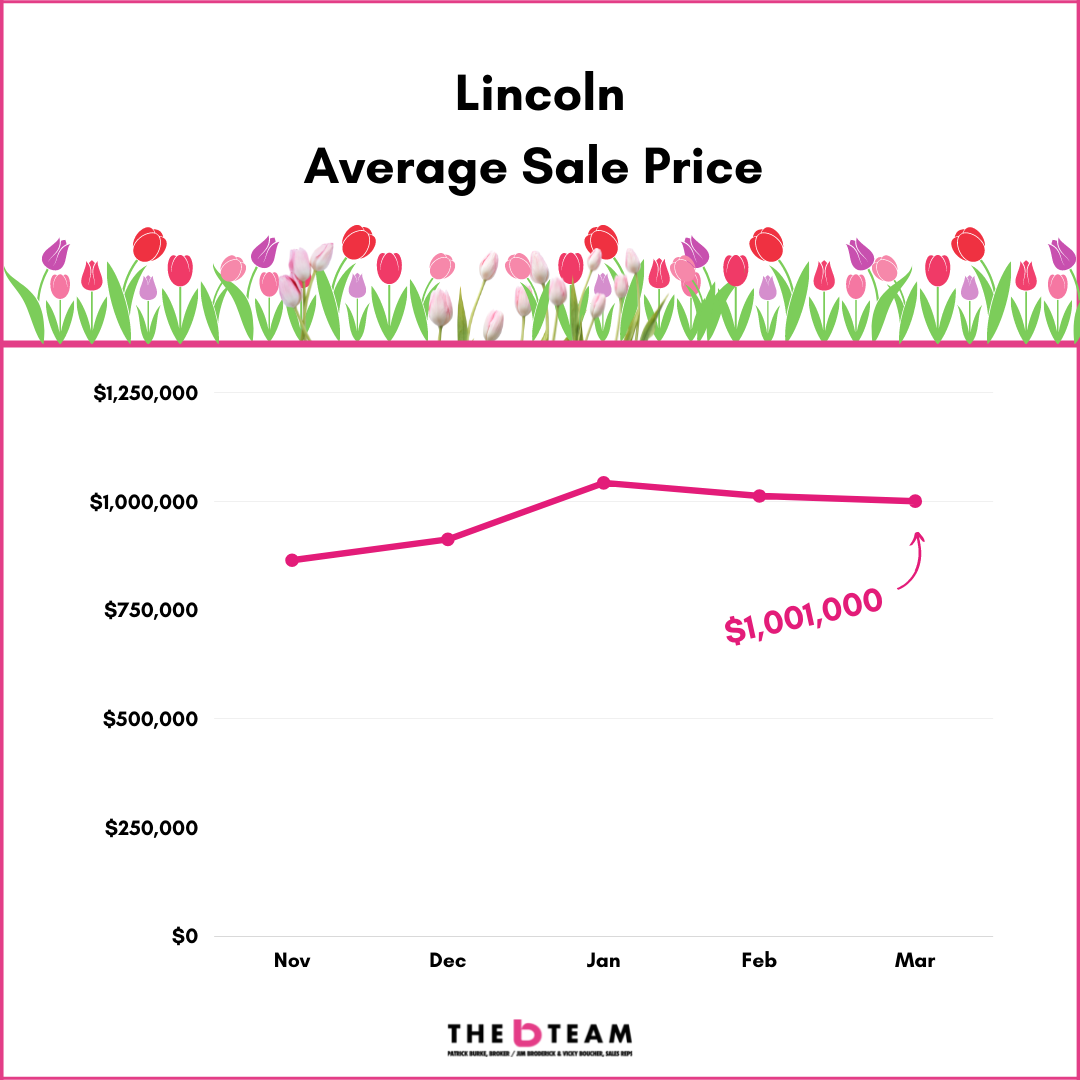
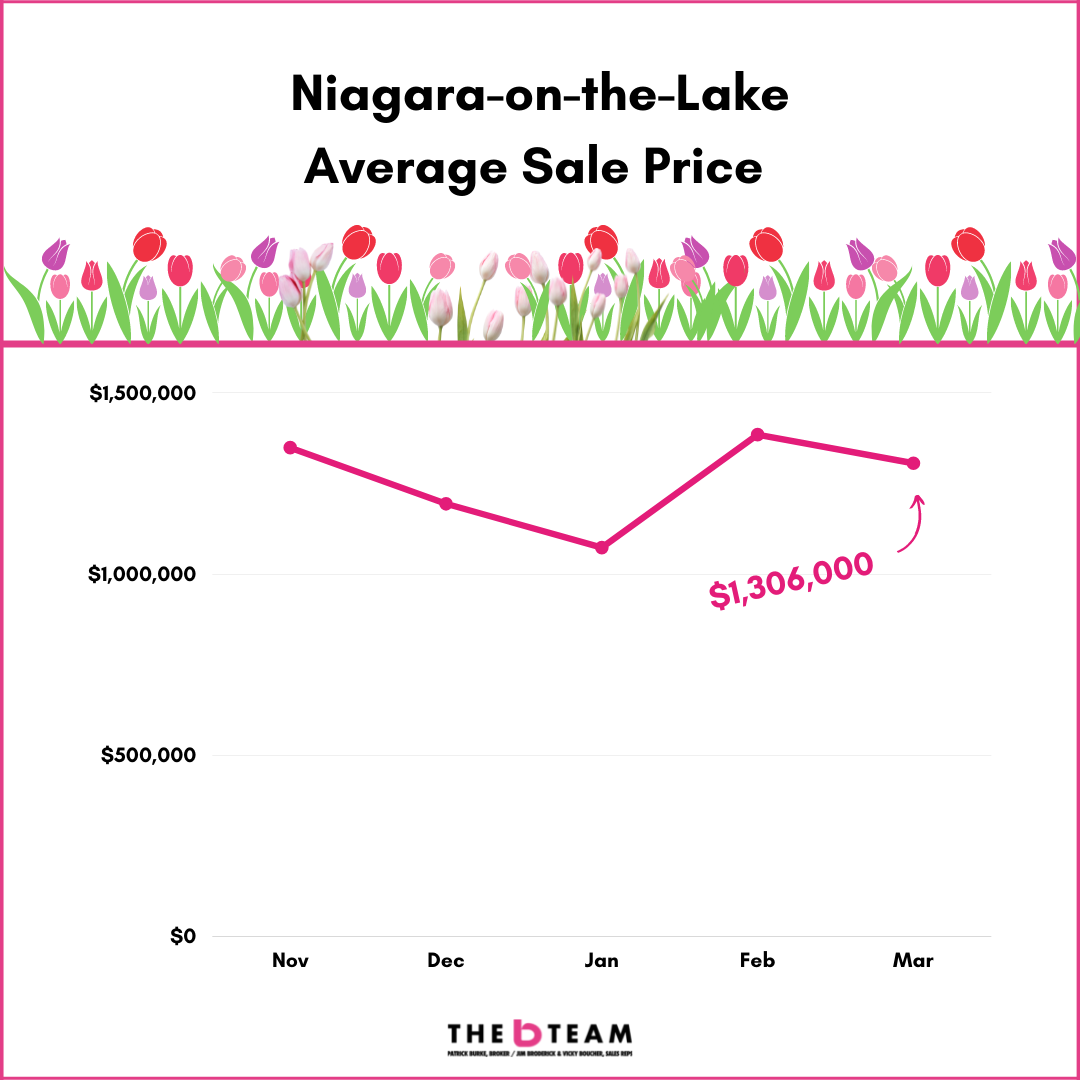
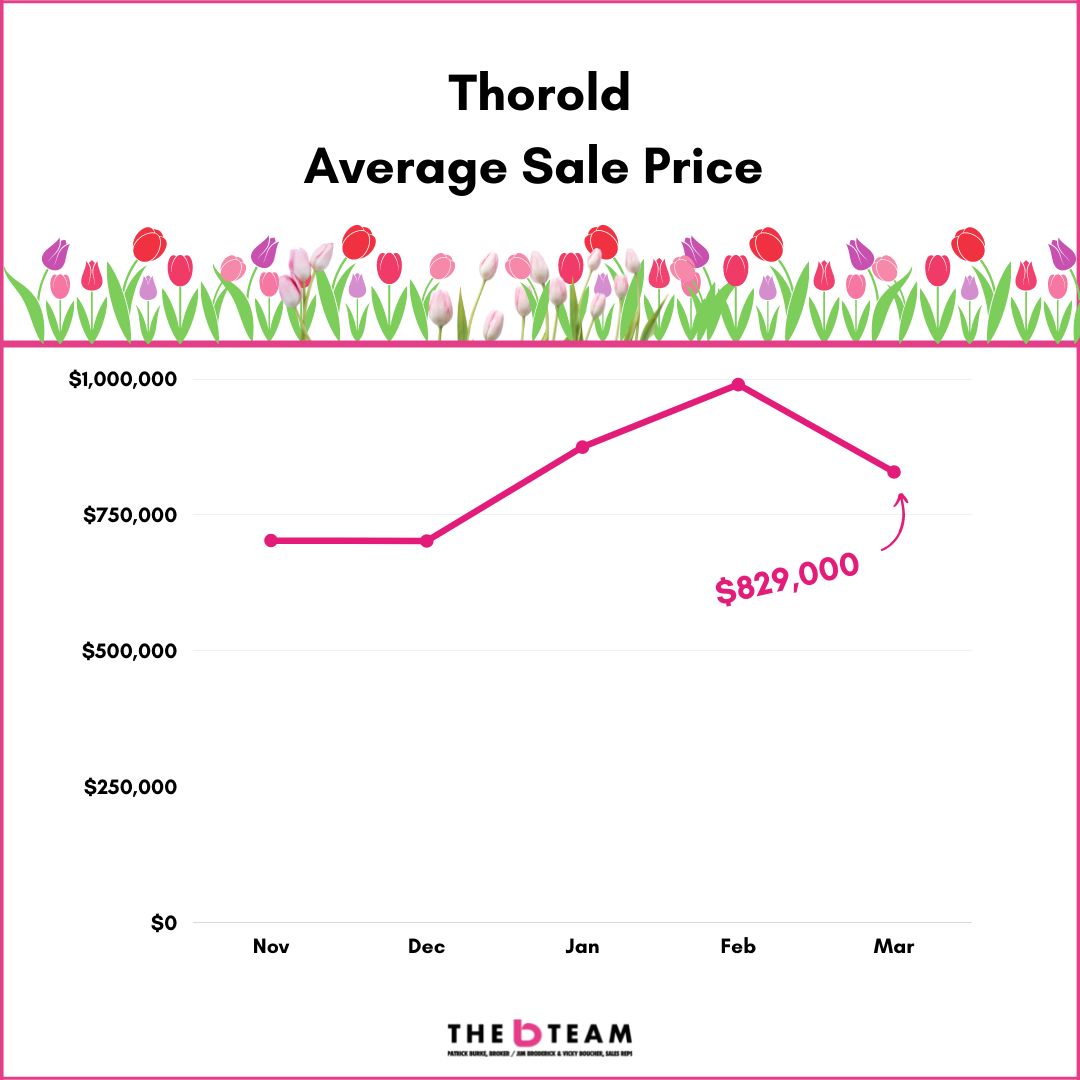
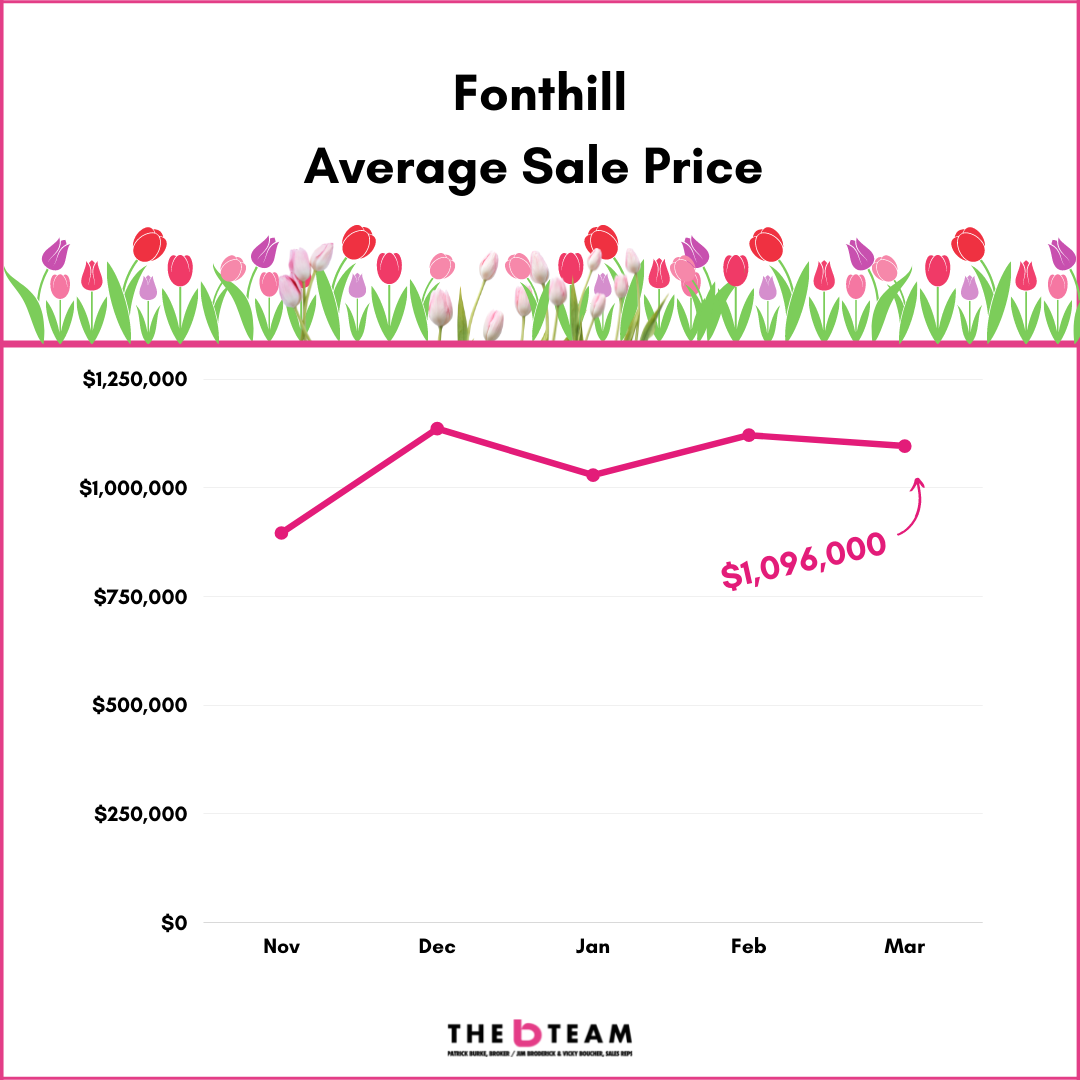
You can see, aside from a few oddballs (NOTL and Fonthill), the average sale price jump from December to January was what could be described as statistically notable. Or eyebrow raising!
What is also notable is that those sale prices have largely levelled off since January, in general, bouncing around 2% in either direction. And as mentioned, the small market, are doing what they do which is producing monthly sale price graphs that look more like an EKG report.
SO. HAS THE MARKET PEAKED?
It may have, and here is why.
Reason #1
A market can only handle so much price escalation before a wheel falls off. A lot of the real estate big thinkers have called for a 10 - 15% increase for this entire year. Here we are year-to-date and nearly all of Niagara has already surpassed that.
A quick look:
| City |
% Increase (2022 YTD over 2021) |
| Niagara Region |
22% |
| St.Catharines |
23% |
| Niagara Falls |
25% |
| Welland |
22% |
| NOTL |
11% |
| Grimsby |
18% |
| Lincoln |
20% |
| Thorold |
36% |
| Fonthill |
19% |
| Fort Erie |
17% |
| Port Colborne |
20% |
Reason #2
Supply of new listings. A common refrain (and complaint) over the last 6 - 10 months was there was not enough inventory. We had more buyers than homes for sale, largely fuelled by out-of-market investors who consumed inventory and didn’t replenish the stock like a normal buyer/seller.
March 2022 is the 2nd month of a pretty remarkable comeback in inventory.
It’s important to know that for much of Niagara, March 2021 was an epic, monster of a month. It set and holds the record for ANY month for # of homes listed and # of homes sold for the region. So, the fact that March 2022 will finish in 2nd place behind March 2021 is a very respectable effort.
And if there’s one thing that levels off pricing, it is choice. When a buyer can now choose between 12 houses rather than fight over a few, then all of a sudden the crazy, outlier sales start to happen less as buyers exercise caution.
Reason #3
All markets change. It’s a normal part of the process so while prices have been escalating, it is reasonable to expect that a change will start to ease in.
Perhaps not across the entire market or in every neighbourhood, but it is no secret that some neighbourhoods or areas have been punching above their weight class. So yes, we do expect to see the market start to segment somewhat with the blue-chip areas still performing well while other areas may struggle to maintain their new found pricing glory.
Want to watch the video version? Have you SUBSCRIBED to our YouTube channel? Check it out here:
There you have it. A reasonable dive into Niagara real estate pricing. It is clear that sale prices are a moving target so rest assured, we'll be keeping track of things here.
Stay tuned and keep in touch. And please do not hesitate to reach out with any questions that you may have.