

Everything You Need To Know About Home Prices in Niagara
When trying to make sense of the current real estate market, Niagara has some problems, and it all comes down to the unique, unicorn-riding-a-roller-coaster market of 2022.
Let’s look at the big issue.
Sale prices.
In the “old days” of pre-2016, the market was stable and fairly boring with no sudden movements in any direction. Predictable. Boring, but predictable.
This graph shows the monthly average sale price for 2012 through 2014:
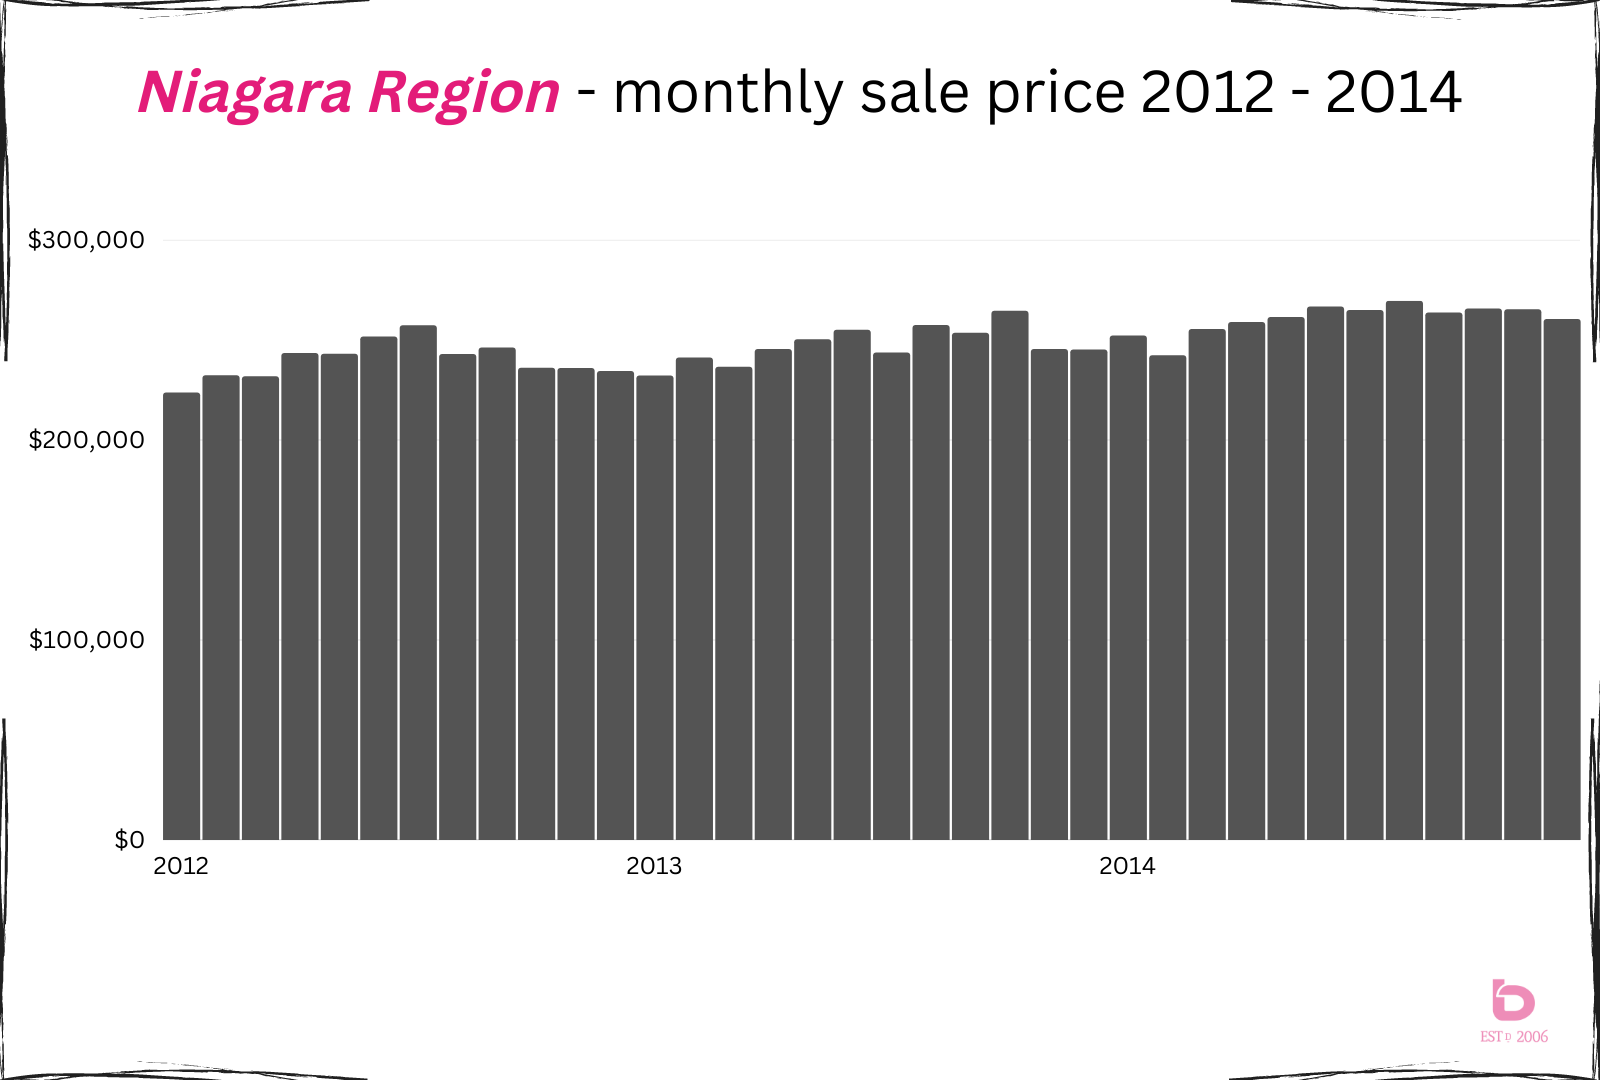
Notice no real sustained, major movements in any direction.
And as we all now know, 2022 was the opposite of predictable and boring and stable. The result is going to result in some of the most confusing and wonky market data that we’ve ever seen.
Year-over-Year is the most common way that we look at historical sale prices. How much a specific year was up or down in relation to another year.
For example:
Year Average Sale Price % Change from Previous Year
2012 $240,919 + 3.2%
2013 $248,410 + 3.1%
2014 $261,385 + 5.2%
Those gains were modest gains that were relatively connected to what was happening in the greater economy.
Fast forward and the jumps became leaps:
2015 $282,917 + 8.2%
2016 $332,541 + 17.5%
2017 $406,204 + 22.1%
Then a quick cool-down after the government changed a few rules in 2017:
2018 $418,841 + 3.1%
2019 $458,476 + 9.5%
Then the doors suddenly got kicked in as COVID entered the room and flipped our world upside down. While we were all lined up to get into the grocery stores, the real estate market did this:
2020 $555,161 + 21.1%
2021 $709,234 + 27.7%
Or in other words, from 2019 to 2021, the market was up 55%. A decade earlier, a 2-year increase would have totalled in the 5 – 7% range.
Here is where things get tricky to understand. That 2012 - 2014 graph (above) shows how relatively calm and gentle the price gains were in the more "typical Niagara" markets. That is what makes 2022 so special.
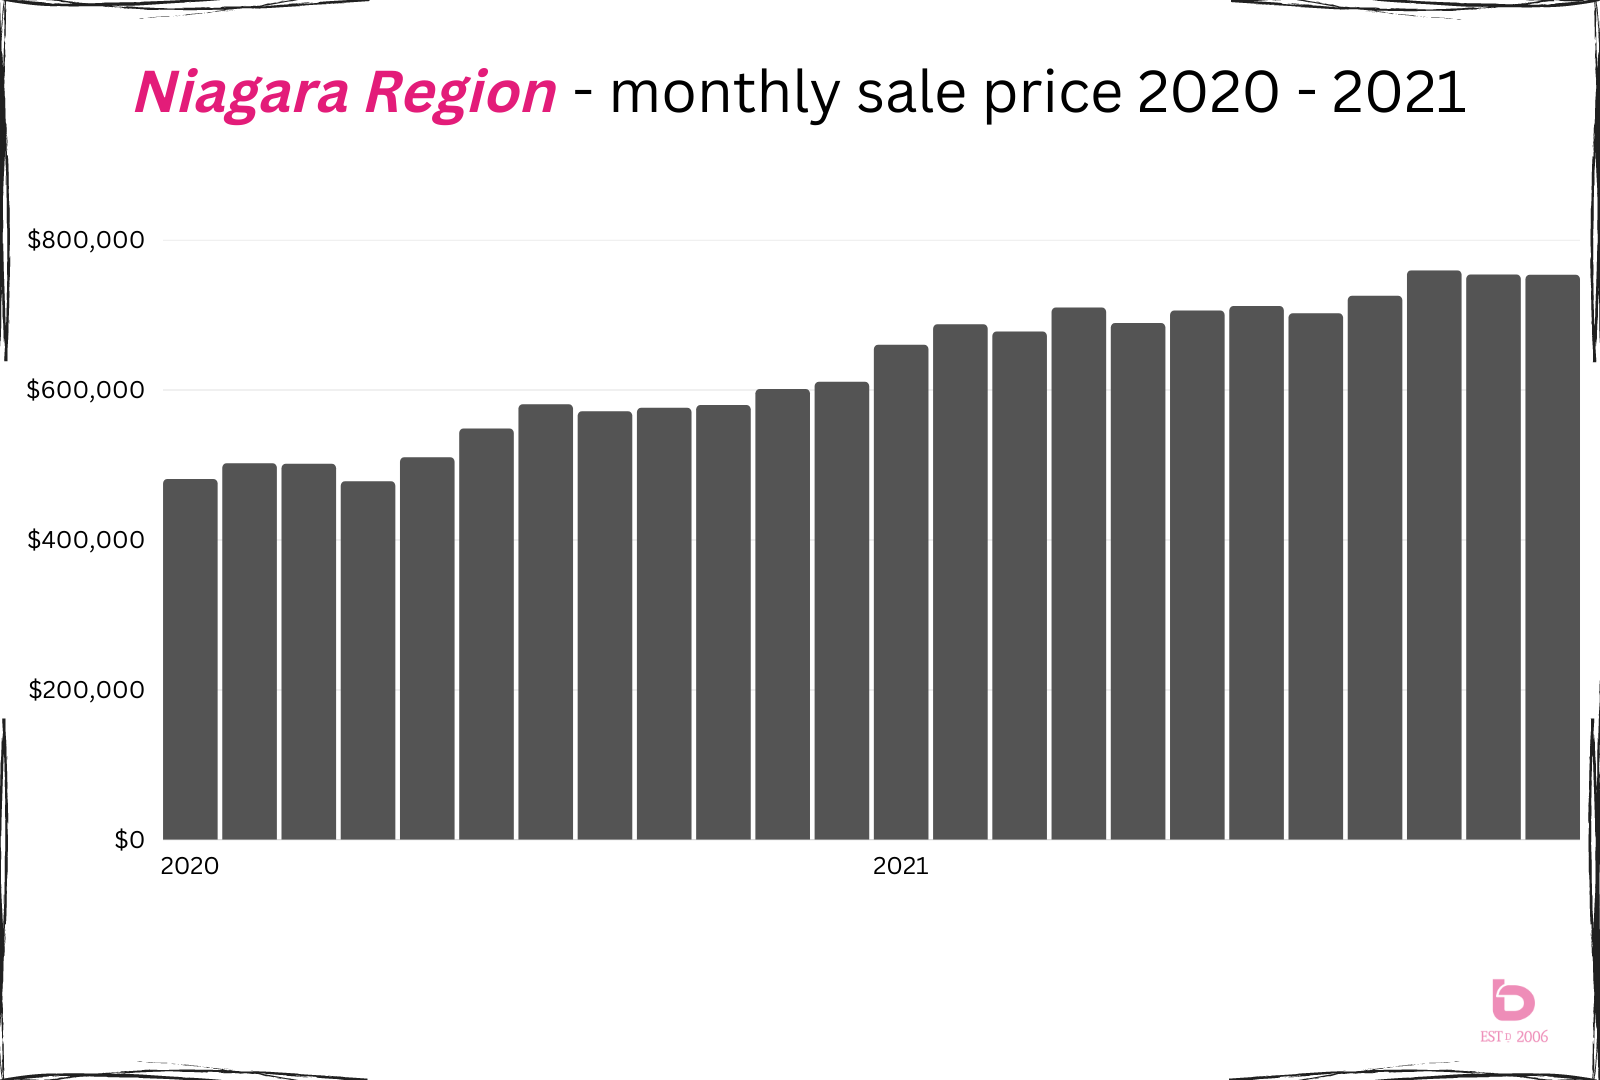
Case in point, here is a graph showing price appreciation for 2020 – 2021. Note, the small pull back in April 2020 when COVID stopped the market: Then a steady march with historic gains, including the record holding, gold medal 2021.
This brings us to 2022 and the problem....
2022 produced the most volatile market data that we’ve ever seen, at least in the last 30 years.
Some of the records:
Biggest 1 month price gain + 13.2% from December 2021 to January 2022
Biggest 1 month price drop - 13.3% from May 2022 to June 2022
Lowest Sales for the Month 7 months in a row (June through December)
Lowest Days on Market for the Month 12 days in March 2022
When looking at year over year numbers, market volatility produces a distorted reality. The situation worsens when people will read or hear or watch that distorted reality and then make decisions based on it.
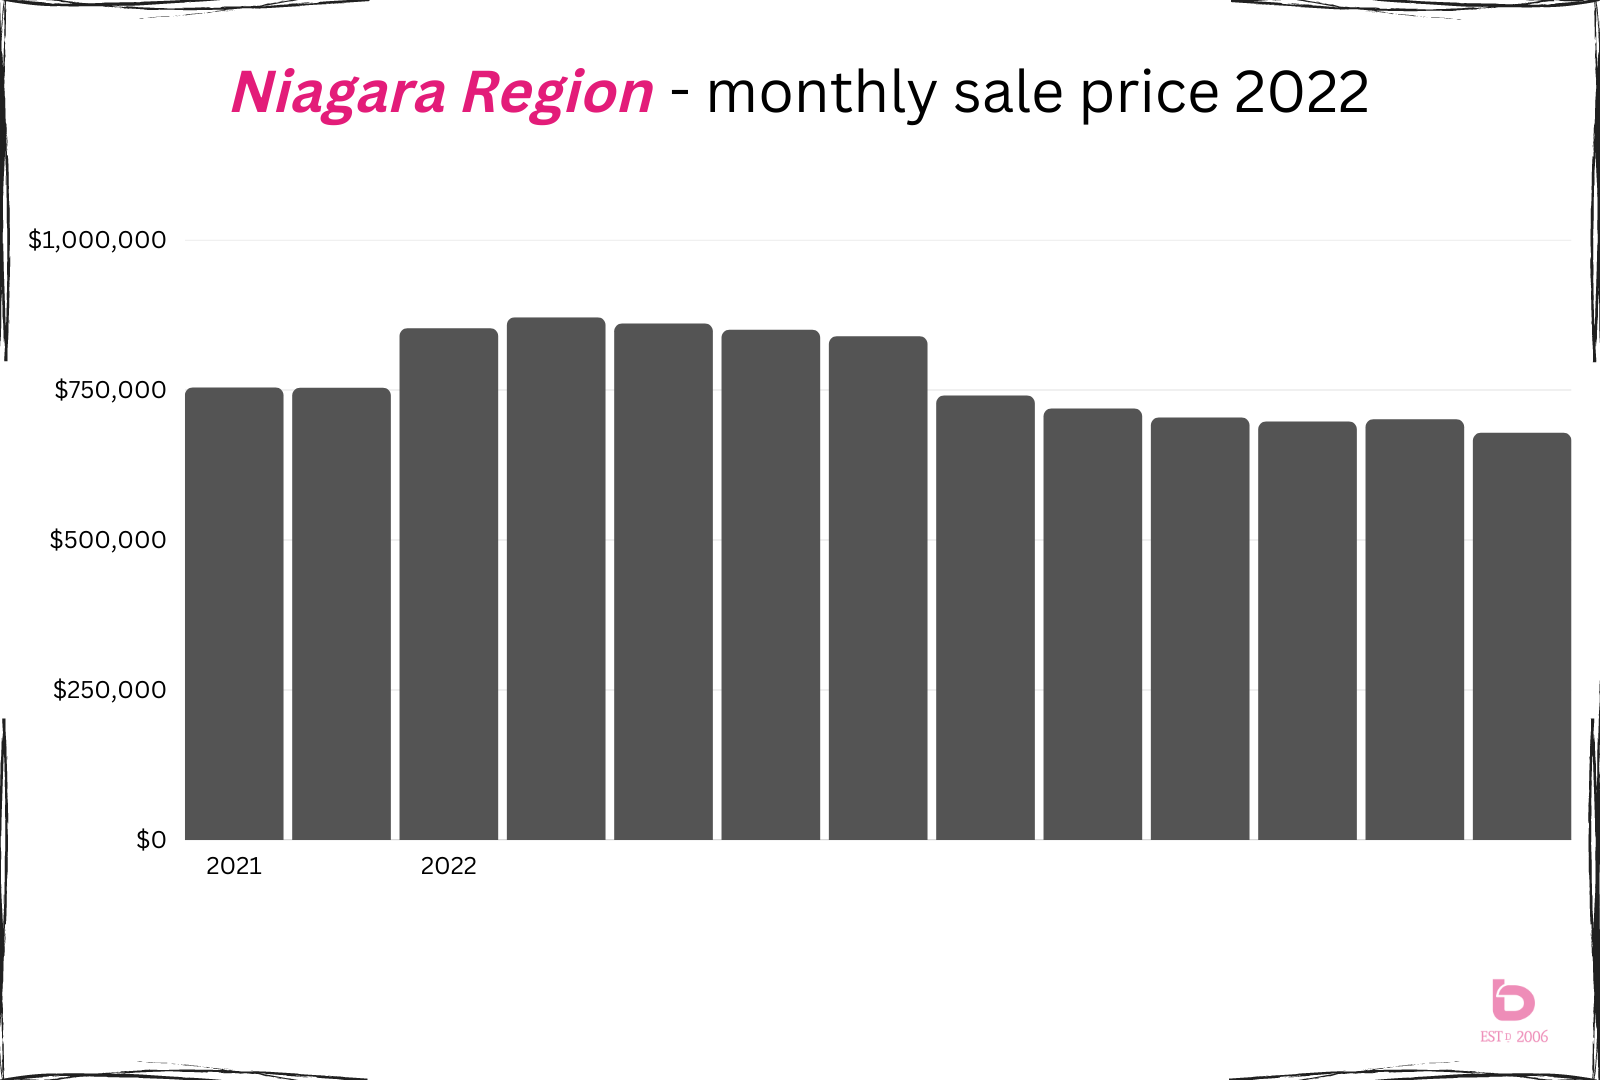
The reason for this blog is summarized in this 2022 graph.
The month-to-month average sale price in Niagara was special. The January - April time period more resembled a rock outcrop.
Note: we left November & December 2021 in to show you the size of the leap ($100k +/-) into January 2022.
Note:
The First 5 Months To date, the only monthly averages that cracked $800,000
June The big drop ($98,732 to be exact)
July & August Roughly $20,000 drop per month
September – December Settling in at something resembling bottom ($680 – 700,000)
That camel hump is the previously mentioned “unicorn riding a roller coaster” market and its influence on the annual numbers is massive. Why?
1. 45% of sales for 2022 happened in the first 4 months of the year.
2. The average sale price for those months was $856,000.
What impact does that have?
It depends what angle you are looking at things from.
2022 Annual Average $787,000 (note: as of mid-December but the 2022 annual average will be close to that)
2022 Last 4 Months $686,000
So, from 2020 to 2022, the annual increases are:
2020 $555,161 + 21.1%
2021 $709,234 + 27.7%
2022 $787,000 + 10.5% (* this is the problem)
That 10.5% is the distorted reality given that current trends are $80 - 100,000 +/- below that.
Let’s look at the same numbers but using the current trends:
2020 $555,161 + 21.1%
2021 $709,234 + 27.7%
2022 $686,000 - 3.3% (last 4 months of 2022)
So yes, 2022 is up 10.5% over 2021, but if you are selling your home today, that isn't necessarily the case.
Fast forward into early 2023 and the headlines will read something like this:
2022 Niagara Average Home Sale Prices were up 10.5% over 2021!
This is where perception can interfere with reality (and decisions and strategy and experience...)
Cue the Seller conversation.
“I just read that home prices were up in 2022 by 10%. Why do you want to price my home so much lower?!”
That annual number, when taken as a fair representation of the current market, has the potential to set people on a path that isn’t reflected in current (underscore current) market conditions.
Let’s talk about predictions for the new year…
In the last week we’ve heard:
Prediction 1: “Expect prices to increase 3 – 5% in 2023”
Prediction 2: “Prices are going to drop 20% in 2023
Prediction 3: “I have no idea”
In reality, prediction 3 is the most accurate. But prediction 1 and 2 are the confusing problem.
Prices to increase 3 – 5% in 2023.
From current trends? Yes, most likely, that is a fair estimate. (Currently at $685 – 700,000, 3 to 5% annual growth would have 2023 finishing in the range of $725 – 735,000)
From the 2022 average? No chance. That would require 2023 to average in the $825,000 range for the year, up $130,000 from current trends.
Prices are going to drop 20% in 2023.
From current trends? No chance. That would mean 2023 annual would average in the $570,000 range.
From the 2022 average? That would mean the average for 2023 would be in the $650,000 range. To get there, average home prices in Niagara would have to have another quick, precipitous drop or slide down into the $500s to average out in the $650,000 range.
I have no idea. But hear me out…
From current trends? Watch out for the first 4 months of 2023 to see how the overall market is feeling about current values.
From the 2022 average? It will be the first time since 1993 that we’ll have a year with negative price growth. If 2023 settles in the $730,000 range, that would be a year over year decrease of 7.5%.
And for you baseball fans, 1993 was the last year that the Toronto Blue Jays won the world series. That is a long streak of positive price growth.
Let's summarize this entire blog into one (run-on) sentence...
The beginning of 2022 was so powerful that it is going to skew the 2022 data to the point that even if 2023 makes reasonable gains over the last 6 months of 2022, 2023 will still be down 5 - 7% on an annual basis, something we haven't seen in 3 decades.
So, as always, beware of those headlines and make sure you ask further questions. The 2022 market reports are going to require some serious translation.
Looking to discuss things further? Want to book a call or contact us? Feel free to reach out anytime. We are here and ready to chat when you need us.