

2021: The First Half
Real estate in Niagara has had quite the year so far. And by ‘quite the year’, we mean a record setting, “I can’t believe those numbers!” kind of a year.
If there was ever a time to use a metaphor to help make better sense of an unprecedented event, it is now. In this instance, we’ll be using golf to put the recent real estate market in context.
And fear not. Playing, understanding or liking golf is not a prerequisite to understanding the point!
The Background.
Let’s suppose you typically shoot between 95 - 105 when you play a round of golf at your favourite course. Sometimes its 94 and sometimes it 107 but in general, that’s the range you typically land in.
Then suddenly, the stars and wind and putts and conditions all align, and you shoot a 79. Then a few days later, you head out and shoot an 81. Wow! Early the next week you head back out with a renewed vigour for what is possibly the world’s most frustrating yet enjoyable game. Only this time, you shoot a 97.
Are you a terrible golfer now? Dare I say, a hack!? Or did you merely return to normal numbers. Did your game ‘come back to earth’?
With that, let's look at the First 6 Months of 2021.
To carry on with the metaphor, let’s look at each month so far in 2021 and how it compared to the average for that month going back a decade.
Each month so far in 2021 has been strong in comparison to it’s predecessors. Some months were incredibly strong. Others were merely good.
For example, here is a graph showing the Number of Sales in January from 2011 to 2021 in the Niagara Region:
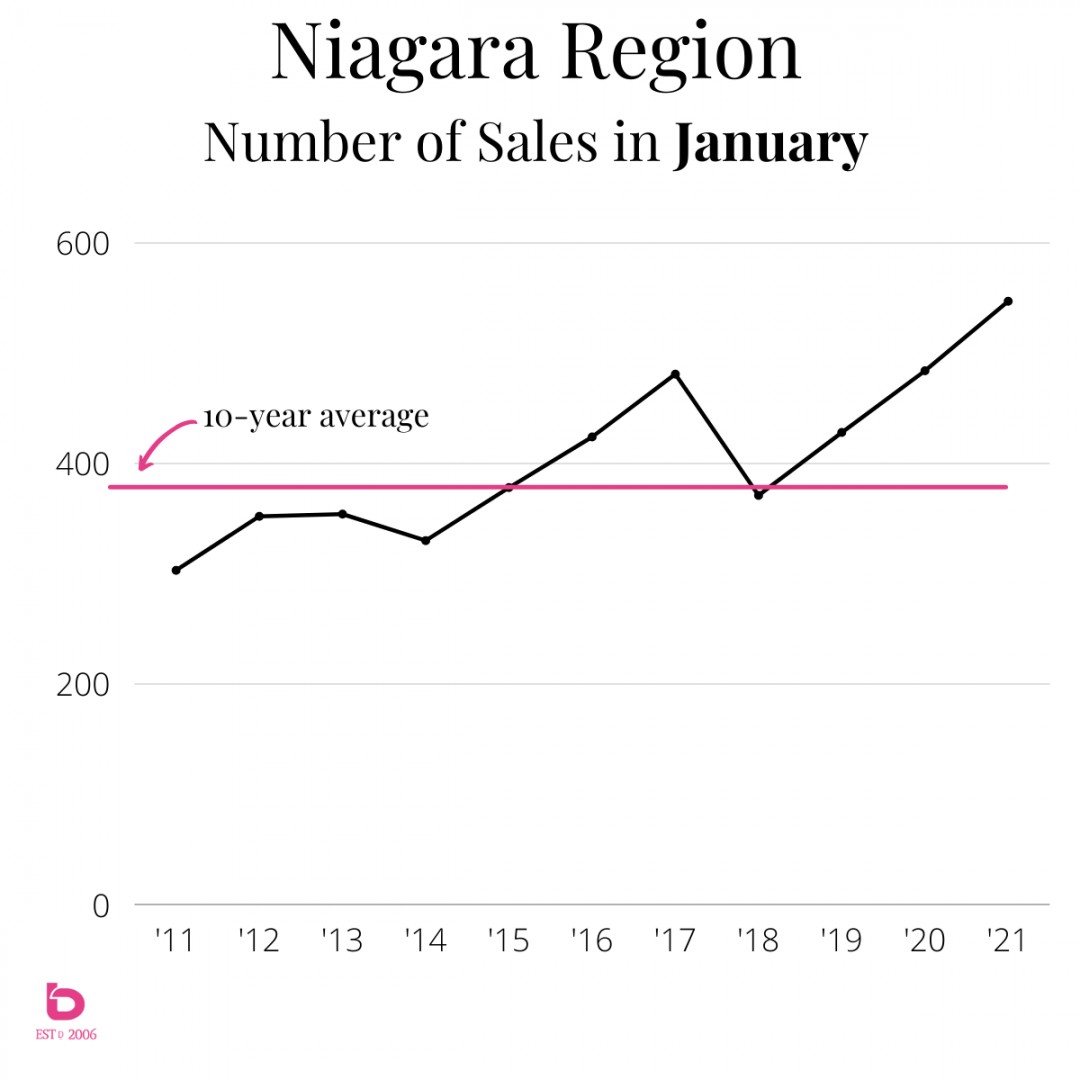
The Score: January 2021 was 40% higher than the average for the month of January going back a decade. 2nd place was 2020 with 484 sales. Meanwhile, January 2021 posted an impressive 547 sales.
In Golf Terms: A great round. Using the 95-105 range above, January 2021 was the equivalent of an 87. You couldn’t wipe the smile off your face as you headed to the patio after your round. High fives all around!
...in the interest of moving along, we'll skip ahead to March. :)
March 2021. Your Near-Record Round.
Similar to April 2021, this is one that you'll tell your Grandchildren about. The wind, the stars and your putting all aligned in a truly glorious display of above-average golf.
Here is that same concept in Niagara real estate. This graph shows how the market behaved in terms of the Number of Sales from 2011 to 2021 for the month of March:
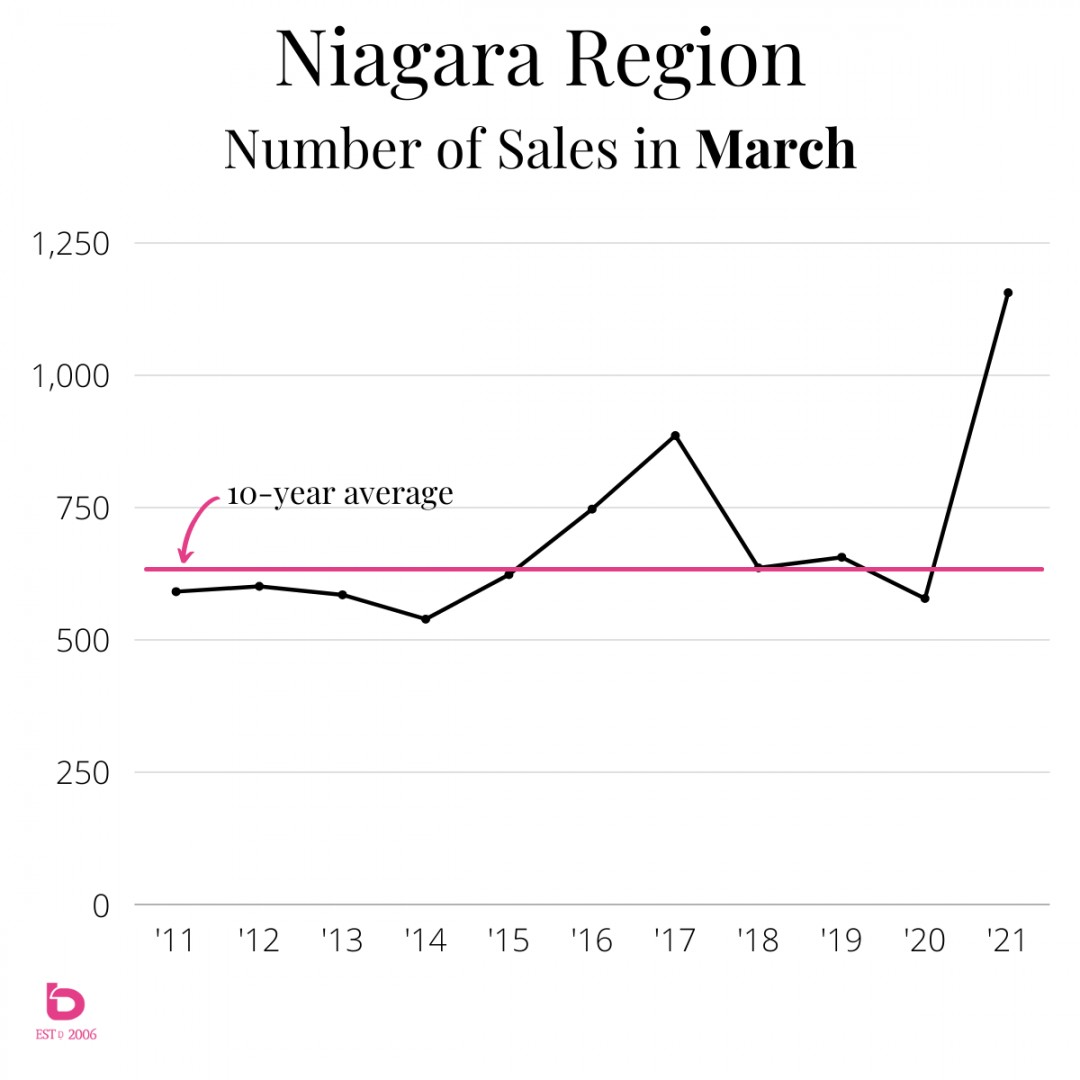
The Score: March 2021 was up 79% (a YTD best) over the previous 10-year average. It was also up 30% over 2nd place 2017, a time that produced head-turning data every day.
In Golf Terms: An outsanding round. You shot 80, something you haven't done since your last game of mini golf on Lakeshore Road in North Bay. (If you know, you know). This game is a piece of cake!
Fair to say, March 2021 earned some bragging rights, even in comparison to March 2017 which was a very active market. In fact, March 2021 was only the 5th month (of any month) in modern times that cracked 1,000 sales in a single month. It was also a hint of what was about to follow...
April 2021. Your Record Round.
What a follow-up performance to March. Your friends, while happy for you, are ready for you to get back to your old self and hit a solid 98!
And our local real estate market was no different. April 2021 posted a monster month regardless of what month you're comparing it to.
Fact: April 2021 set an all-time (in modern times at least) monthly record (for any month) for the number of sales in a month.
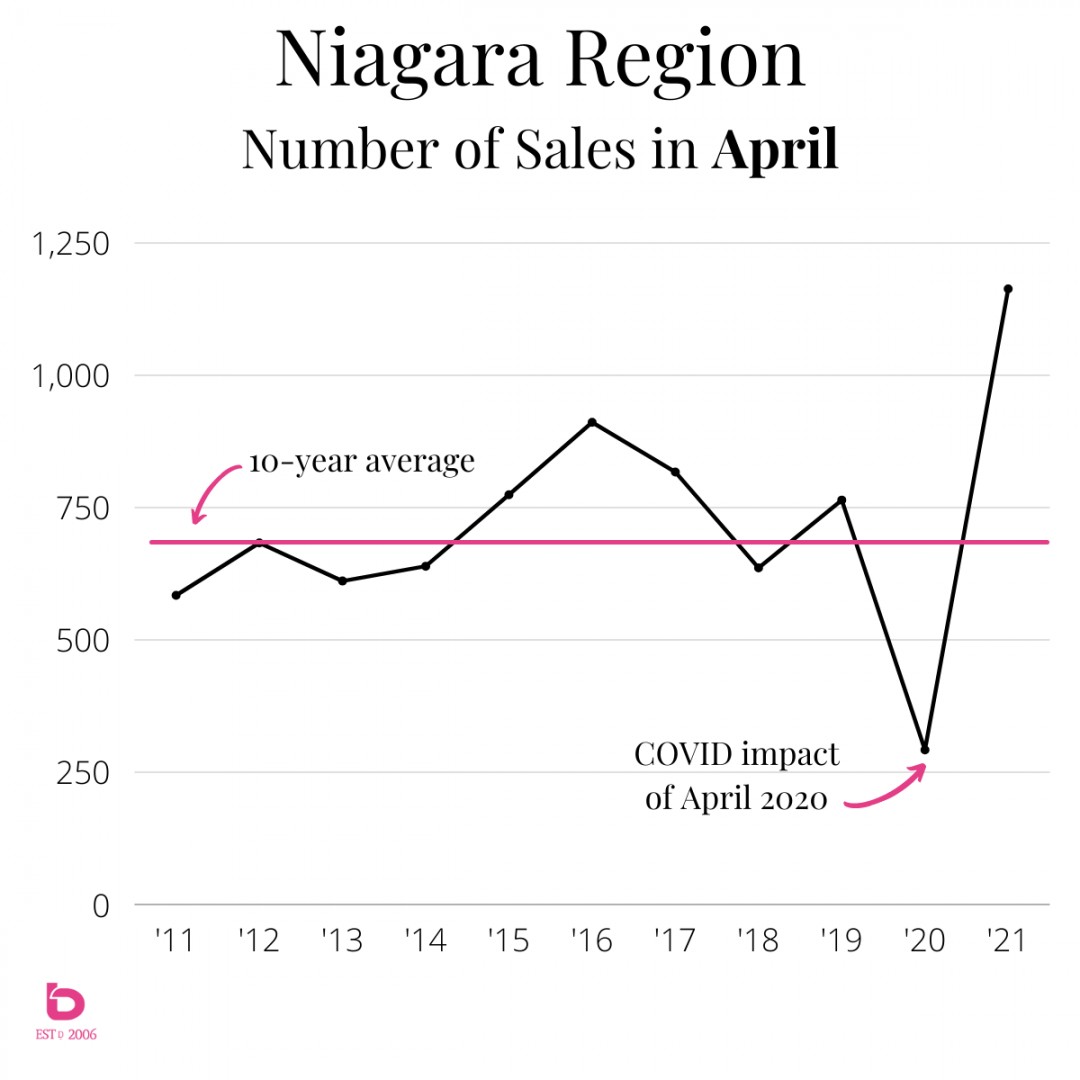
Imagine setting a monthly # of sales record for ANY month in history and doing that during a COVID lockdown? That is exactly what April 2021 did.
The Score: In terms of real estate and the number of homes sold, April 2021 was an absolute behemoth of a month. In fact, it was 73% higher than the decade average for the month of April.
In Golf Terms: That right there is your 78. All the putts dropped for you. You didn’t shank one into the forest on hole #7 like you alllllways do.
Important Note: This is another example as to why you should ignore market data posts touting early 2021 months as anything in comparison to the same month in 2020.
April 2021 was 73% higher than the decade average.
April 2020 was 56% lower than the decade average.
So yes, April 2021 was up nearly 300% compared to April 2020 in the number of sales for Niagara.
So, what just happened in May and June?
May & June, while still historically very strong months, have returned to earth. Somewhat. At least from the huge numbers posted in March and April, now 2nd and 1st respectively in the number of monthly sales in Niagara.
May showed definite calming as a follow-up to April. Was it a ‘hack’ month? Was it weakened or flat?
Let’s have a look at how May 2021 fared in comparison to the previous decade for the same month for the Number of Sales:
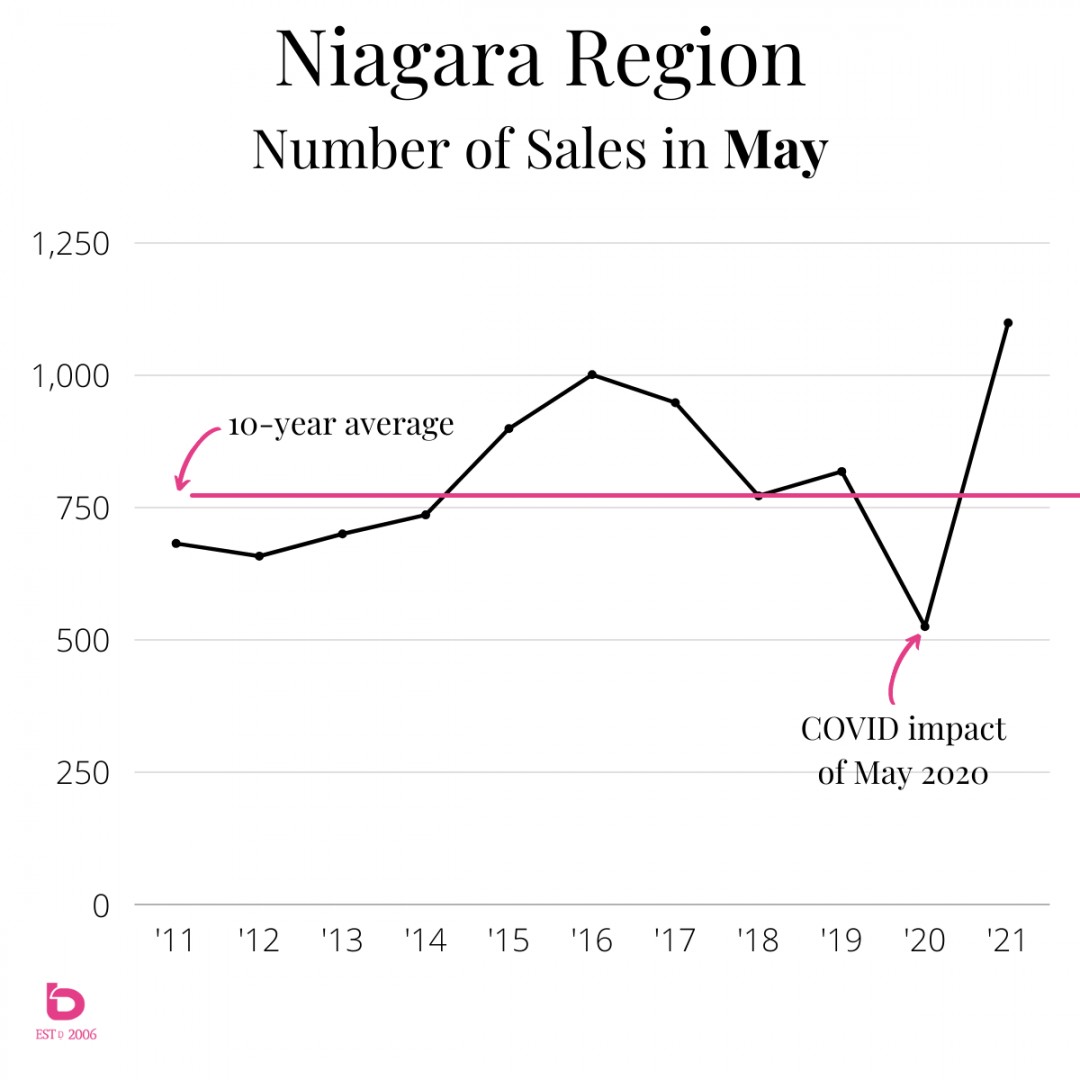
The Score: May 2021 was up 31% over the previous decade average. As impressive as being up 31% was, it was actually the lowest amount so far in 2021.
In Golf Terms: You putted well, your tee shots were great, but you had a few triple bogeys that added up to an 88. After shooting a 78 earlier in the week, you’re a little disappointed. You’ve also forgotten that you typically shoot 95 - 105.
June will tell the tale.
Was your 78 and 80 a flash in the pan? Is the market taking a momentary dip before rocketing back up? Or is it settling into more normal volume numbers. Have a look at this graph, showing the Number of Sales for the month of June, from 2011 to 2021:
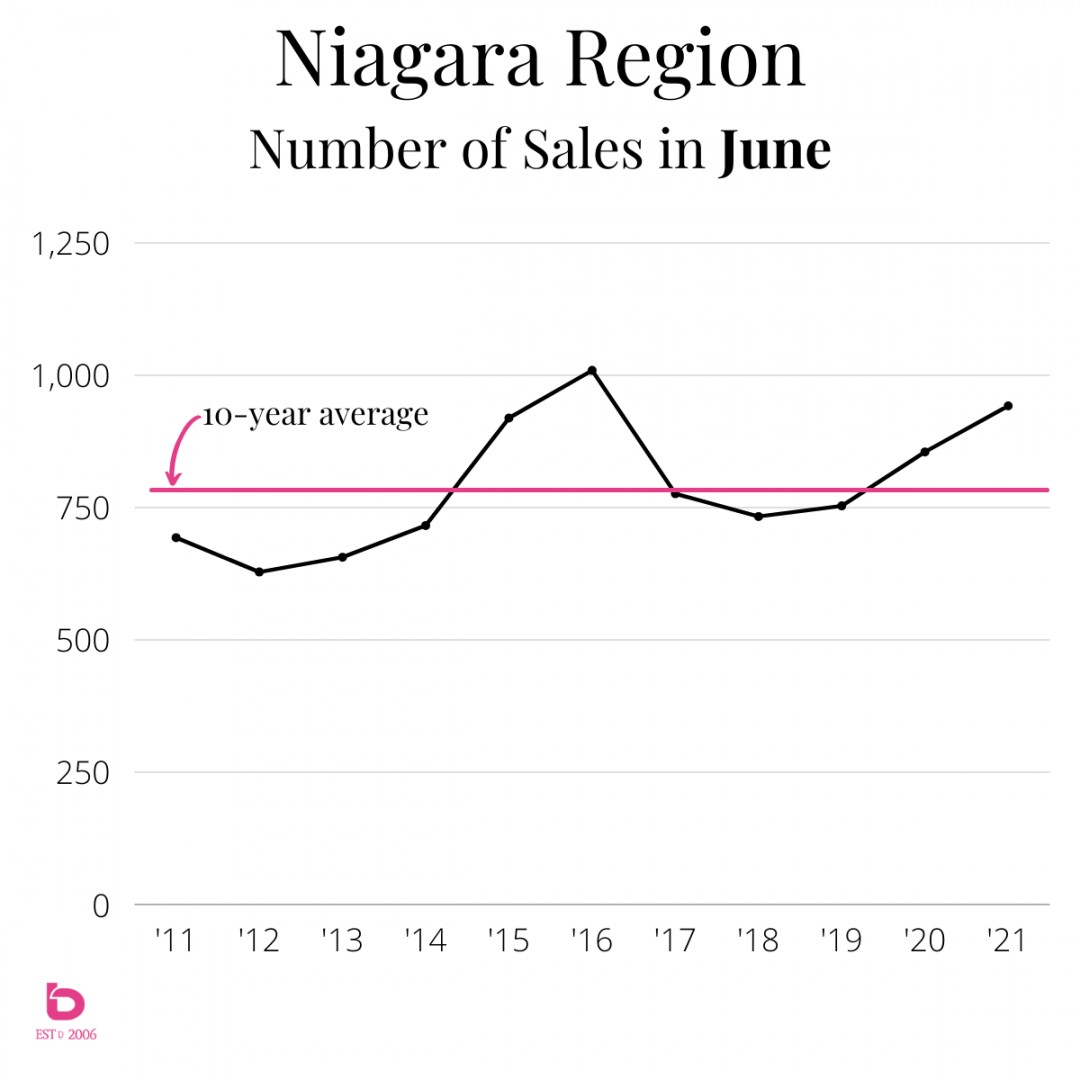
The Score: June returned to earth in comparions to the first 5 months of 2021. In fact, June 2021 was up 22% over the previous decade average for the month of June but was the first month of the year that didn't set a new record for the number of sales.
That's right. June 2021, with 942 sales, was a lowly 2nd place behind June 2016 which had 1,009 sales. So, yes, the market is settlign into more normal numbers. As well, June 2021 ended an 11-month streak of monthly records in terms of the number sales going back to June 2020.
In Golf Terms: Your game is still intact and there is nothing to be ashamed about. Sure, you shot a 90. While it's not a 78, it's also not 105. By all accounts, it's a solid game.
That's Demand. What about Supply?
This graph uses the same concept of comparing each month to how that specific month performed over the last decade. So, kind of like above but all 6 months so far in 2021 condensed into 1 graph.
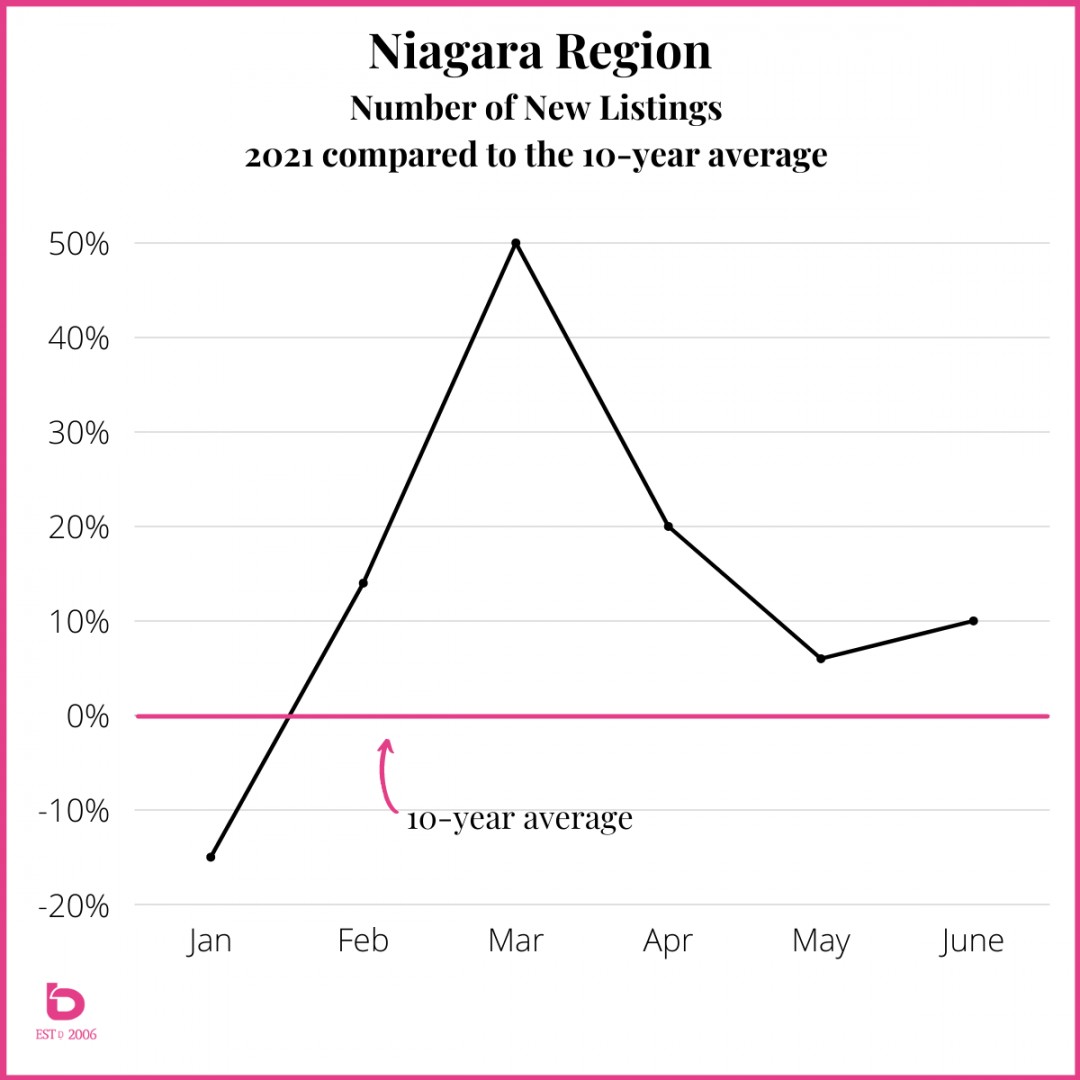
The Score: It shows that in terms of supply, January 2021 underperformed in comparison to the month of January, going back a decade. In fact, it was 15% less than normal for the month of January.
You can see as we moved into March that supply made a significant comeback with March 2021 beating the average by a full 50%. In any other market that would typically lead to a quiet, balanced or even buyer's market.
In Golf Terms: That graph really just shows how monumentally strong your low rounds were back in March & April, with a distinct return to normal altitude as we moved into June.
Demand.
The earlier (month-by-month) graphs above show how powerful Demand (Number of Sales) was though during the same time. So, let's look at the same graph (monthly, so far in 2021) in terms of how this year has performed in relation to the norm:
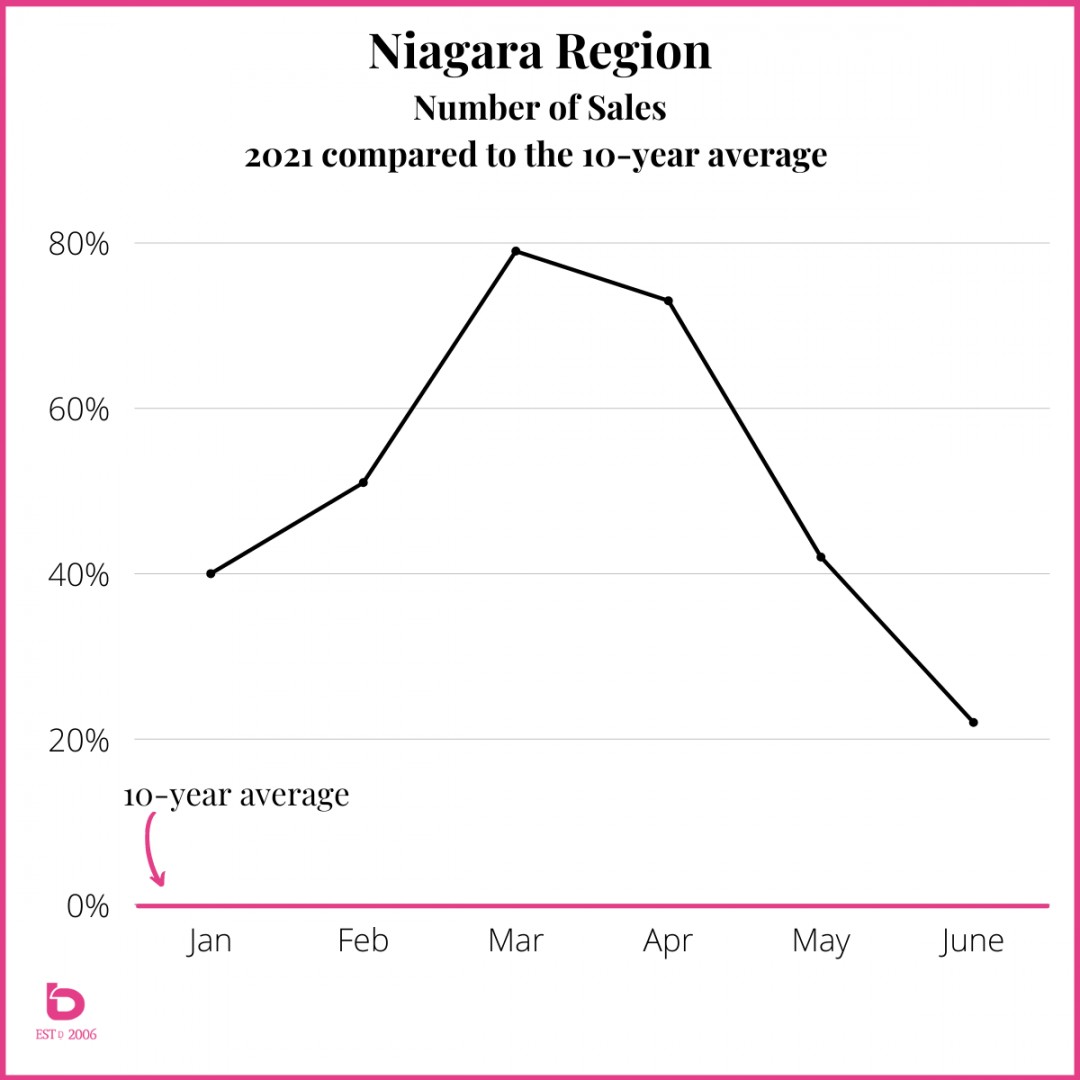
That Demand graph shows you 2 things. Well, more than that, but 2 in particular.
- March & April were powerfrul months.
- May & June showed a very definite move back towards normal.
Let's look at both, combined onto one graph. Note, no matter what supply did in terms of gaining momentum, sales just kept outpacing it.
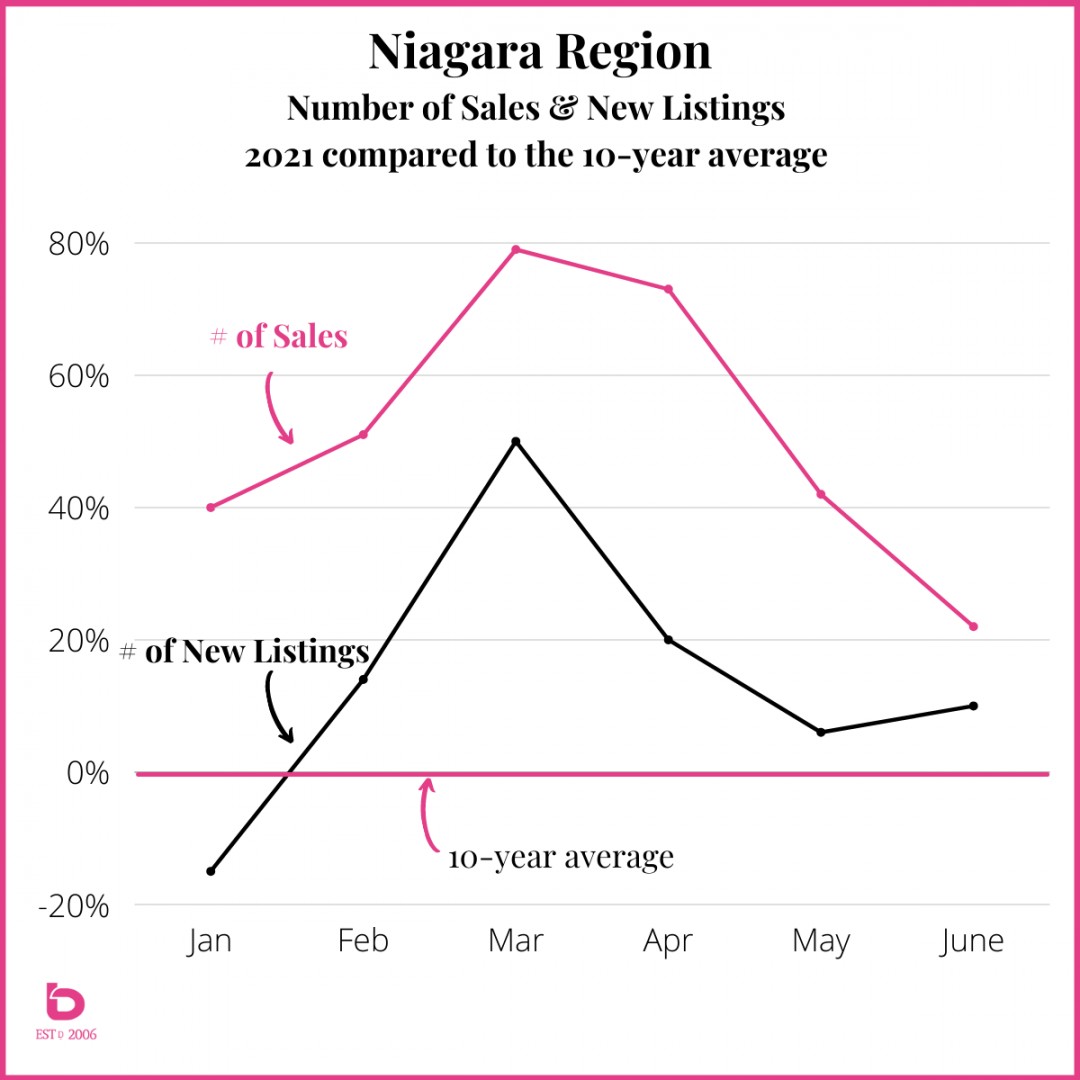
The Score: Supply couldn't keep up with Demand but that is changing. As much as June tightened up, July is expected to tighten up even more.
In Golf Terms: You're well on your way to shooting in the 90s again. Not 105 though so still, all around, the game is being good to you. No clubs getting snapped over the knees at this point!
...at the risk of exhausting the metaphor, let's pause the golf talk for now.
What about other municipalities?
As we often mention, the 2 largest markets in Niagara in terms of sales volume (Number of Sales) are St.Catharines and Niagara Falls. Let's have a look at that same Supply & Demand info.
...and a sidebar. If you're curious about how other cities performed, these same trends ran fairly consistently across the entire region.
St.Catharines
While not at the levels of the Region as a whole, St.Catharines still posted strong numbers year-to-date. That being said, May and June are winners of the ‘most likely to resemble normal months’ award.
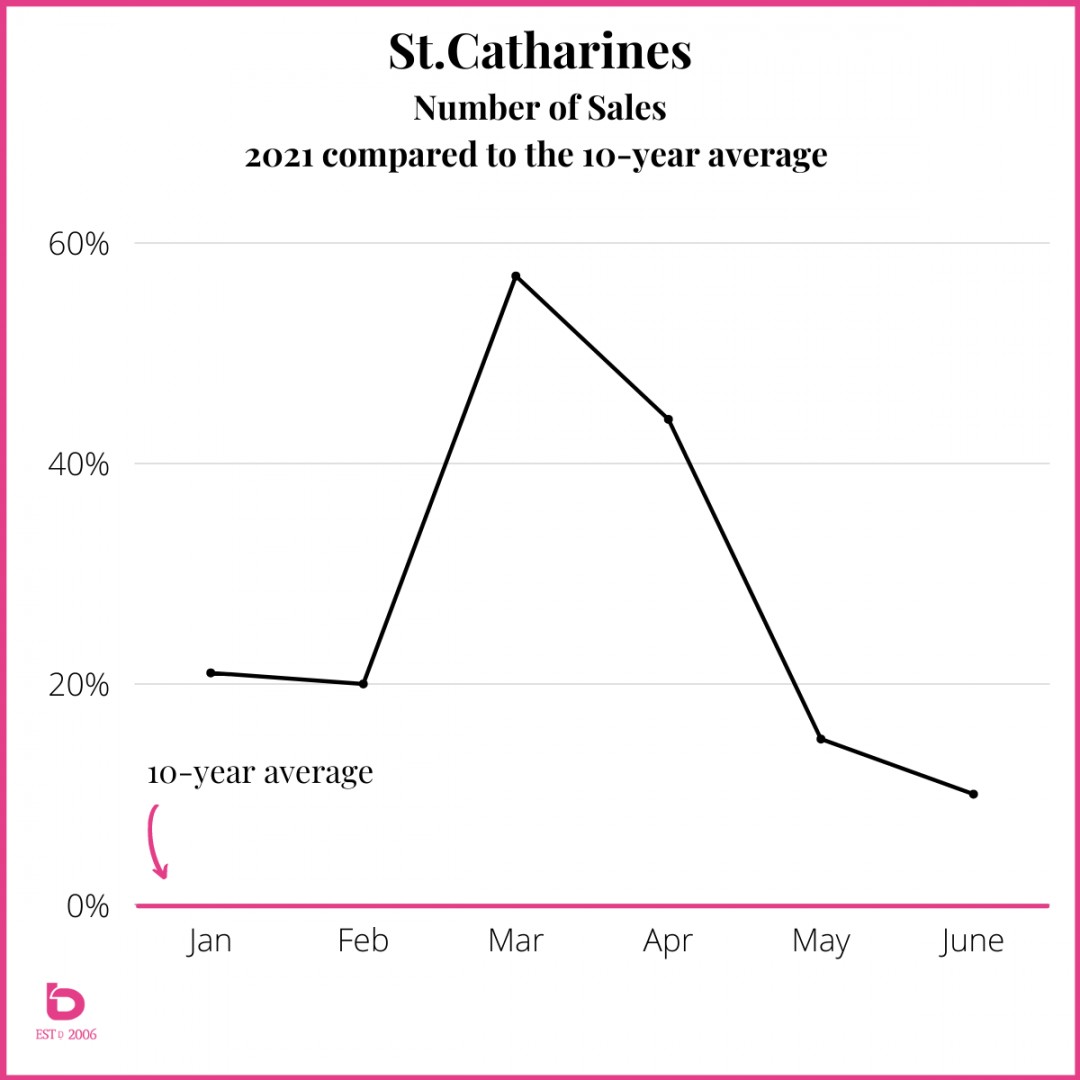
DEMAND (Number of Sales)
Note, while January & February were strong (20% +/- higher than average), March & April took that momentum to another level with March topping out at nearly 60% above the norm for that month.
Similar to the region, May & June have shown a return to normal altitude, settling in at a more modest 10 - 15% above the norm for those months.
July? Our expectation is it will be right back to a "normal" July in terms of both Supply & Demand.
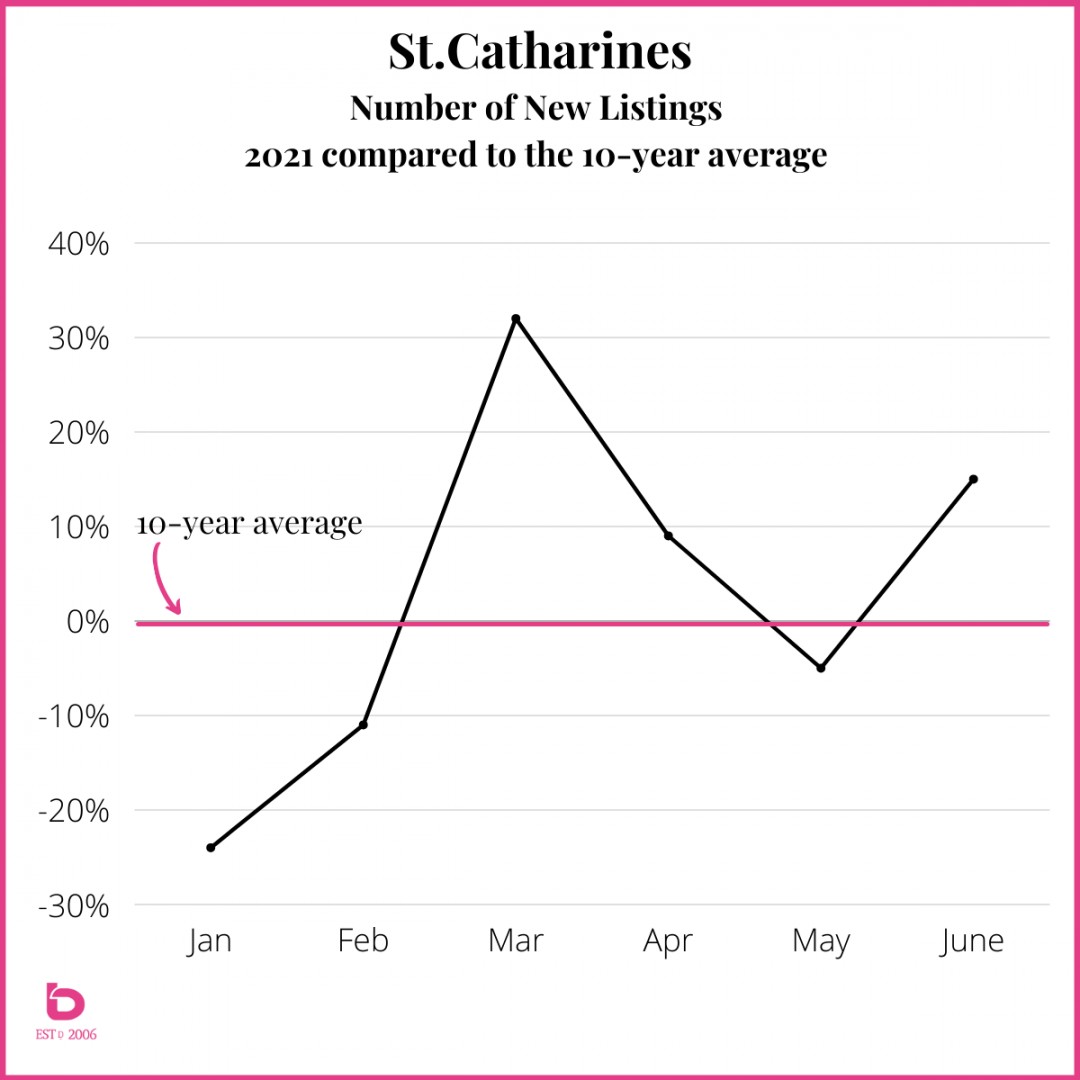
SUPPLY (Number of New LIstings)
It doesn’t take a statistician to see that St.Catharines has been undersupplied so far in 2021. In fact, having 3 of 6 months under the decade average is fairly unique in comparison to the other cities. That being said, June put up a fight to get back into the positive after a negative month of May.
Comparing DEMAND & SUPPLY Directly:
NOTABLE: The number of new listings actually outpaced the number of sales (decade average) for the first time this year in June. For you buyer’s out there, that’s a reason for optimism.
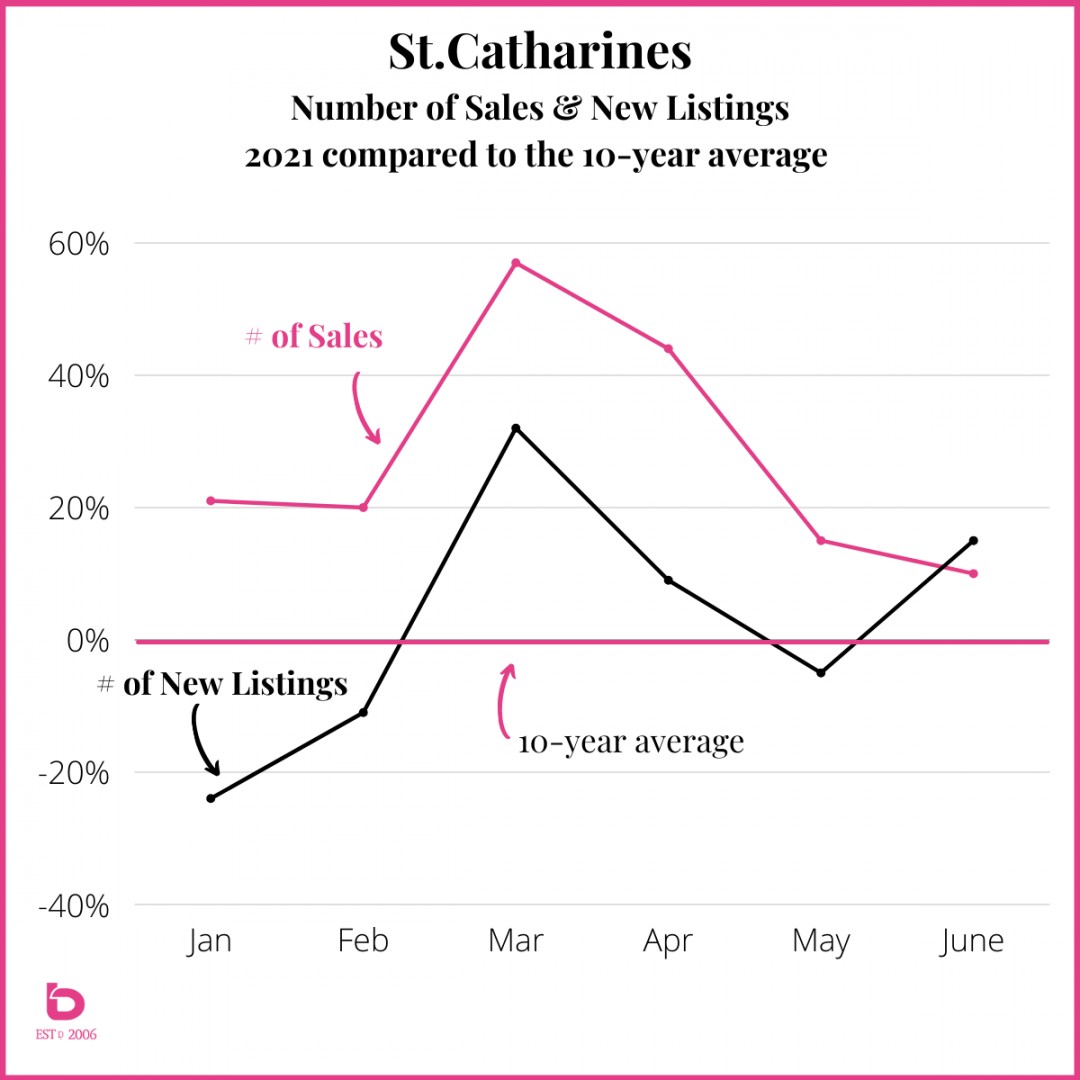
That volatility or reluctance in the number of listings (Supply) coupled with the number of sales (Demand) has created some data unlike anything we’ve seen. And again, these same trends can be found from St.Catharines to Fort Erie and nearly everywhere in between.
Niagara Falls
Niagara Falls has been shooting the lights out all year so a return to normal isn’t a huge surprise.
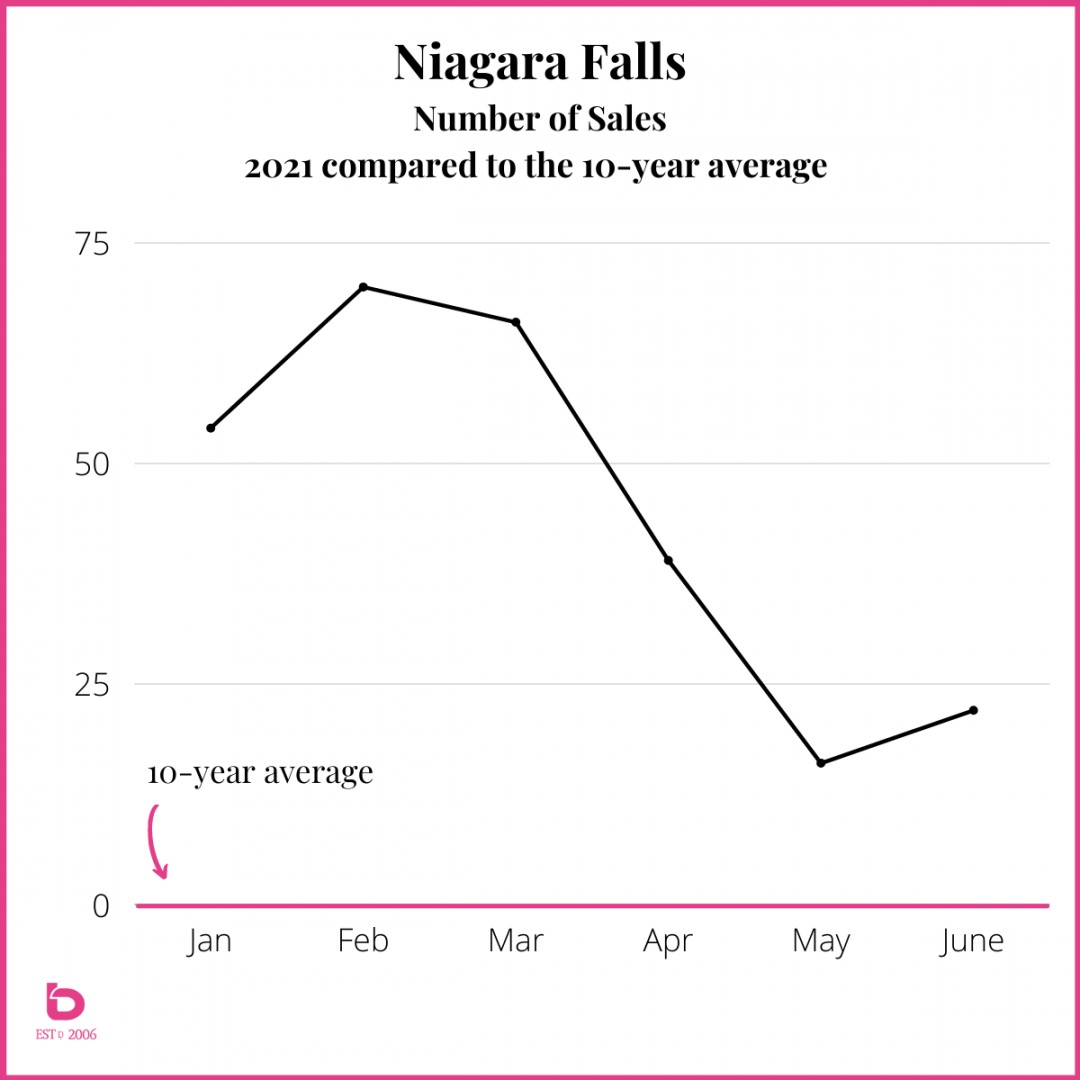
DEMAND (Number of Sales)
Notice the number of sales peak in February at 70% above the 10 year average as a steady calming has resumed through June which beat the decade average quite comfortably at just over 20%.
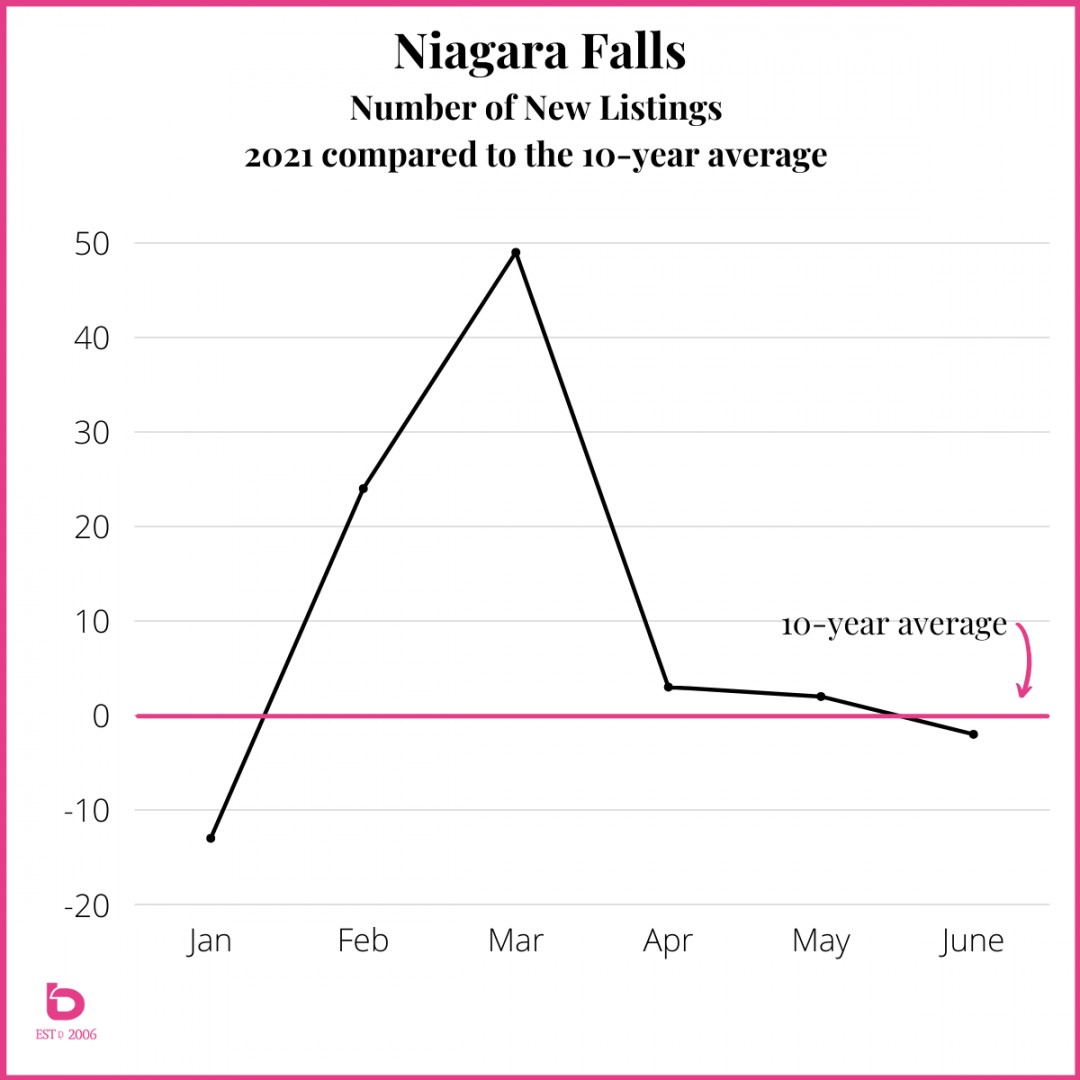
SUPPLY (Number of New LIstings)
Meanwhile, the Supply of New Listings really flattened out over the last 90 days, a trend fairly unique to Niagara Falls. So, while the number of sales pulled back, they still seriously outpaced supply.
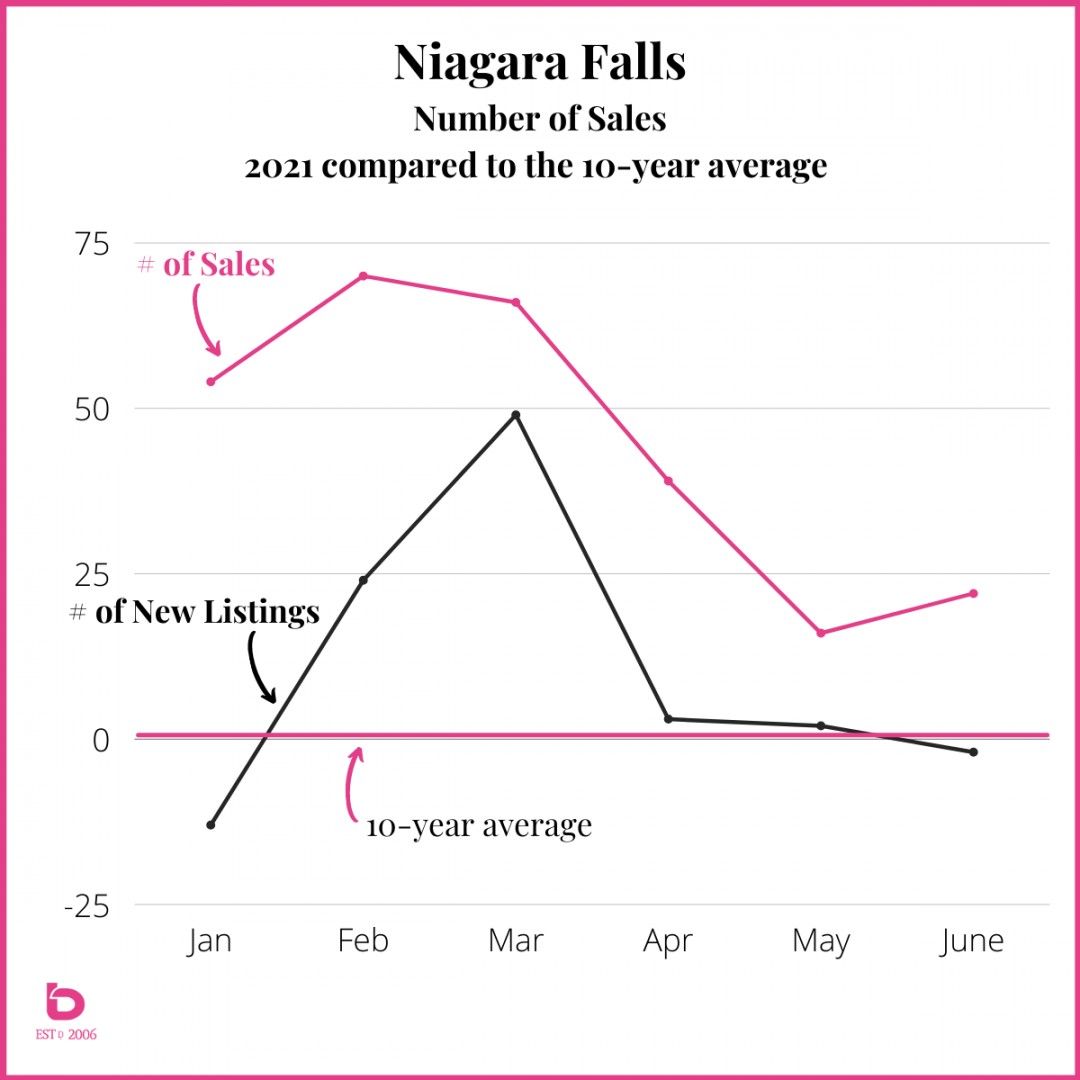
Comparing DEMAND & SUPPLY Directly:
While April Number of Sales pulled back to beat the decade average by only 39%, the Number of New Listings were only 3% above the decade average.
May Number of Sales were 16% above while the Number of New Listings were only 2% above.
While smaller, that spread continued to create a competitive market where there are more buyers than product.
Sale Prices
It's time to rewind the clock back to High School Economics. It doesn’t take an economist to know that reduced supply coupled with heightened demand is only going to lead to increasing prices.
As we came through the back half of 2020, there was a noticeable build-up of buzz in the marketplace. Blame it on COVID or low interest rates, itchy feet or a shaking up of how and where we work, people moved. And they moved a lot!
The result was escalating demand and pricing followed right along. These graphs tell the tale...
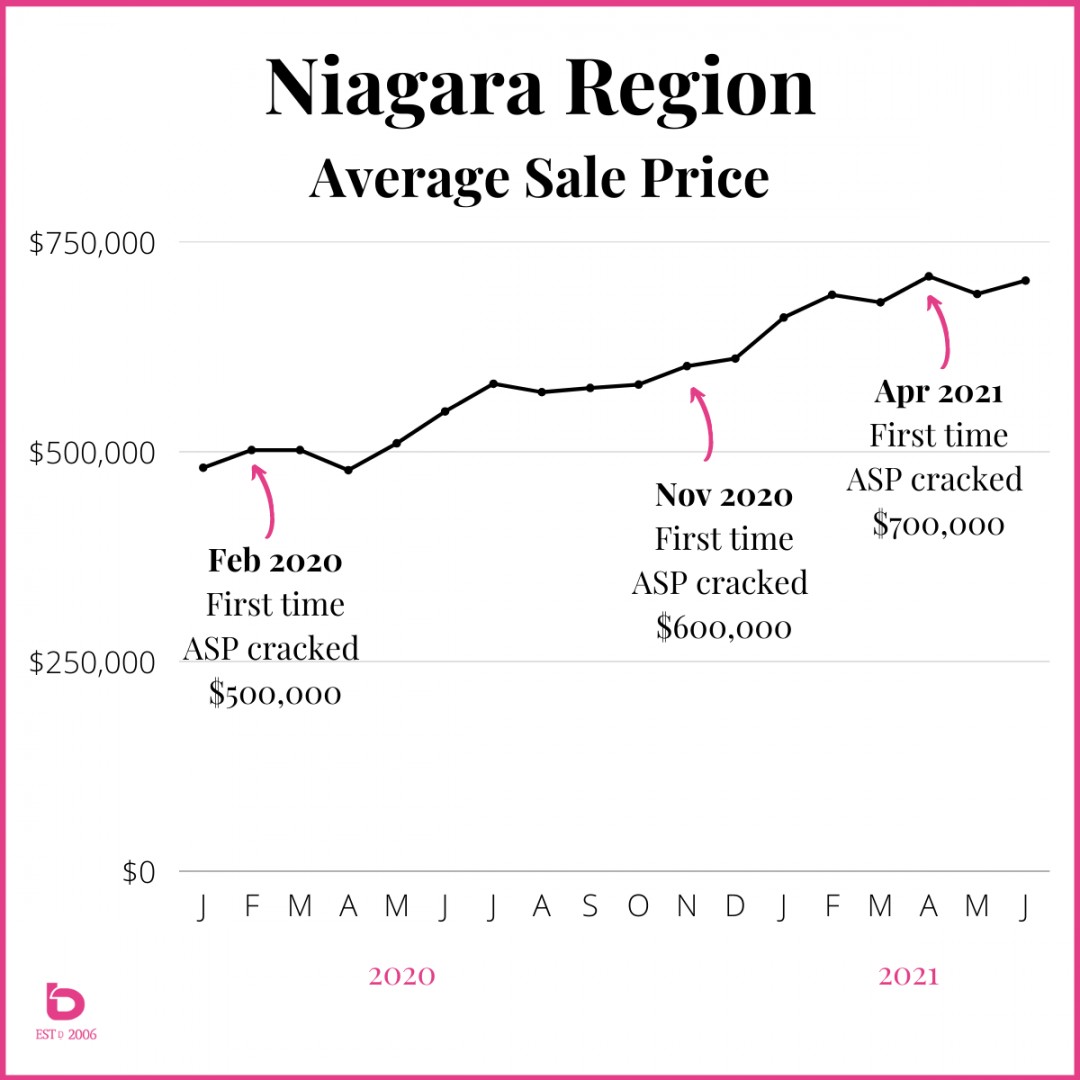
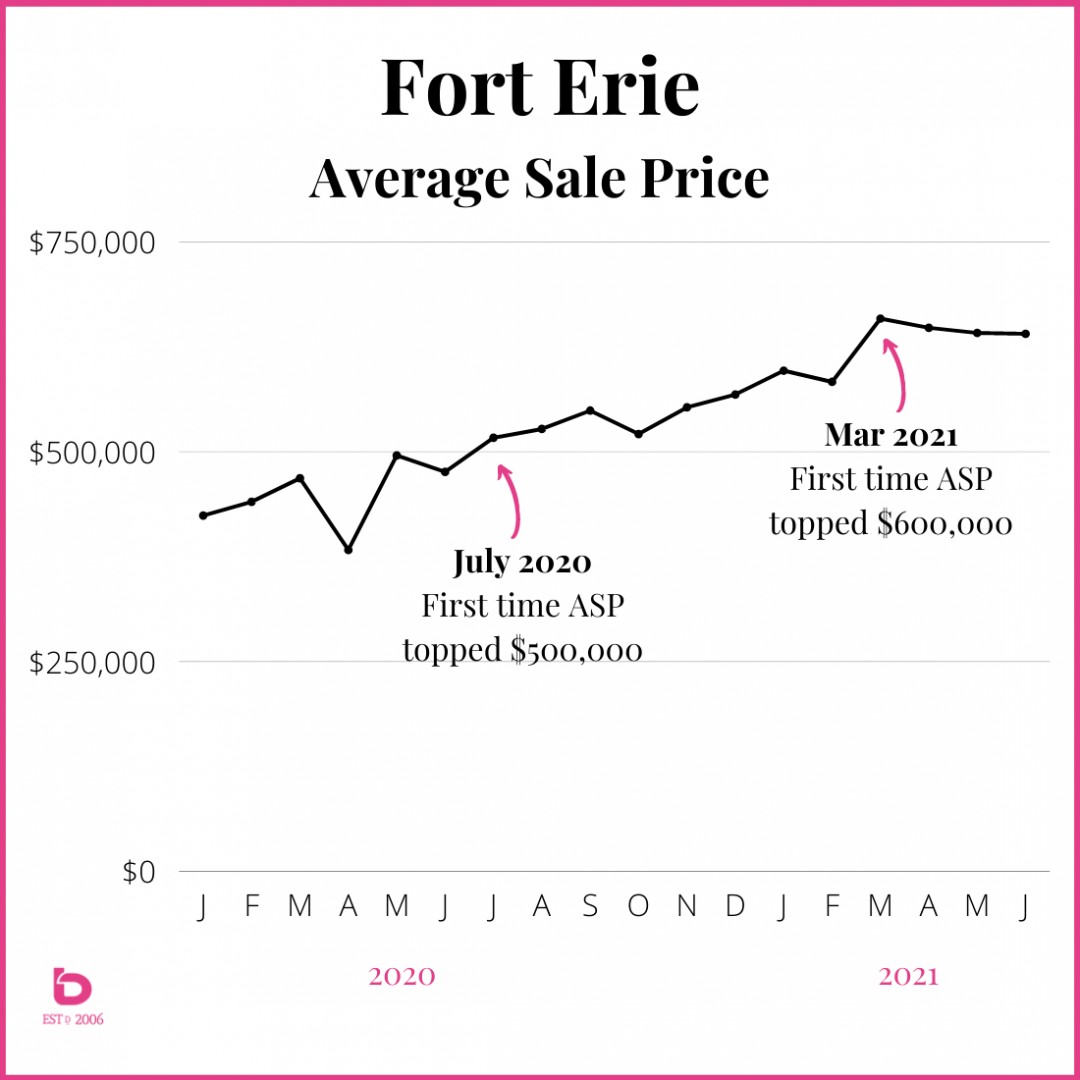
Niagara Region - Average Sale Price for the Last 18 Months, going back to January 2020:
Phase I of Pricing: notice the brief pullback in pricing in April 2020 when COVID first reared its ugly head on the market and our lives in general.
Phase II of Pricing: after the pent-up market through March - May 2020, pricing had huge growth through July into September.
Phase III of Pricing: after some relative quiet, there was 10-12% growth from November into January which set the table for the activity of 2021.
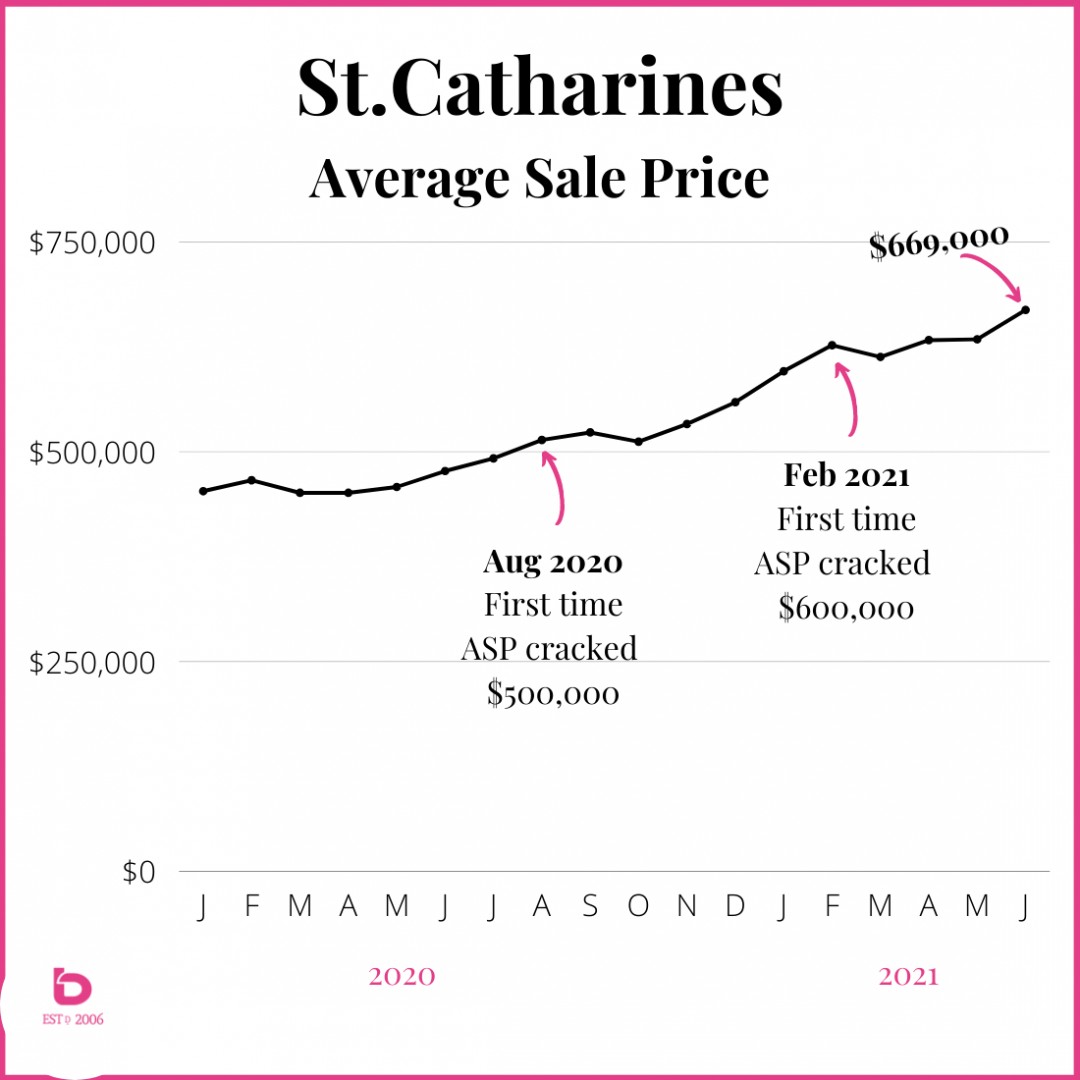
Regardless of the city, pricing has behaved consistently across the region. First, let's break the cities up into categories:
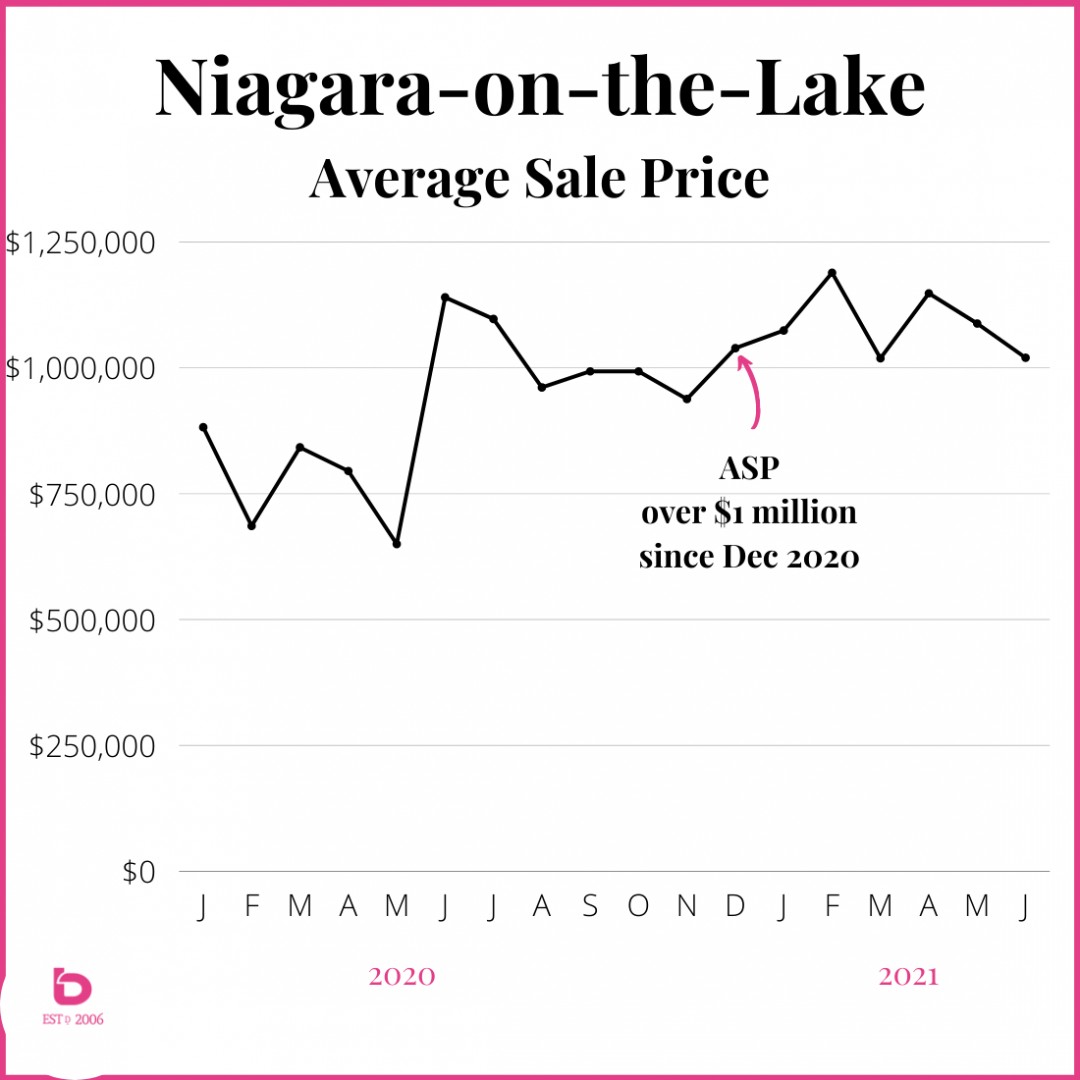
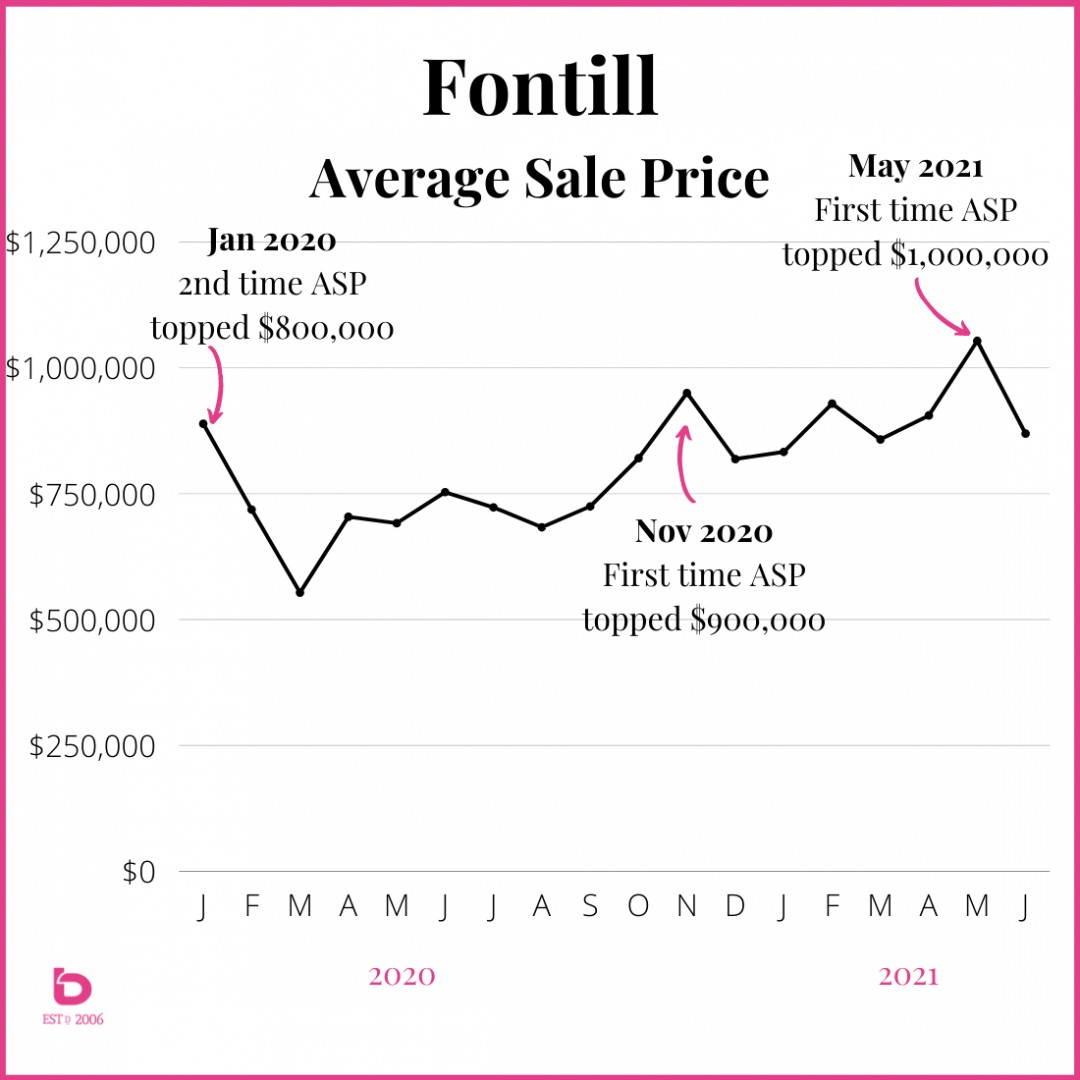
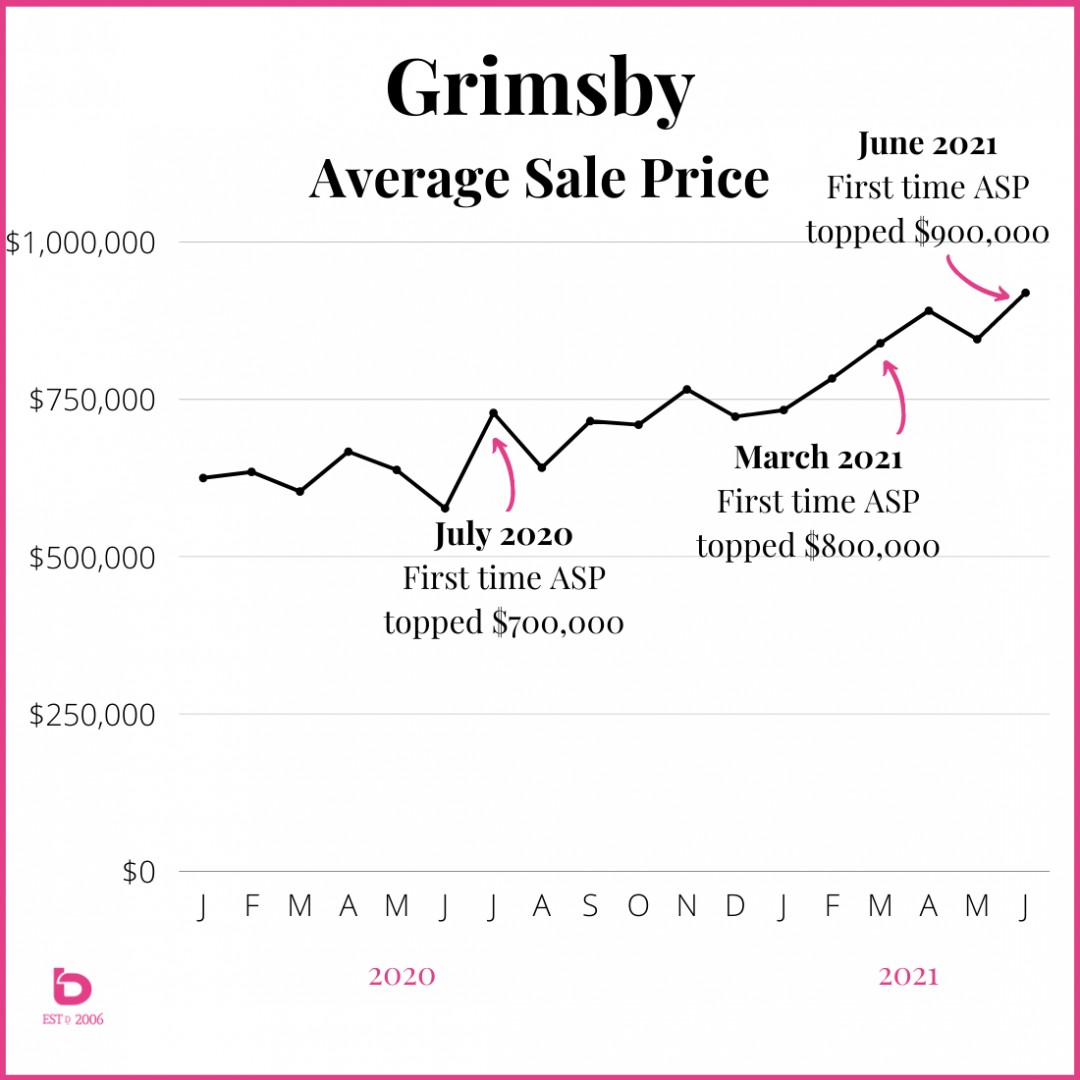
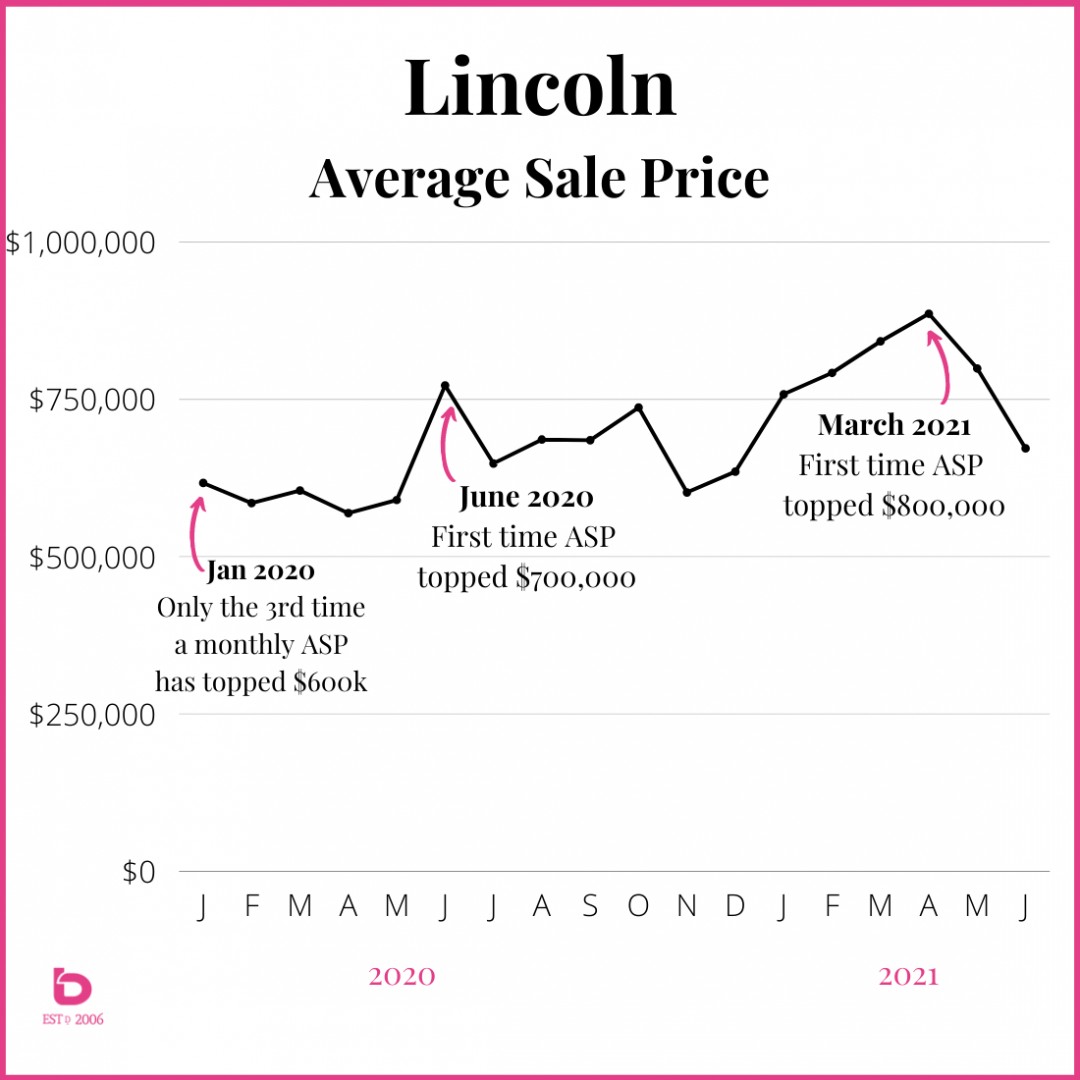
The Top-End includes Niagara-on-the-Lake, Fonthill, Grimsby & Lincoln.
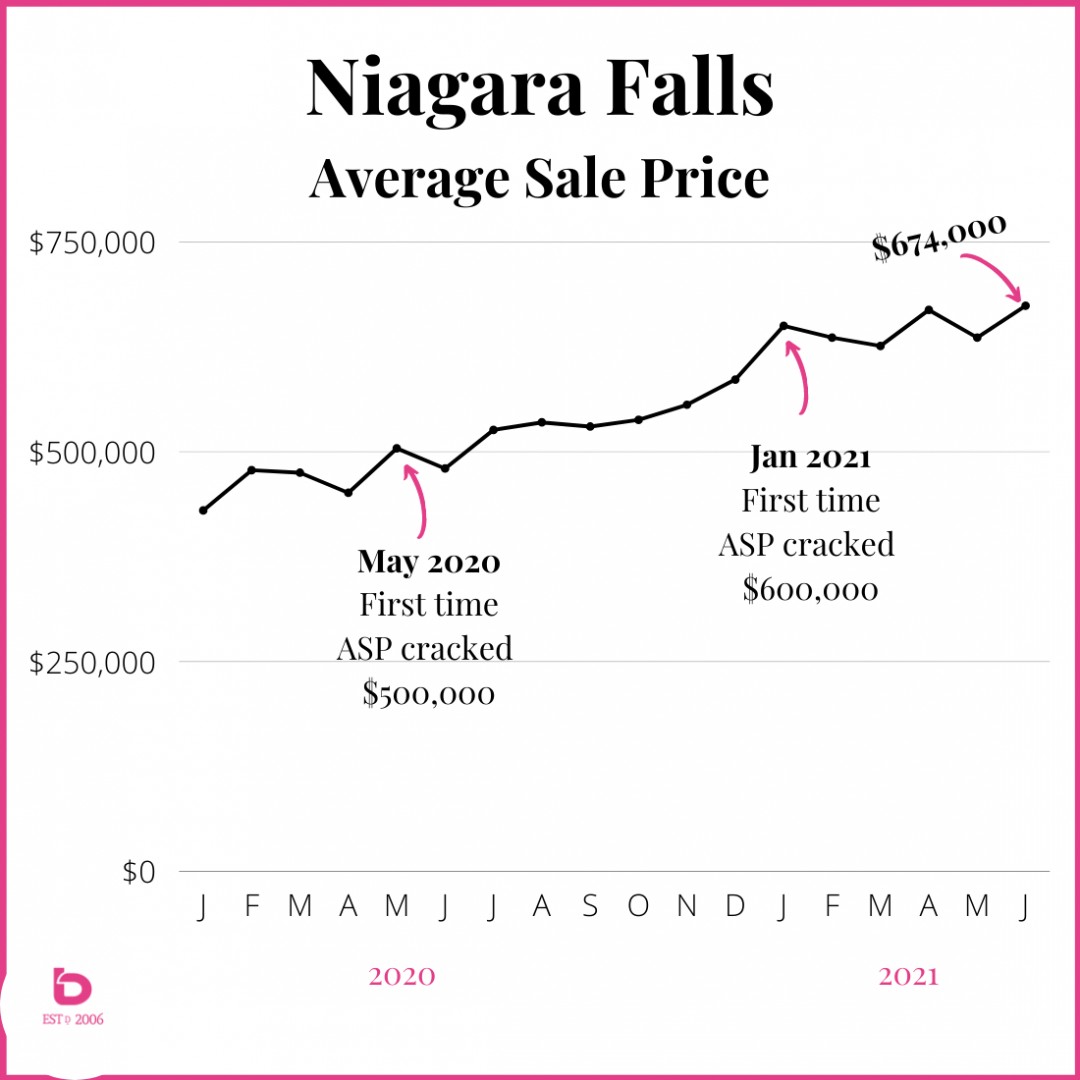
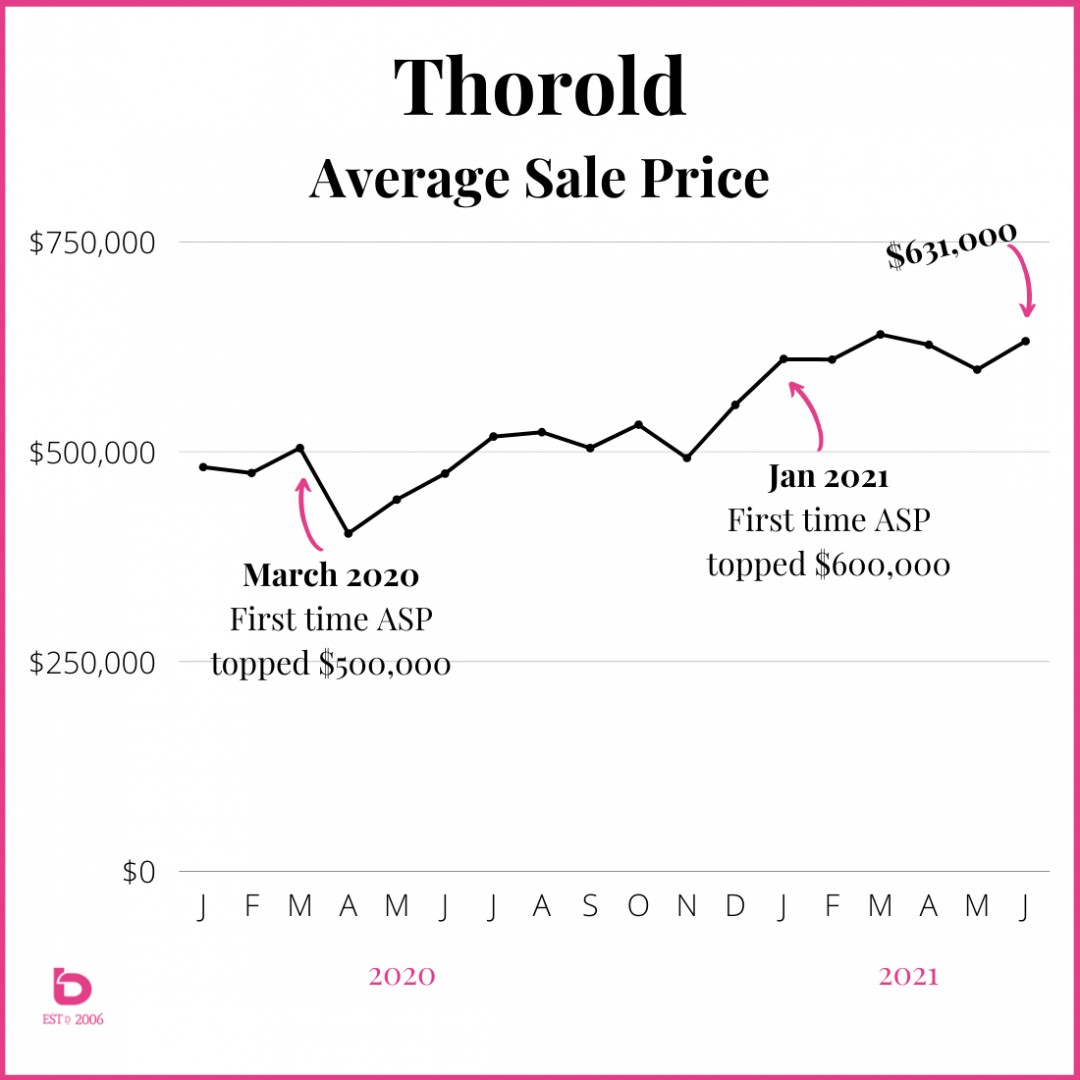
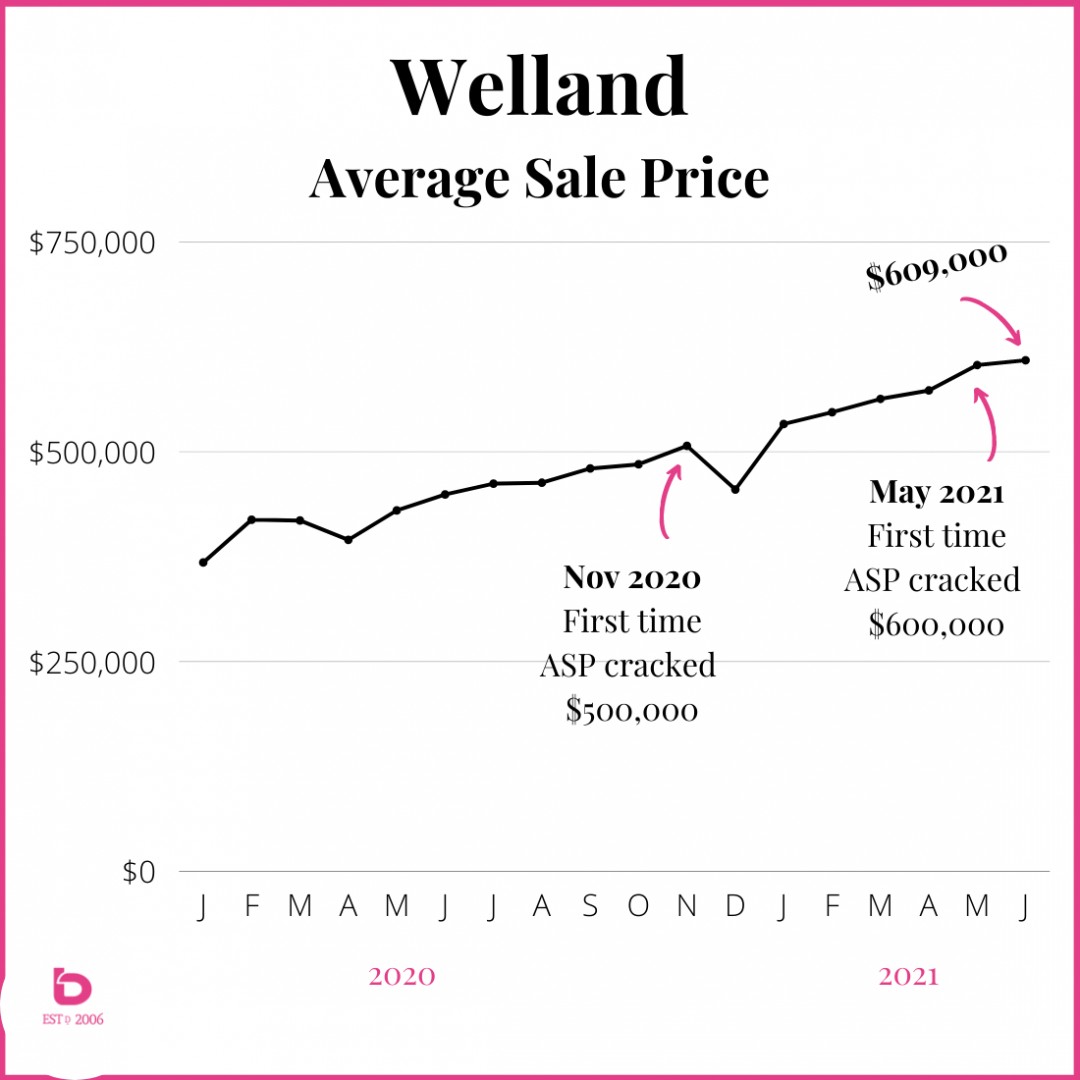
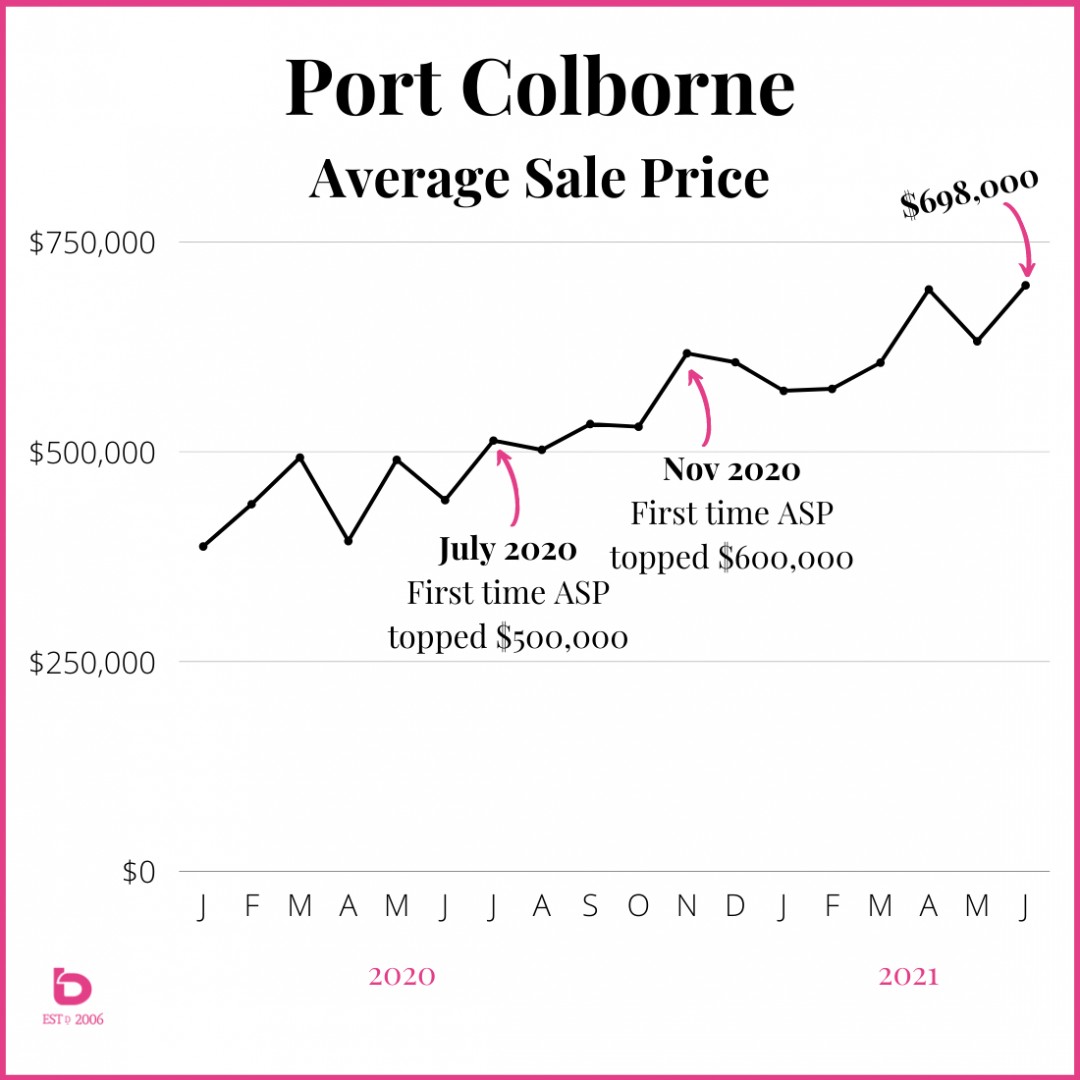
The Others include St.Catharines, Niagara Falls, Thorold, Fort Erie, Port Colborne and bringing up the end but gaining steam, you have Welland.
Here is how Average Sale Price performed for all cities in Niagara going back to January 2020:
To Sum Up....
As you can see from the very first graphs in this bLOG, the supply and demand, while elevated through March & April, are on a trajectory back down to earth whcih continues as we head into July.
Our expectation is as the market relaxes, we'll see New Listing and Sales Numbers that resemble a fairly ho-hum trend.
In fact, we may see those averages get back to the same or slightly under what we've typically seen over the last decade.
Why?
The market can only run flat out for so long. Think of sprinting. Eventually, you have to gear down and catch your breath.
As COVID and its lockdowns relax, our focus will move onto the things we've truly been missing out on for the last few years. Moving will be moved to the back seat in favour of travelling, seeing family, going to concerts, visiting friends and other things we've all missed out on since 2019.
Buyer fatigue is a real thing. Even though the market is going to be much more favorable for buyers over the next 2 or 3 months, a lot of buyers hit a wall and tapped out. They may return to the market but will do so with less wind in their sails.
Where do we go from here?
We expect to see the trend of 2 month groupings continue through 2021.
What does that mean?
January & February - ramping up across the board
March & April - the market ran flat out and set historic records
May & June - the market relaxes back towards normal numbers.
July & August - things are much quieter as our attention moves to post-COVID priorities (family, travel, life).
September & October - the market often has a lift as we return back to more 'normal life' after enjoying the summer months. We expect to see that happen again.
November & December - again, overall activity typically eases as we approach the end of the year. Pulling out the crystal ball for this far into the future is a bit of a perilous concept.
There is one thing you can count on however and that is the market is always changing. Look back over the last 5 years and you'll see many different markets, some in favour of the buyer, some in favour of the seller and some bordering on uneventful.
What are we watching?
Tracking and monitoring how it calms in relation to the norm will be key to gauging where things are and where they’re potentially going. We will continue to do that on a consistent basis so don't be aftraid to reach out with questions.
But what about my city?
Fret not! We have a few other resources for you.
Our Market Insight page on our website tracks pricing, supply & demand for all municipalities in Niagara.
You can find the link here:
You can reach out to us anytime with more specific questions. We’re happy to send you a report at no obligation or cost.
We hope you have found this First Half 2021 Report for Niagara Real Estate helpful.