

BRACE YOURSELF
To paraphrase Professor Axl Rose, "welcome to the statistical jungle."
Never in my 20+ years in this business have I seen such lopsided market data. And that says a lot(!). Whether that is the late 2008 financial meltdown market, the 2016 – 2017 boom market or the COVID bludgeoned April 2020 market.
When compared to the previous year, early 2023 will produce market data unlike anything we've seen this century.
Why?
Q1 2022 was a behemoth market where sales demand was relentless and crashed head-on with lukewarm supply. The result was average sale prices jumping up 15 – 20% in one month.
Q1 2023 (so far) is characterized by exceedingly hesitant demand being fed a firehose of new listing inventory that they largely aren’t interested in.
Individually, they are remarkable markets but for different reasons. Comparing them will produce varying degrees of shock and awe.
BUYER DEMAND
Early 2022 was intense. 17 offers. $152,000 over asking. Mayhem.
Early 2023 was hesitant. One offer. 82 days on the market. $42,000 under asking. Quiet.
Case in point:
This graph shows you the number of homes sold in January 2023 (in pink) compared to January 2022 (in black) and the 10-year average (in grey):
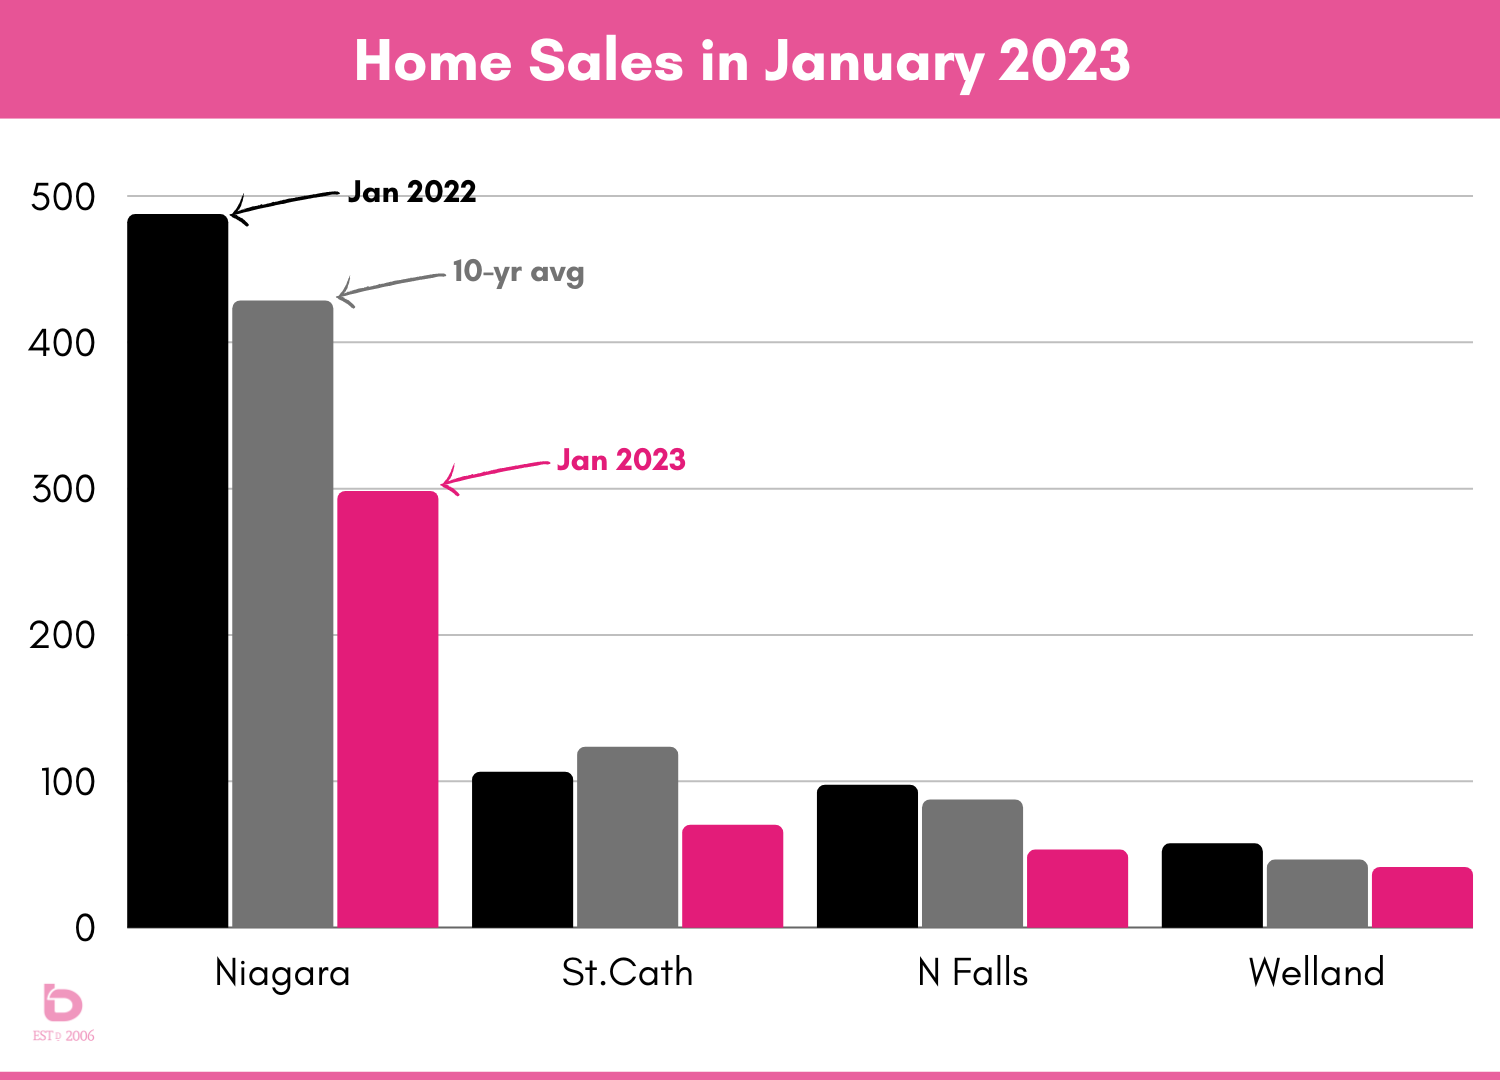
Comparing sales numbers in January 2023 to anything paints a not-so-pretty picture. Comparing them to January 2022 is almost unfair.
Here are the numbers for all of Niagara:
| CITY | Jan 2022 | Jan 2023 | % Change |
| Niagara Region | 487 | 298 |
- 39% |
| St.Catharines | 106 | 70 |
- 34% |
| Niagara Falls | 97 | 53 |
- 45% |
| Welland | 57 | 41 |
- 28% |
| Niagara-on-the-Lake | 22 | 10 |
- 55% |
| Thorold | 23 | 23 |
n/c |
| Grimsby | 33 | 16 |
- 52% |
| Lincoln | 33 | 21 |
- 36% |
| Fonthill | 14 | 12 |
- 14% |
| Port Colborne | 30 | 27 |
- 10% |
| Fort Erie | 59 | 30 |
- 49% |
WHAT ABOUT INVENTORY?
The lack of demand is further complicated when looking at homes for sale. In math terms:
- Very low demand + low inventory = sustained prices
- Very low demand + rising inventory = downward pressure on price
I’m sure you can guess, we’re experiencing (b) at this point.
Here is a graph looking at new listing inventory for January 2023 (in pink) compared to January 2022 (in black) and the 10-year average (in grey):
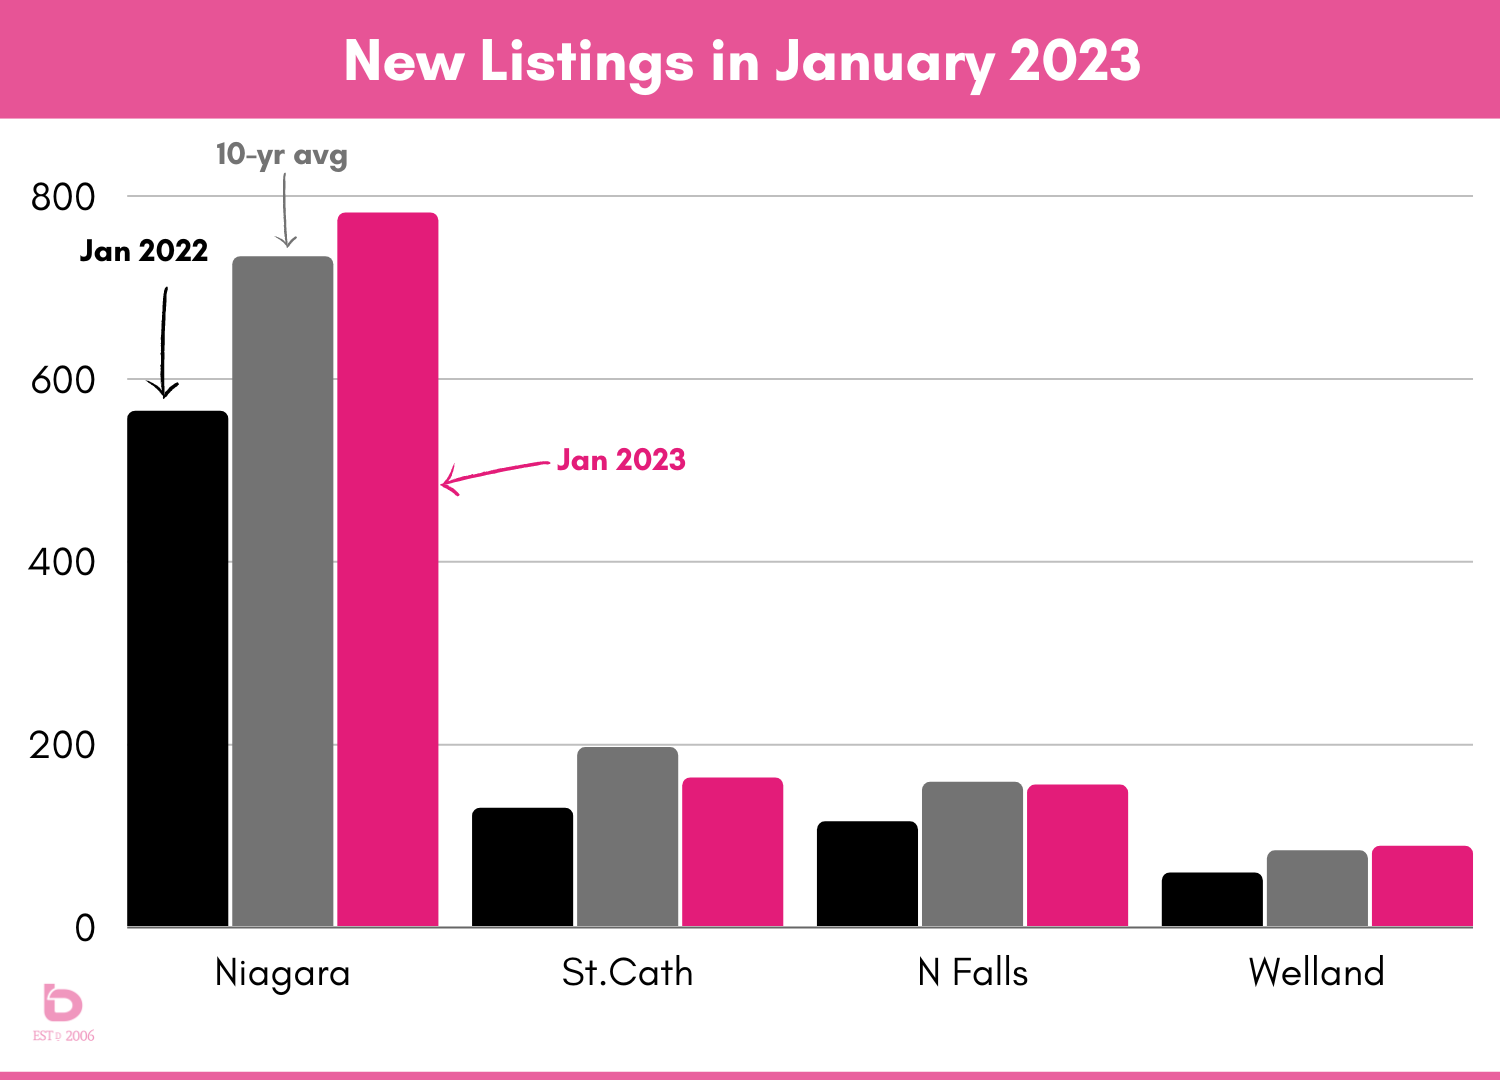
Essentially, the opposite story of the previous "Home Sales" graph.
SOME GOOD NEWS?
Any shred of good news is good news at this point. One of the things that complicated early 2022 was a lack of inventory in January. As a result, January 2023 looks over-inflated compared to January 2022.
However, here is the comparatively good news part.
The number of new listings in January 2023 are actually not that far off of the 10-year average, otherwise known as what was somewhat normal in the past. So, while inventory looks higher in general, compared to what is normal, it isn't too off the mark. The challenge is still buyer demand.
This chart shows the new listing inventory for all of Niagara year/year:
| City | Jan 2022 | Jan 2023 |
% change |
|
Niagara Region |
564 | 781 | + 38% |
|
St.Catharines |
129 | 162 | + 26% |
|
Niagara Falls |
113 | 154 | + 36% |
|
Welland |
59 | 87 | + 47% |
|
Niagara on the Lake |
35 | 34 | - 3% |
|
Thorold |
24 | 51 | + 113% |
| Grimsby | 36 | 60 |
+ 67% |
| Lincoln | 39 | 53 |
+ 36% |
| Fonthill | 18 | 28 |
+ 56% |
| Port Colborne | 39 | 46 |
+ 18% |
| Fort Erie | 56 | 84 |
+ 50% |
NIAGARA HOME PRICES
This is where comparing January 2023 to January 2022 reaches levels of absurdity. But again, it's important to remember that January 2022 set a record for largest one-month jump in average sale price, at least that we could find.
This graph shows you the average sale price for Niagara and each city for this January (in pink) to January 2022 (in grey):
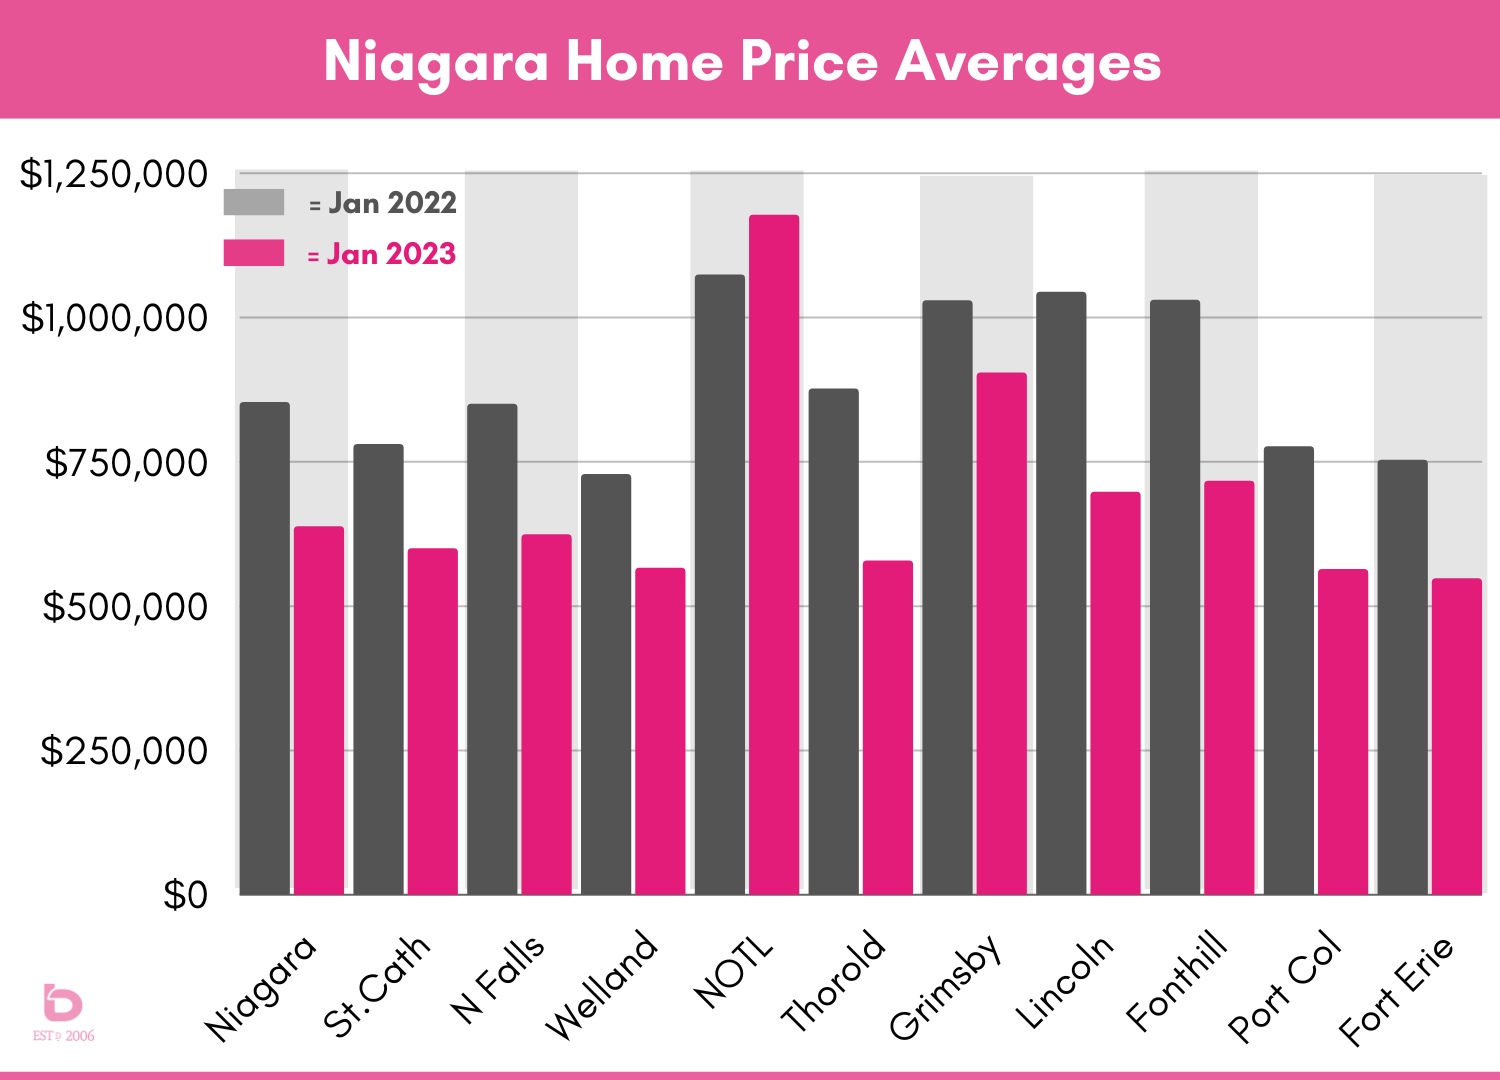
Yes, the Niagara-on-the-Lake average was actually UP in 2023 but looking closer, there were only 9 sales so a few higher sales easily skewed the data up.
The rest of the region was down an average of 26.2% year/year.
IS THERE A SILVER LINING?
Yes. Sort of. The market data looks worse than it is, only because early 2022 was so historically powerful. And that same imbalance will happen in February, March and April so we’ll have to get used to it.
Another consideration is in a town or city that has 15 or 18 monthly sales, a variance of 4 or 6 sales can indicate a drop or rise of 20 or 40%. When a small handful of sales can pull the data in one direction or another, an asterisk should be added.
LOOKING BACK A FEW YEARS
Another cause for optimism is to remember that you can only sell or buy in the market you’re selling or buying in, so if you’re a seller pining for the days of Q1 2022, it’s done and it’s gone. But...
That said, have a gander at this graph which is comparing where the market is in January 2023 compared to January 2020:
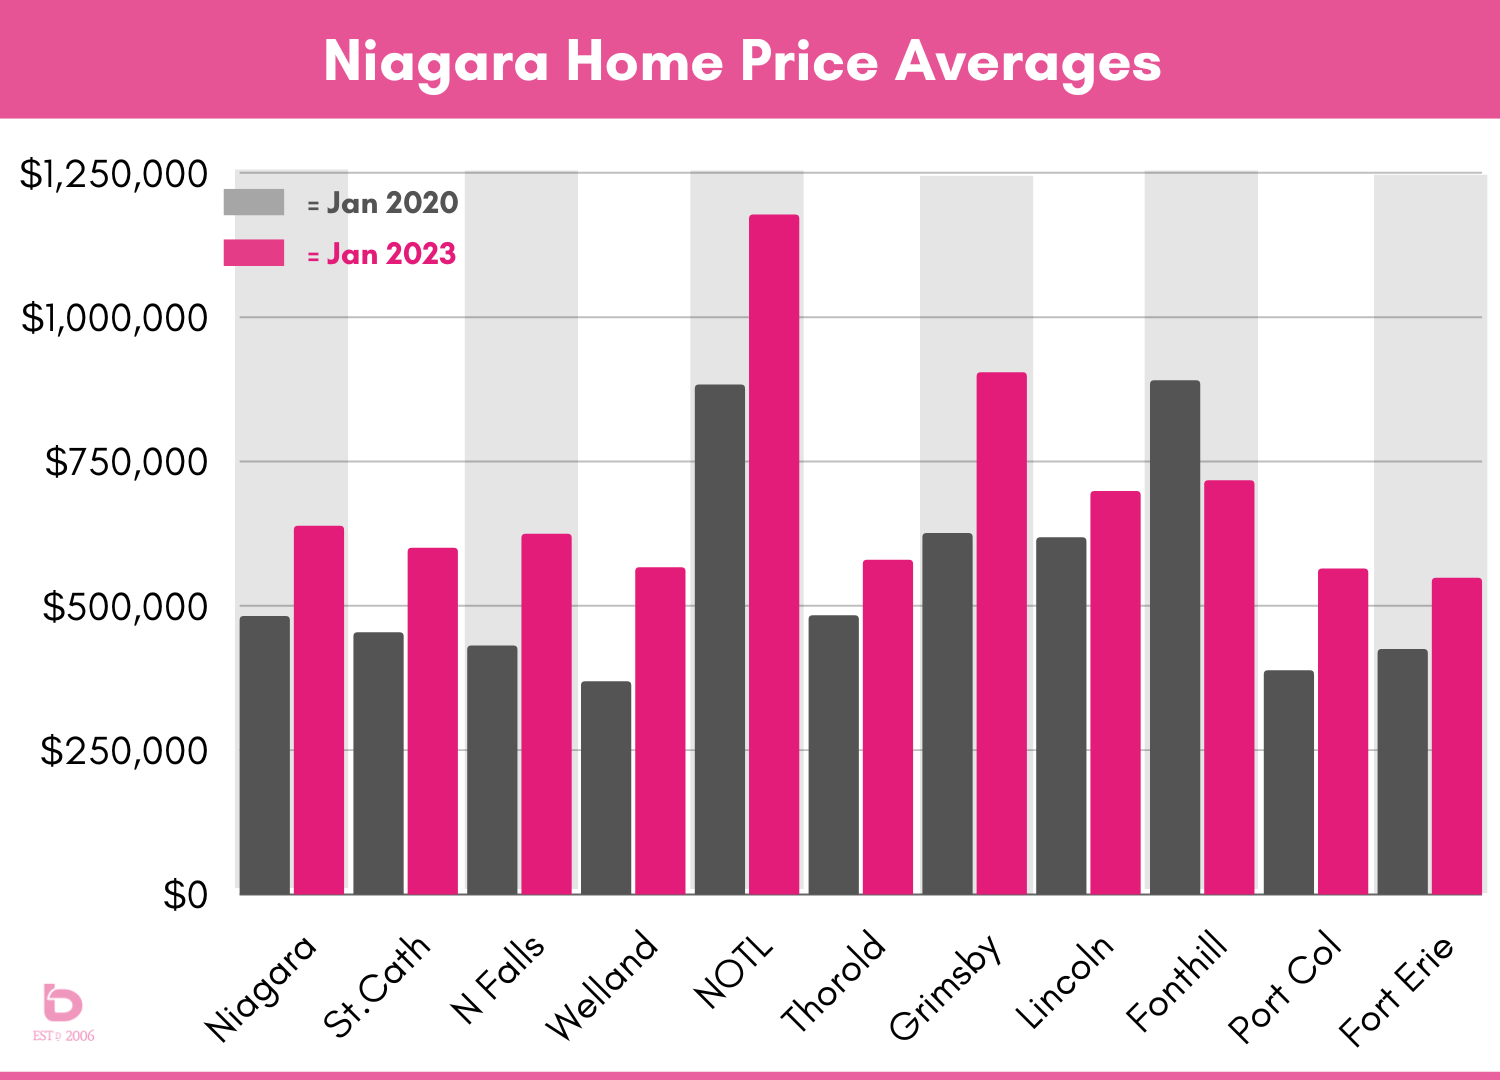
Similar to Niagara-on-the-Lake, a high-value, low-volume town like Fonthill will produce wonky data. We would consider the January 2023 average price of $716,000 for Fonthill to be an outlier. An example of why caution is needed when looking at monthly numbers, particularly in smaller market cities or towns.
WHAT IF YOU STILL HAVE TO SELL OR BUY?
Good news is it is still possible.
Houses are being sold and purchased everyday. Where people are running into issues is when there isn't a plan in place. How are we going to (a), (b) and (c) in these current market conditions?
Not to throw our hat in the ring, but if you are looking to succeed in this market, strategy and understanding the big picture will be keys to success. And we're big fans of all of the above.
CONCLUSION:
Beware of any and all market reports over the next several months. They are the stuff that media headline writers dreams are made of. They virtually write themselves.
Within each market, there are countless mini-markets that are based on location, type of home and current micro-market conditions.
If you’re looking to get a better handle on your home or your area of Niagara, please don’t hesitate to reach out. We’re always happy to chat.
CLICK HERE TO CONTACT US & LEARN MORE