
To quote the title of the classic jazz tune by Eddie Harris & Les McCann, when comparing anything to something, the question to ask is just that. Compared to what?
Persepctive.
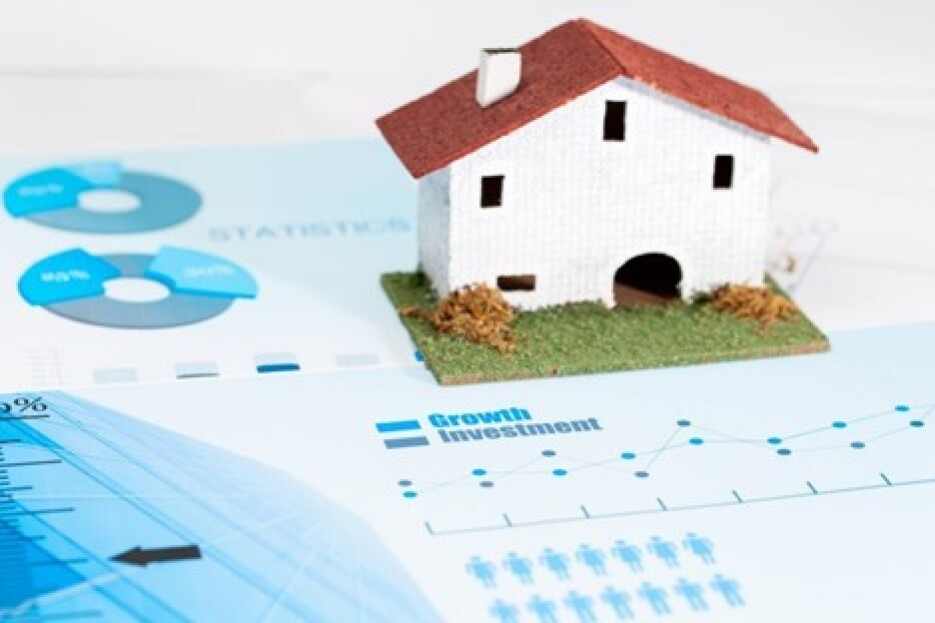
In our world, Niagara real estate in 2017 is being compared to 2016 simply because 2016 is the closest market in recent memory. But here’s the deal: 2016 was an unprecedented, never-before-experienced year.
2016 saw big increases in total sales volume (in some cases up over 20%), average sales prices (up nearly 30%) and a plunging days on market average (in some areas by 60%). Difficult to compare anything to that.
Compare this year to 2015, 2014 and 2013 and suddenly the numbers make more sense. Across the entire region, we saw the same trends from 2014 to 2015 to 2016 to 2017 as evidenced in our vLOG!
Here are the numbers that have a closer look across most of Niagara going back to 2014:
St. Catharines
Number of Sales
2014 751 sales
2015 912 sales
2016 962 sales
2017 795 sales
Average Sale Price
2014 $233,000
2015 $260,000
2016 $310,000
2017 $373,000
Days on Market
2014 43
2015 38
2016 25
2017 22
Niagara Falls
Number of Sales
2014 513 sales
2015 580 sales
2016 799 sales
2017 508 sales
Average Sale Price
2014 $243,000
2015 $275,000
2016 $340,000
2017 $366,000
Days on Market
2014 61
2015 53
2016 45
2017 27
Thorold
Number of Sales
2014 111 sales
2015 132 sales
2016 155 sales
2017 127 sales
Average Sale Price
2014 $228,000
2015 $235,000
2016 $294,000
2017 $355,000
Days on Market
2014 64
2015 53
2016 25
2017 27
Fonthill/Pelham
Number of Sales
2014 99 sales
2015 107 sales
2016 125 sales
2017 98 sales
Average Sale Price
2014 $381,000
2015 $418,000
2016 $464,000
2017 $574,000
Days on Market
2014 64
2015 59
2016 31
2017 25
Welland
Number of Sales
2014 304 sales
2015 332 sales
2016 413 sales
2017 319 sales
Average Sale Price
2014 $201,000
2015 $219,000
2016 $250,000
2017 $296,000
Days on Market
2014 62
2015 43
2016 27
2017 28
Fort Erie
Number of Sales
2014 265 sales
2015 295 sales
2016 376 sales
2017 181 sales
Average Sale Price
2014 $222,000
2015 $232,000
2016 $277,000
2017 $336,000
Days on Market
2014 85
2015 76
2016 52
2017 41
So the next time you’re at the hair salon, hockey rink, dinner party or lunchroom at work, if you hear someone say that the market is flat or turned negative, do your best Eddie Harris impression and ask “compared to what?”
The market is still very much alive and ticking. To discuss the market, your home or real estate in general, contact us anytime.
As always, thank-you for visiting.
THEbTEAM