

What a year. On so many levels, 2020 is, has and will be an unforgettable year.
This bLOG will focus purely on the real estate market but that is not to diminish from the impacts that COVID is having on the big picture.
In general, the market has been a roller coaster of sorts. A year where the sales volume plummeted at the end of March through April only to see it storm back and set records 3 months later in July.
A year where the average sale prices set a record early in the year, only to have those same records absolutely trounced over and over again throughout the year.
Fact:
Niagara had never had a month with an average sale price over $500,000 until February 2020 when the average sale price was $501,647. In November 2020, only 9 months later, the average price was a stones throw from cracking $600,000. Thats nearly $100,000 in 9 months.
What is driving it all?
On a pure numbers level, it is a by-product of supply vs demand. It is the result of 5 months of historic record breaking monthly sales volume colliding with relatively unchanged new listing inventory. Imagine you own a widget making factory. Your widget sales are up 42% but you continue re-stocking your shelves as if sales are normal.
What happens? The price of your widget goes up. And in Niagara, the widget prices have definitely gone up...
For example, for Sept - Nov (91 days) in 2020 vs 2019:
Niagara Region
# of Sales up 40.2%
# of New Listings up 3.3%
Average Sale Price up 24.8%
St.Catharines
# of Sales up 5.9%
# of New Listings down 1.1%
Average Sale Price up 21%
Niagara Falls
# of Sales up 61%
# of New Listings up 16%
Average Sale Price up 24%
For better perspective, have a look at this graph. This shows you the difference in SUPPLY (number of new listings) and DEMAND (number of sales).
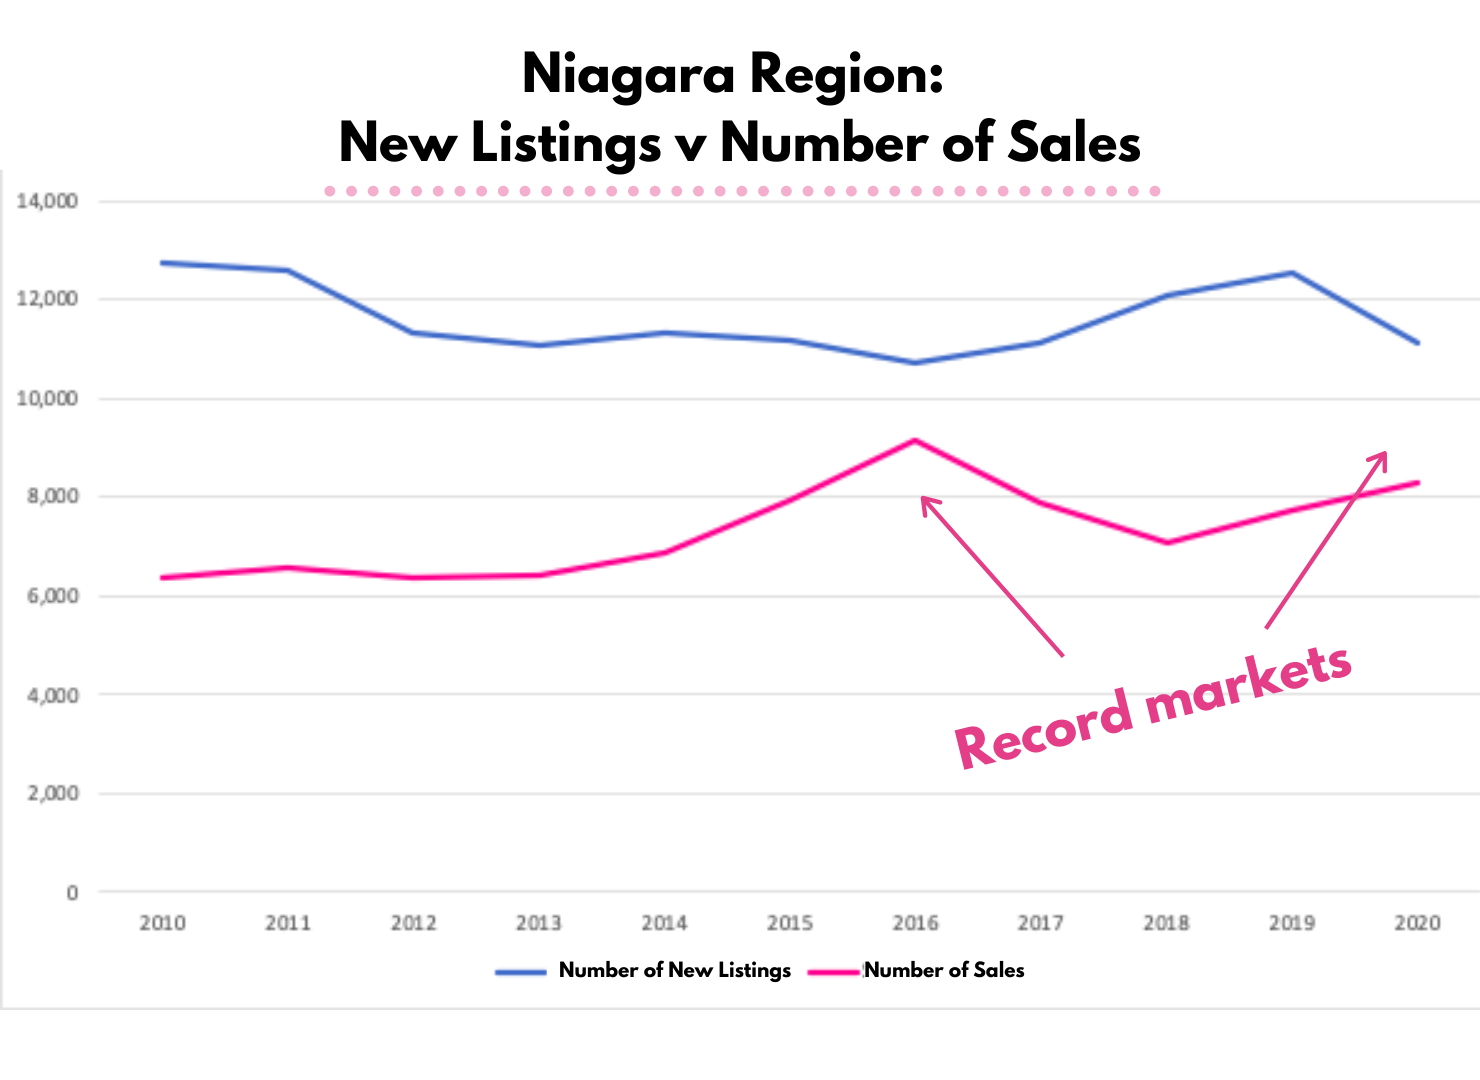
Notice the gap back in 2010 and 2011 when there were approximately 2 new listings for every sale. As we moved towards 2016, the ratchet slowly tightened...and we all know what happened in 2016.
2016 was the year that set an all-time record in sales (9,156) and a record (at that time) in price increase with a 17.7% increase year over year. That supply crunch went on to feed a 22.1% increase in 2017.
Then as we got into 2018 and 2019, things softened somewhat until COVID knocked the market on its back in mid-March. Since then we have seen a massive increase in sales run up against decreasing new listing inventory. In fact, the differential between new listings and sales is at its 2nd lowest this decade.
This graph tells the story:
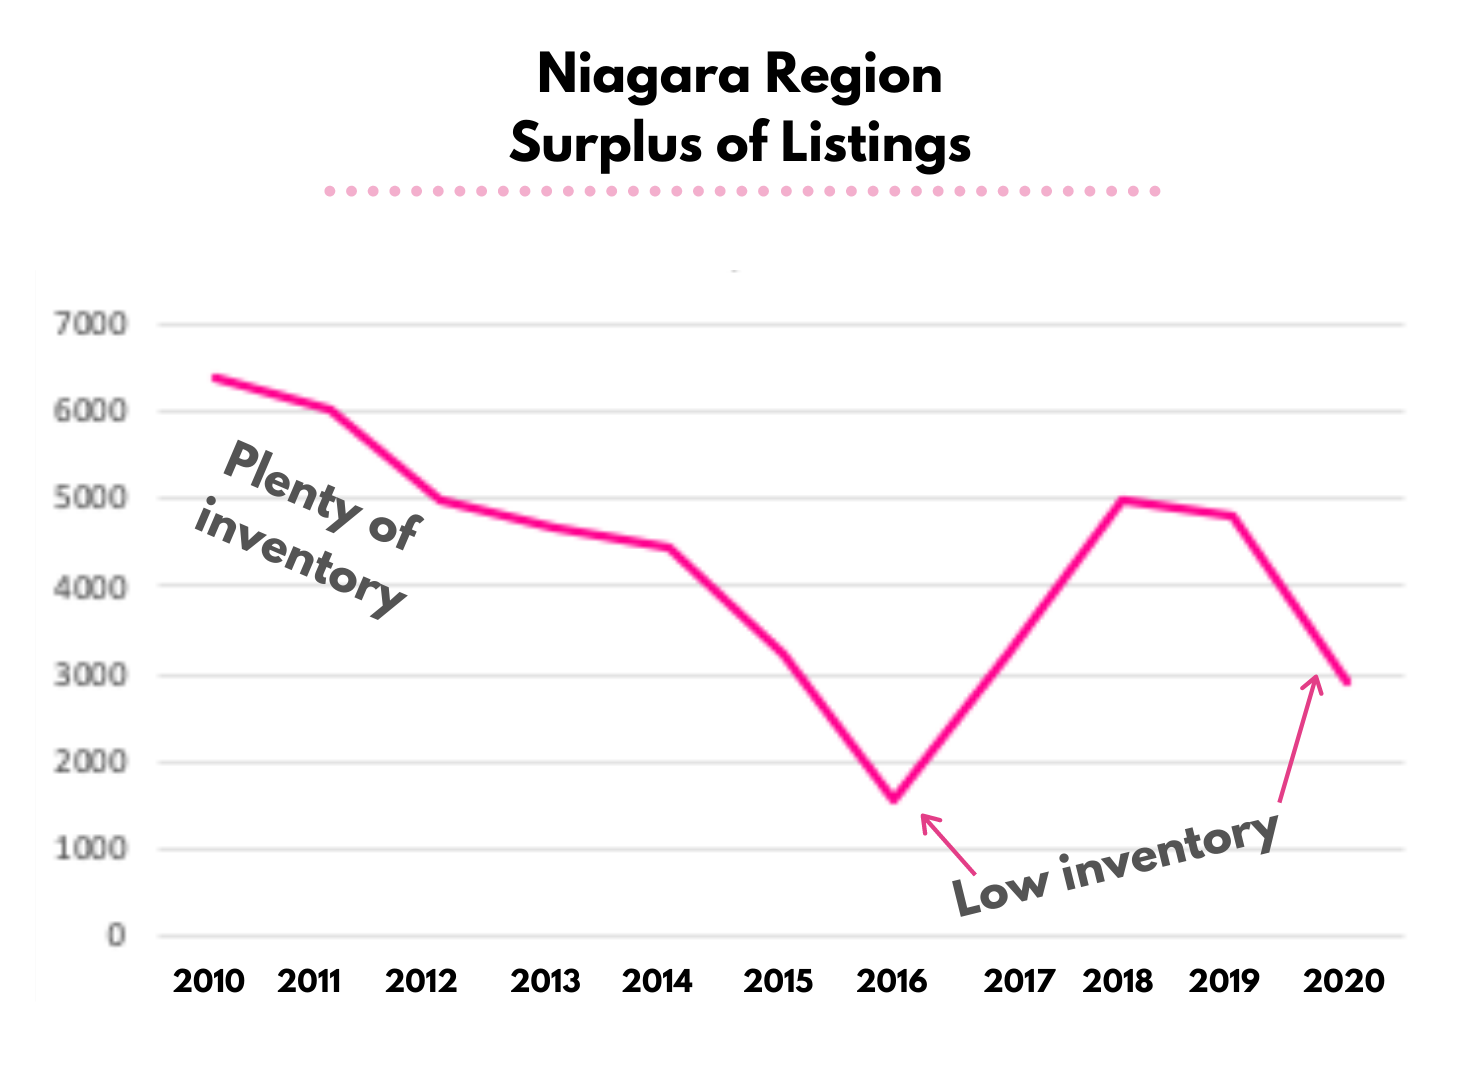
So, less widgets combined with more buyers equals an average sale price that is now firmly in 2nd place all-time in annual increase.
The Top 3 Years
#1: 2017 up 22.1% ($406,223)
#2: 2020 up 20.2% ($551,081 as of today Dec 7th)
#3: 2016 up 17.3% ($332,759)
Would increased inventory help? Absolutely. When we hear about multiple offers in all segments of the market, that tells you this isn't an issue tied to one price bracket. 20 offers on a home in the $300s. 3 offers on a home in the millions. Line-ups, stress, frustration. This market is bringing all to the table.
Here is the same data for our 2 largest volume cities, St.Catharines & Niagara Falls:
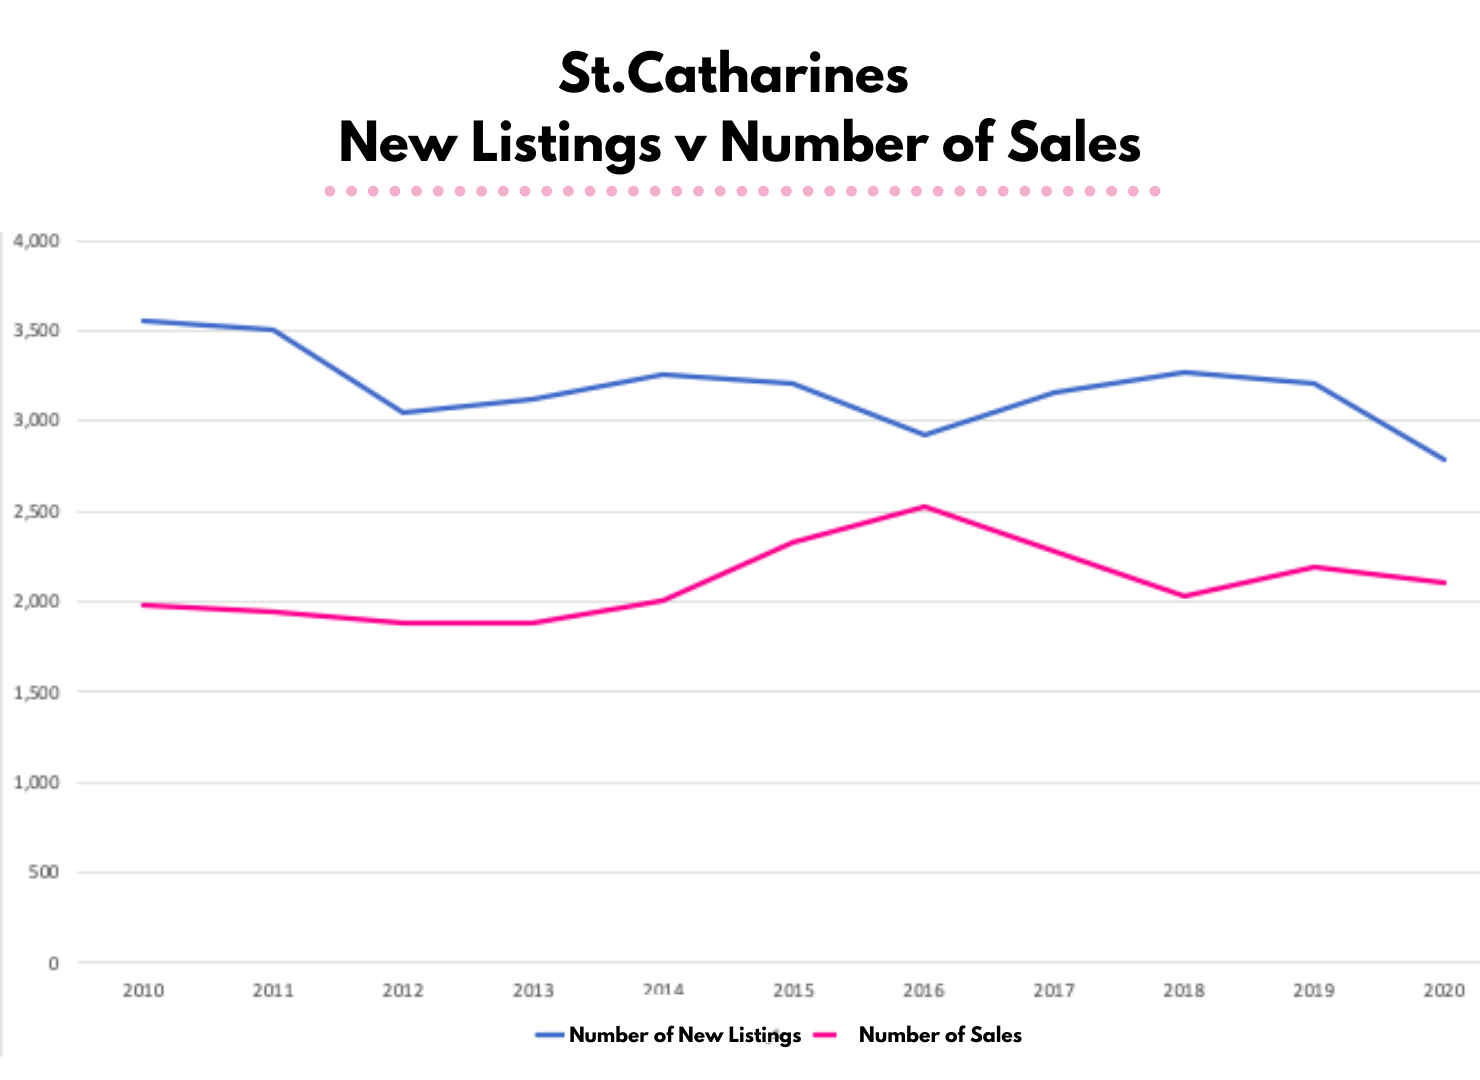
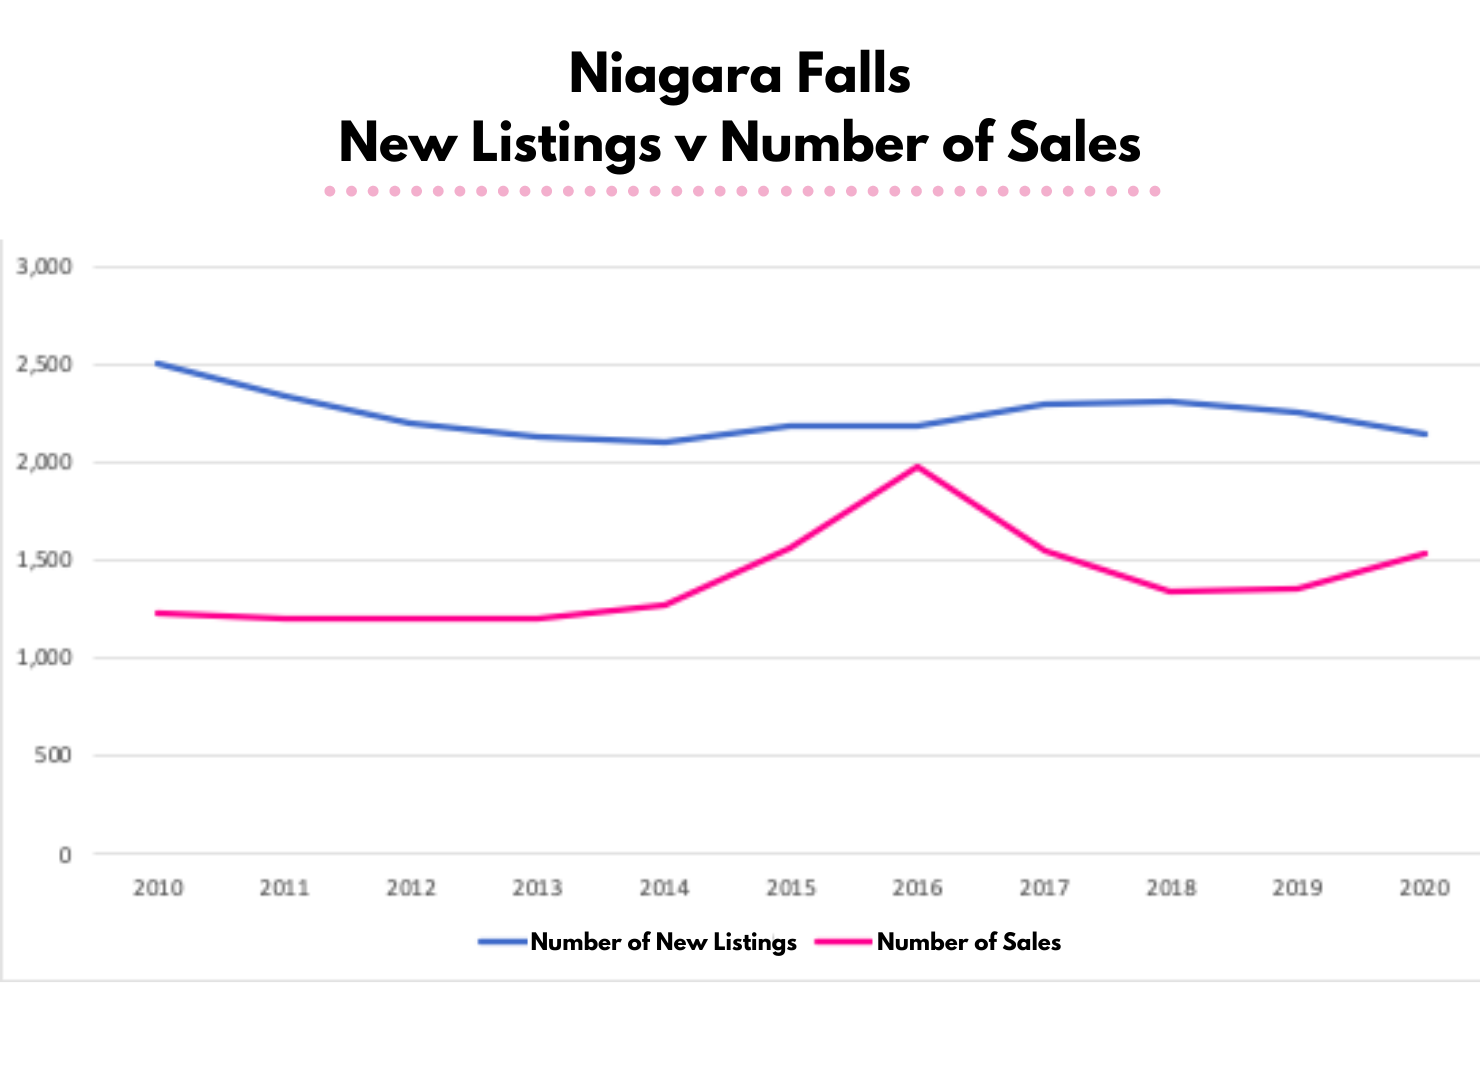
Notice a trend?
Lack of supply, plain and simple.
Want to watch the motion picture version of this epic tale? Have a watch here. Questions, thoughts or comments are always welcome as well.
Thank-you for visiting.