
Date Posted: 02/05/2023
Market Update - April 2023
So far, 2023 is a case study in supply & demand. In particular, what happens with pricing and overall activity when both inventory (number of new listings) and demand (number of sales) run at similar (below average) levels.
In a way, this (low) market equilibrium is what is keeping pricing on the positive side year-to-date.
How so? The monthly trend is weakening supply (number of new listings) while demand has leveled out or slowly improved. While they are both well below historic averages, the result of that combo is pricing has edged up about 2-3% per month for much of Niagara.
Let’s have a look.
NIAGARA REGION
What this graph means.
Green line = the 10-year average so anything above the green line is above average while anything below is below average.
Grey line = the number of new listings
Pink line = the number of sales
You’ll see that while the number of monthly sales has sat in a similar range the last 90 days (13 – 17% below average), the number of monthly new listings has continually decreased.
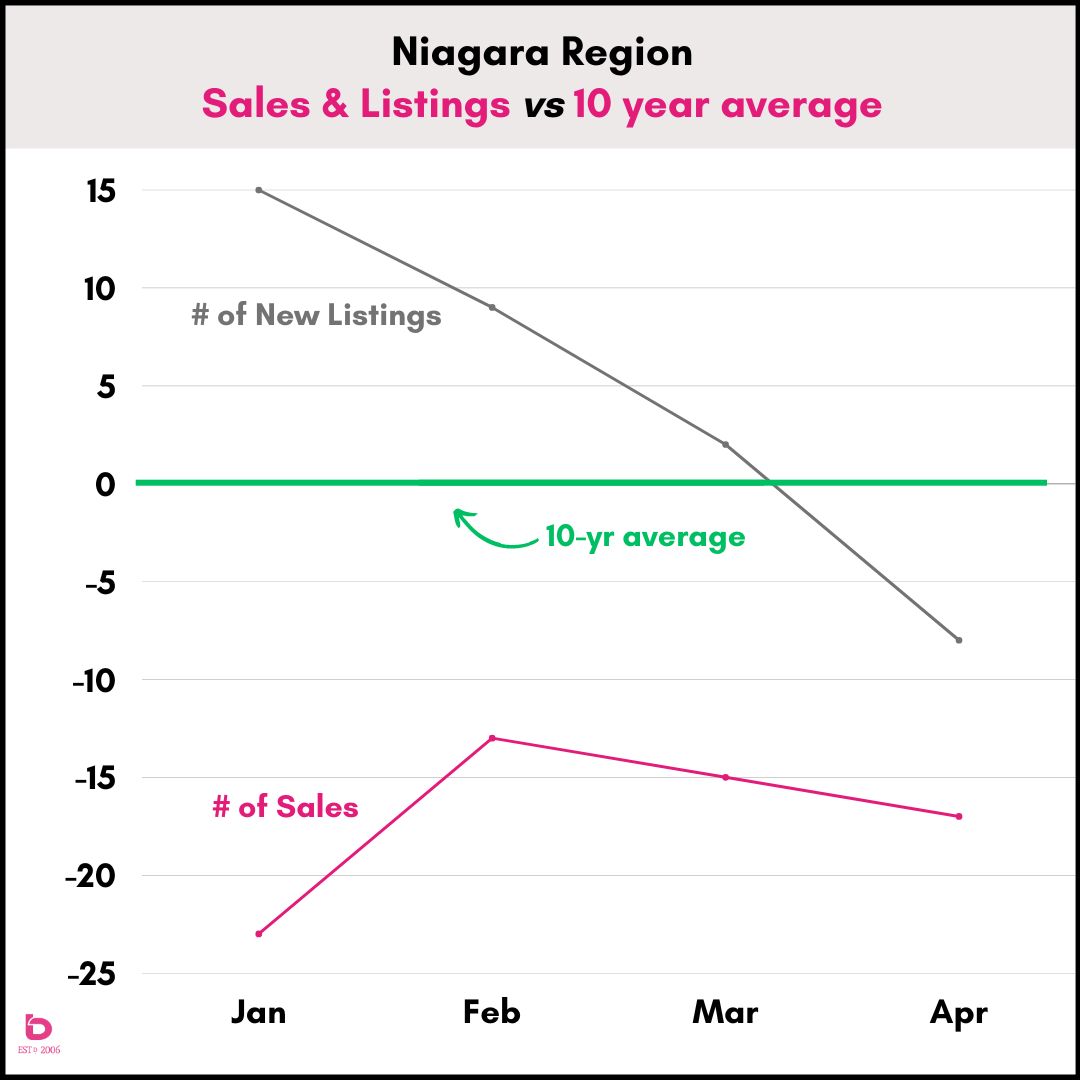
Luckily the market is not summed up simply by the number of sales in a given month. Keep reading…
How are sales in relation to normal?
This graph shows you the number of monthly sales for 2022 (in pink), 10-year average (in purple) and for the sake of comparison, 2022 (in green).
Our only real concern with this graph is that monthly sales in both March and April 2023 took small steps back from the preceding month (-2%).
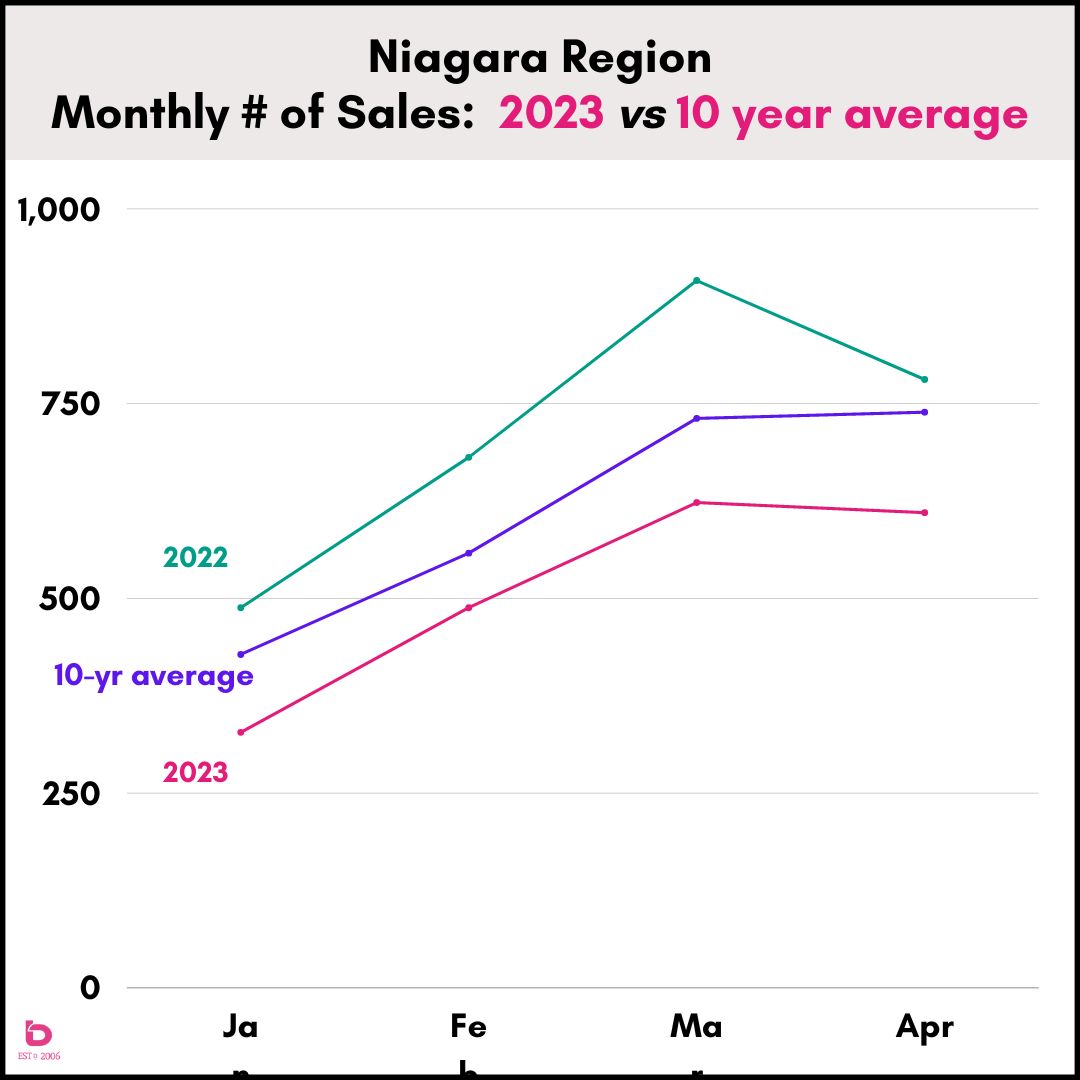
Thankfully (for the time being), the monthly number of new listings trend has continued to pull back which is the only reason that price trends have performed as well as they have.
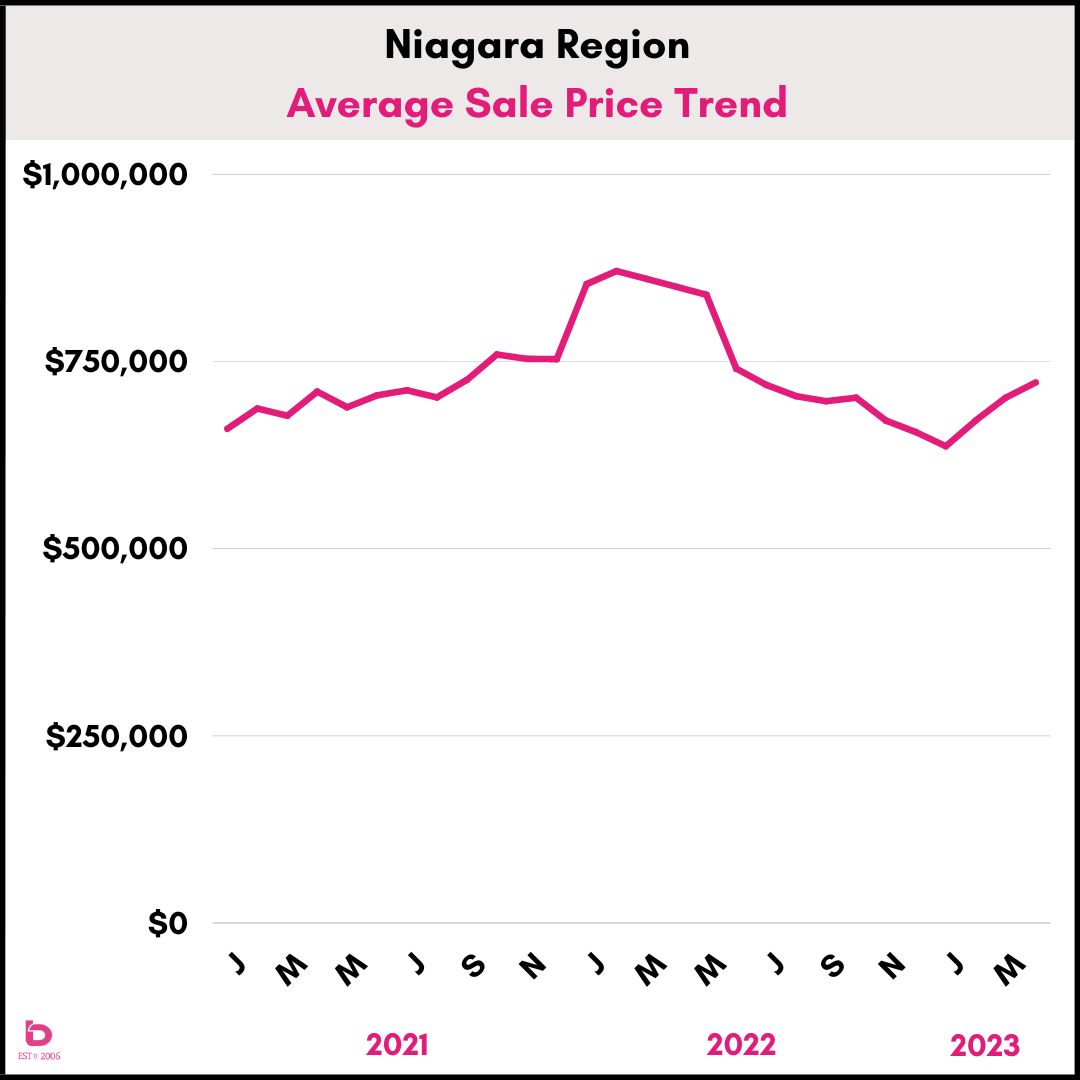
How are sale prices?
This bumpy graph is a very visual representation of how ‘unique’ early 2022 was. After the unprecedented jump up, and then down, in average sale prices, the pricing trend quickly rolled to the bottom by the end of last year.
What stabilized into 2023 was buyer confidence found its footing as inventory eased back. The result is a positive price trend so far this year.
Narrowing the scope a little bit, this graph shows you the last 6 months for average sale prices in Niagara for all residential (in black) as well as detached homes (in green).
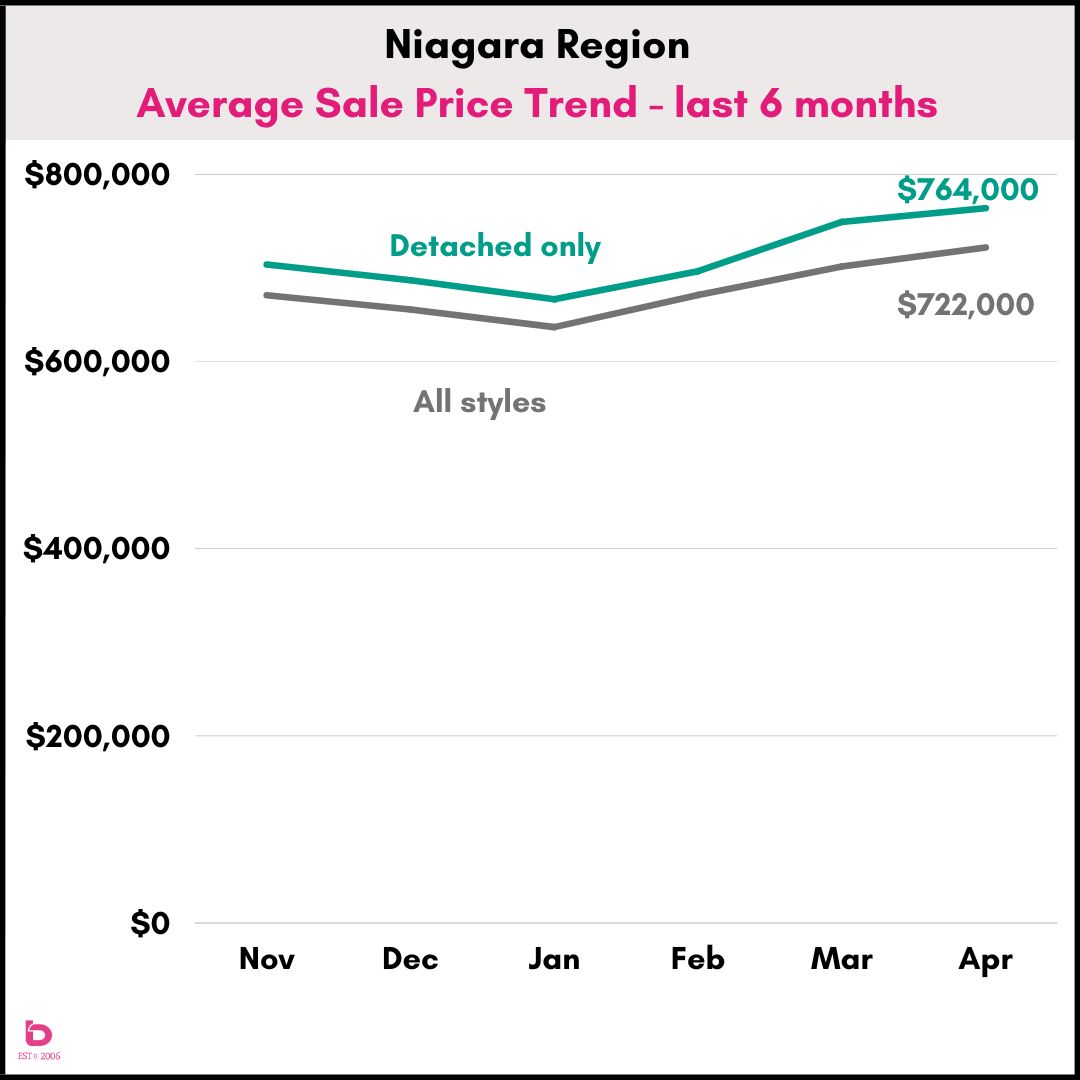
For the majority of Niagara municipalities, December 2022 or January 2023 was the market low point. It will be important to keep track of that supply and demand as we go forward.
The Big 3
Here is the same graph (with the 10-year green line) for the 3 busiest cities in Niagara.
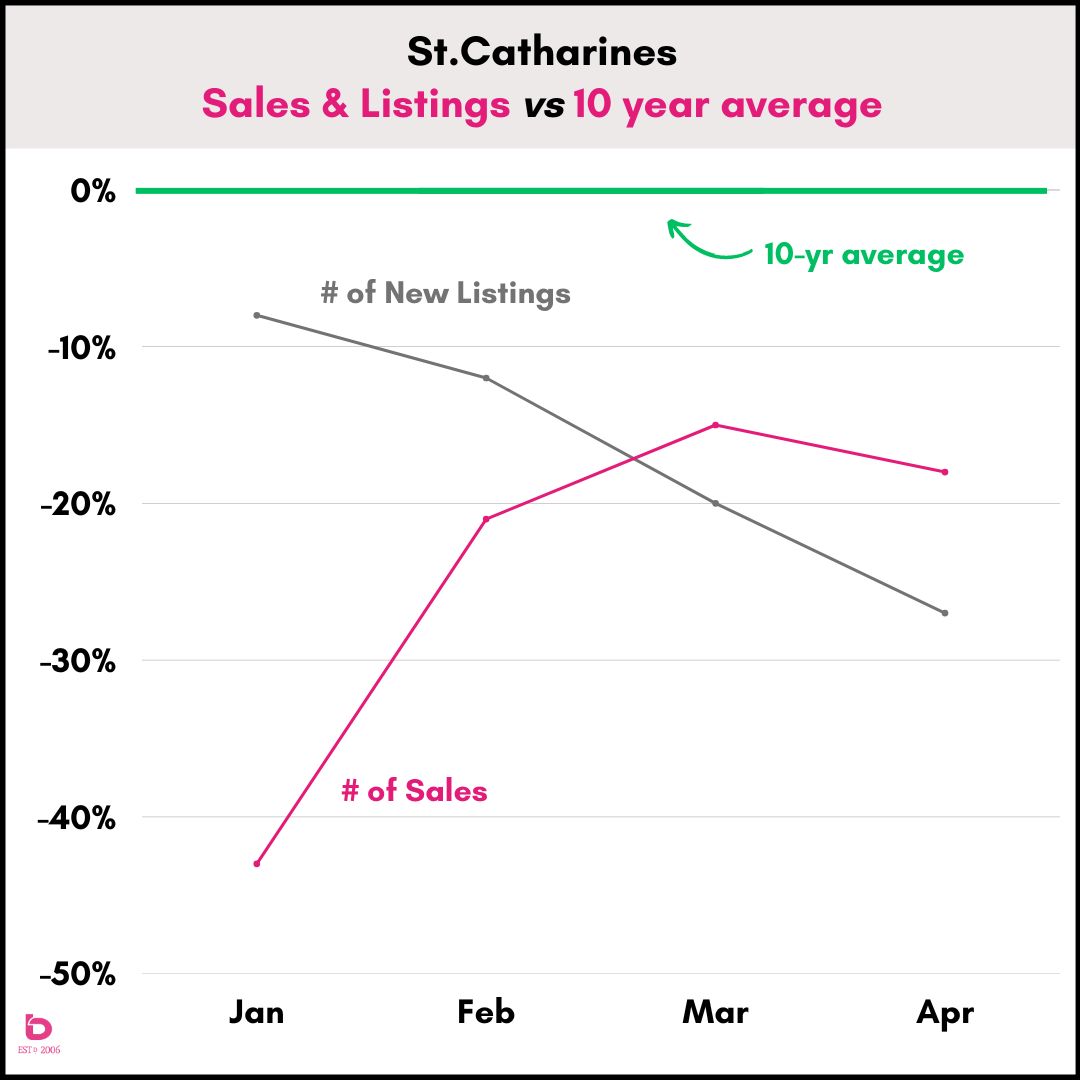
St.Catharines
Notice that the green line is up at the top meaning that both the number of new listings and the number of sales in St.Catharines have been (significantly) below average so far in 2023.
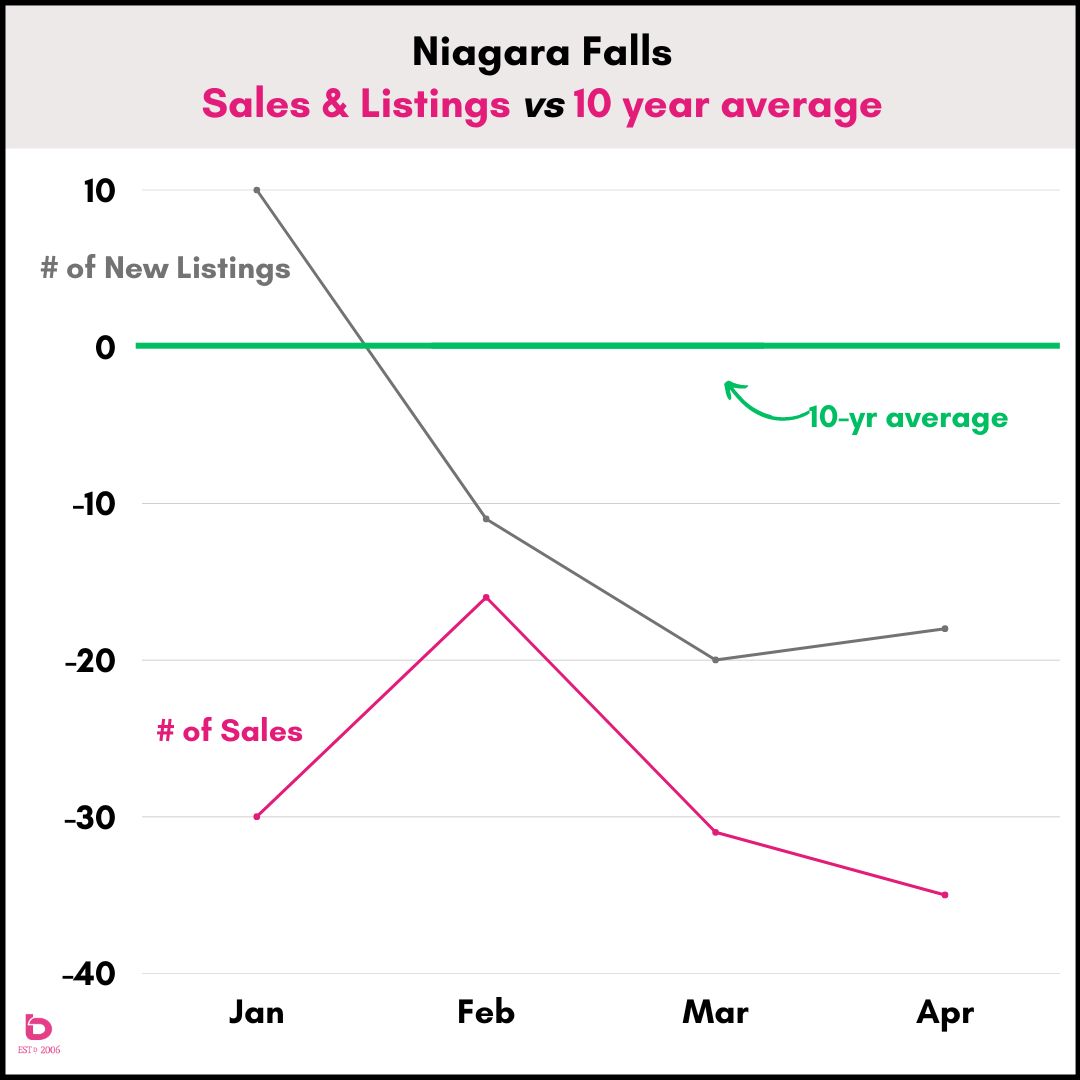
Niagara Falls
Wow. Quite a wild ride over the last year. In fact, April 2023 was the 11th month in a row with less than 100 monthly sales. We looked back for nearly 15 years and couldn’t find another example of that happening.
Also, watch out for the movement of increasing supply (grey line) while sales pull back (pink line). That will lead to decreasing prices into the summer.
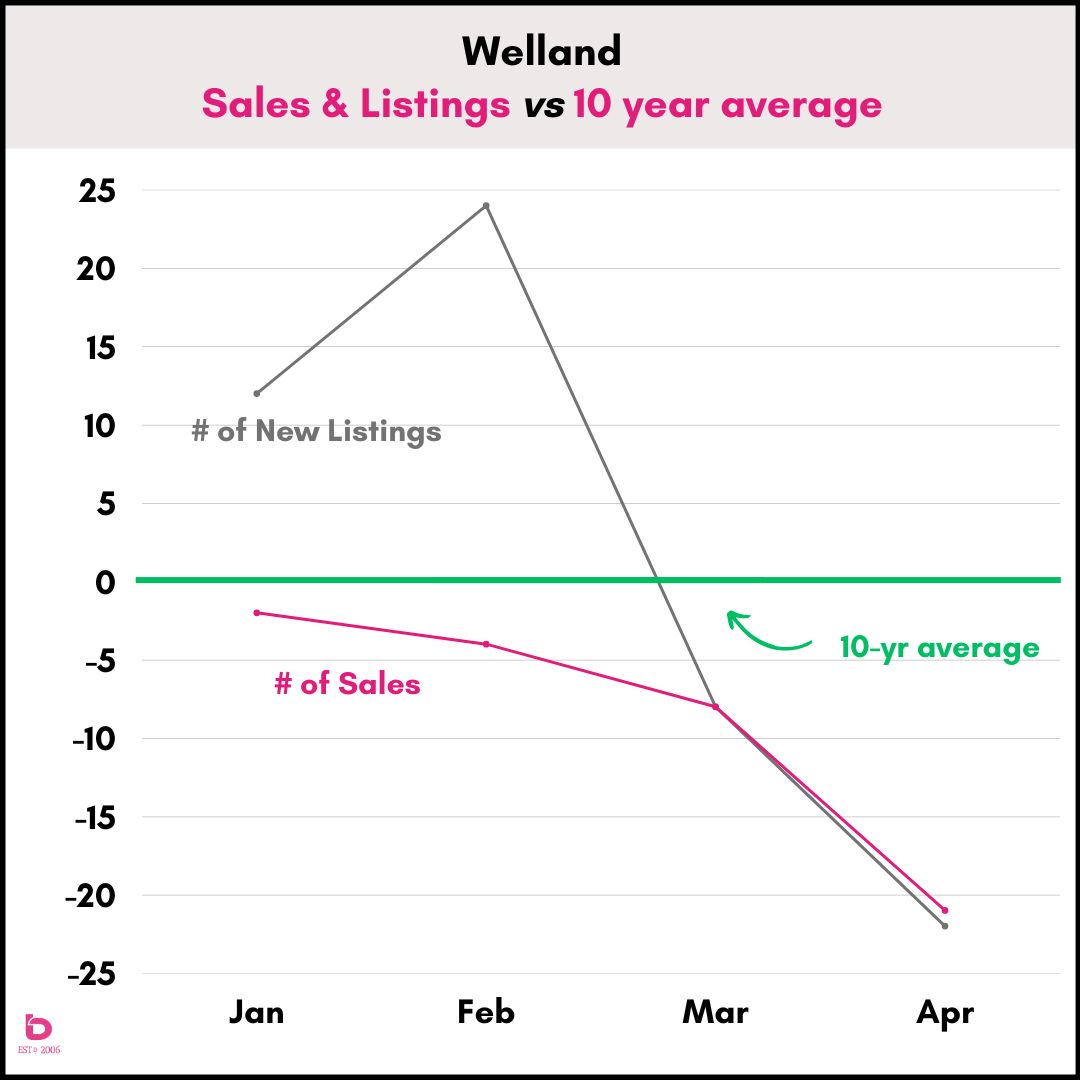
Welland
After a significant jump in inventory in February, the following few months have been in a freefall. Good news for pricing though is that the number of monthly sales have been equally weak. This graph will show it well.
How about average sale prices?
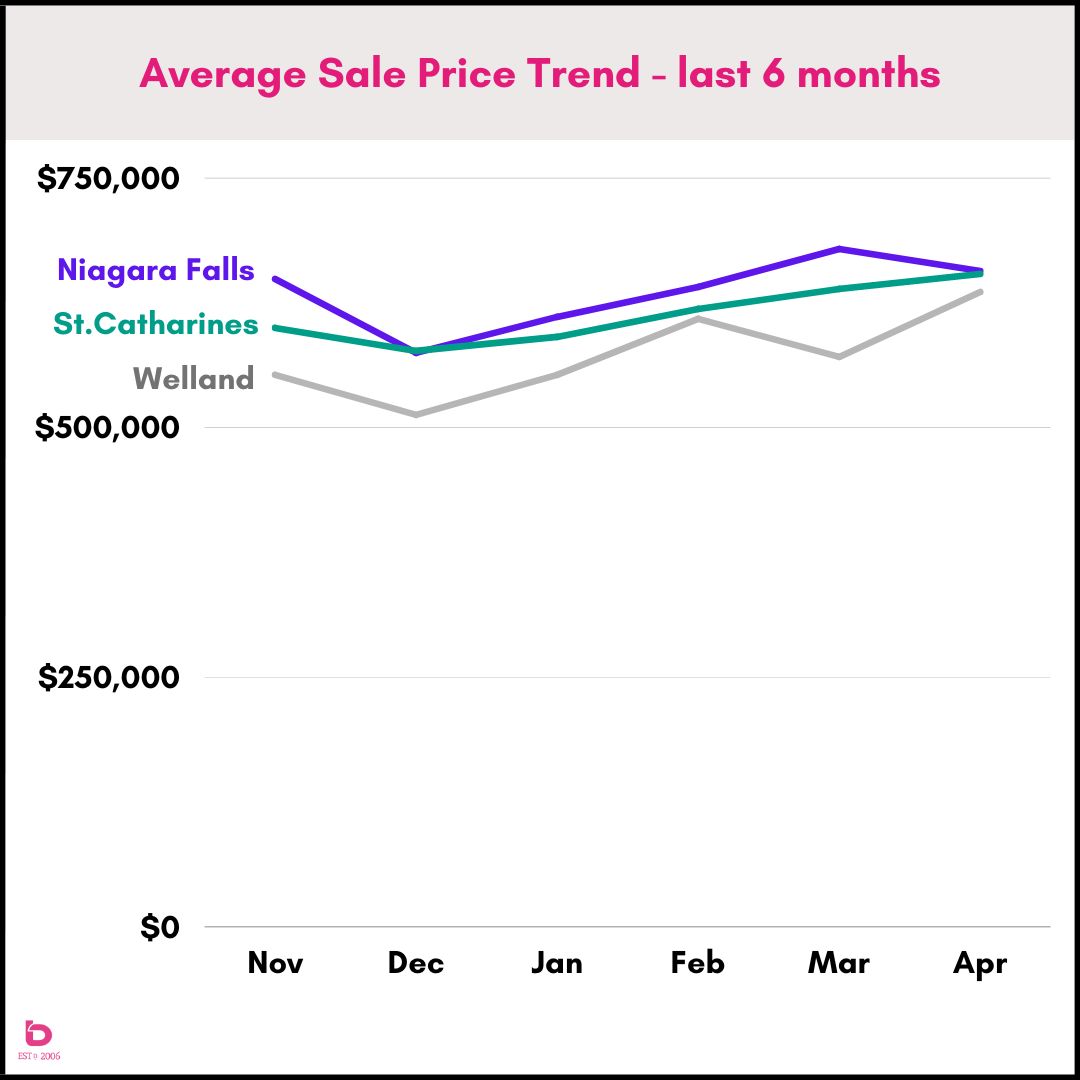
Here are the prices for the last 6 months for those cities.
In particular, April 2023 averaged:
St.Catharines $654,000
Niagara Falls $657,000
Welland $636,000
Again, referencing back to the balance of supply & demand, these price changes are all logical.
St.Catharines: sales were stable while inventory pulled right back = less choice for buyers = increasing prices.
Niagara Falls: inventory is increasing while sales pulled back = more choices for buyers = decreasing prices.
Welland: both inventory and sales dropped significantly in April = weak but equilibrium = increasing prices.
What happens next?
As each city starts to carve out it's own path, it will be important to get a bit more specific when summarizing the market. And that same concept applies to all smaller markets in Niagara including Niagara-on-the-Lake, Grimsby, Lincoln, Fonthill, Welland, Thorold, Port Colborne or Fort Erie.
Our expectation for this summer is we'll have a quiet, almost 'boring' market as inventory and sales continue to lag below normal levels.
Stay tuned and keep in touch.